


Abstract
Hypoxic regions are present in different types of cancer and are a negative prognostic factor for disease progression and response to therapy. 18F-fluoroazomycin-arabinofuranoside (18F-FAZA) and 64Cu-diacetyl-bis(N4-methylthiosemicarbazone) (64Cu-ATSM) have been widely used to visualize hypoxic regions in preclinical and clinical studies. Although both these radioligands have high signal-to-noise ratios, 64Cu-ATSM may be suitable for use in in vivo imaging and as a radiotherapeutic agent. Despite encouraging results suggesting that it may have a role as a prognostic tracer, 64Cu-ATSM was recently shown to display cell line–dependent kinetics of oxygen-dependent uptake. We set out to evaluate the kinetics of 64Cu-ATSM distribution in different cancer models, using 18F-FAZA as the gold standard. Methods: 18F-FAZA and 64Cu-ATSM uptake were compared ex vivo using dual-tracer autoradiography and in vivo using PET in different xenograft mouse models (FaDu, EMT-6, and PC-3). 18F-FAZA uptake was compared with 64Cu-ATSM uptake in PET studies acquired at early (2 h after injection) and delayed time points (24 h after injection). To evaluate the presence of hypoxia and copper pumps, the tumors from animals submitted to PET were harvested and analyzed by an immunohistochemical technique, using antibodies against carbonic anhydrase IX (CAIX) and copper pumps (Ctr1 and ATP7B). Results: 64Cu-ATSM showed a higher tumor-to-muscle ratio than did 18F-FAZA. In the FaDu mouse model, radioactivity distribution profiles were overlapping irrespective of the hypoxic agent injected or the time of 64Cu acquisition. Conversely, in the EMT-6 and PC-3 models there was little similarity between the early and delayed 64Cu-ATSM images, and both the radiotracers showed a heterogeneous distribution. The microscopic analysis revealed that 18F-FAZA–positive areas were also positive for CAIX immunostaining whereas immunolocalization for copper pumps in the 3 models was not related to radioactivity distribution. Conclusion: The results of this study confirm the cell-dependent distribution and retention kinetics of 64Cu-ATSM and underline the need for proper validation of animal models and PET acquisition protocols before exploration of any new clinical applications.
The hypoxic microenvironment within tumors promotes both local invasion and distant metastasis and is associated with resistance to radio- and chemotherapy, including treatments with novel targeted drugs (1–4). The activation of hypoxia-inducible factors (HIFs) is a key step in hypoxia-induced modifications of cell phenotype, for example, metabolic reprogramming, angiogenesis, extracellular matrix remodeling, and changes in cell motility and migration (5,6). Reduced oxygen tension also acts on the regulation of cancer stem cells, conferring a proinflammatory phenotype and increasing tumor resistance by activating a surviving pathway (7). The limited efficacy of antiangiogenic agents was recently suggested to be due to hypoxia-driven stem or progenitor cell enrichment (8), and a combination therapy based on anti–stem cell or anti-HIF agents has been proposed as a means of increasing their efficacy (2,9).
For these reasons, hypoxic areas, if accurately identified and localized, constitute both an important research resource and potential biomarkers for patient stratification or prediction of therapy efficacy. Regional tissue hypoxia can be visualized using PET and radiopharmaceuticals characterized by an oxygen-dependent mechanism of cellular uptake.
Reduction in oxygen tension was first visualized using 2-nitroimidazole 18F-fluoromisonidazole (18F-FMISO) (10). However, because of its slow clearance from blood and nontarget tissues, which limits its signal-to-noise ratio, a series of new potential tracers has been developed and tested as hypoxia-visualizing agents. Among the various compounds evaluated, another 2-nitroimidazole compound, 18F-fluoroazomycin-arabinofuranoside (18F-FAZA), and the 60Cu- or 64Cu-labeled complex 64/60Cu-diacetyl-bis (N4-methylthiosemicarbazone) (64/60Cu-ATSM) showed the most favorable profiles for further use in both preclinical and clinical research (11–13). 18F-FAZA becomes trapped in cells after a multistep bioreductive reaction (10), and its hypoxia-dependent uptake has been extensively validated in ad hoc in vitro and in vivo preclinical studies. In addition, the rapid clearance from blood and normal tissues of 18F-FAZA results in tumor-to-muscle ratios that are higher than those of other 2-nitroimidazoles, including 18F-MISO (11,14).
60/64Cu-ATSM has a low molecular weight and a high cell membrane permeability and thus diffuses easily from the bloodstream to surrounding cells. Like 18F-FAZA, 64Cu-ATSM accumulates in hypoxic tissue, giving rise to high signal-to-noise ratios.
An inverse correlation between radioactivity concentration in tumors and clinical outcome was found when using 60/62Cu-ATSM in patients with non–small cell lung cancer and cervical carcinoma. In addition, threshold values able to predict clinical outcome in different types of tumor including head and neck, lung, and uterine and cervical cancer have been identified (15–17). Another advantage of ATSM when labeled with 64Cu is that it can be used not only for imaging but also for internal radiation therapy thanks to its β− particle and Auger electron emission. The therapeutic effect of 64Cu-ATSM was recently demonstrated by Yoshii et al. in a mouse colon carcinoma model. In this study, 64Cu-ATSM reduced not only the tumor volume but also the metastatic ability of the colon cancer cells (18). In addition, 64Cu-ATSM has been successfully used in combination with 2-DG (a chemotherapeutic agent that enhances highly glycolytic cell radiosensitivity) to treat aggressive mouse EMT-6 mammary carcinoma (19).
Despite these promising data, the oxygen-dependent mechanism of cellular uptake of this compound is still debated and the optimal time window for hypoxia imaging is not clearly defined. In addition, the kinetics of 64Cu-ATSM uptake are cell line–dependent (12). This issue has been explored in vivo in a limited number of mouse models. In the R3327-AT rat prostate cancer model, a redistribution of tracer uptake between early and delayed images was observed, with only the late uptake pattern found to be hypoxia-dependent. However, this is not a general behavior; indeed, in FaDu head and neck and 9L brain sarcoma cells from mouse models 64Cu-ATSM distribution overlapped that of 18F-MISO at early postinjection time points (20,21). Differences in expression or activity of the heavy metal exporter ATP7B or a dual-phase uptake mechanism have been suggested to have a role in the cell line dependence of 64Cu-ATSM redistribution (20–24). However, other factors, such as pH changes, oxidative stress, and the activity of the mitochondrial electron transport chain, seem to influence the cellular trapping of 64Cu-ATSM (25).
To further evaluate this issue and finally to assess the distribution kinetics of 64Cu-ATSM, we compared the distribution (both early and delayed) of 64Cu-ATSM with that of 18F-FAZA, chosen as a gold standard, in different mouse models of cancer: mouse mammary carcinoma (EMT-6), human pharyngeal carcinoma (FaDu), and human prostate adenocarcinoma (PC-3), all characterized by aggressiveness, rapid growth, and the presence of hypoxic areas. We measured regional radioactivity distribution in tumor tissue after injection of 64Cu-ATSM and of 18F-FAZA radioligands, in the same animals, using either in vivo PET or ex vivo autoradiography. In addition, the presence of hypoxia, as measured by carbonic anhydrase IX (CAIX), and of copper pumps was evaluated postmortem in the same group of animals using immunohistochemistry.
MATERIALS AND METHODS
Cell Cultures
18F-FAZA and 64Cu-ATSM dual-tracer autoradiography and PET studies were performed using cell lines from different xenograft mouse models: EMT-6, PC-3, and FaDu. The cell lines were all obtained from American Type Culture Collection. The cell lines were routinely cultured at 37°C in a 5% CO2-humidified incubator using Waymouth medium (Sigma Aldrich S.r.l.) and Dulbecco modified Eagle medium (Sigma Aldrich S.r.l.) for EMT-6 and PC-3 cells, respectively, supplemented with 10% heat-inactivated fetal calf serum (Gibco-Invitrogen S.r.l.), penicillin (100 units/mL) and streptomycin (100 mg/mL) (EuroClone S.p.a.), and 2 mM l-glutamine (EuroClone S.p.a). For the FaDu cell line, Dulbecco modified Eagle medium (Sigma Aldrich S.r.l.) supplemented with 10% heat-inactivated fetal calf serum (Gibco-Invitrogen S.r.l.), penicillin (100 units/mL) and streptomycin (100 mg/mL) (EuroClone S.p.a.), 2 mM l-glutamine (EuroClone S.p.a), and 1 mM sodium pyruvate (EuroClone S.p.a) were used.
Animal Models
BALB/c nu/nu mice (age, 6–7 wk) were purchased from Charles River Laboratories. The animals were housed under specific pathogen-free conditions and handled and kept in compliance with our institution’s Ethics Committee regulations on the care and use of experimental animals. The mice were inoculated with 2 × 10⁶ cells injected subcutaneously into the right hind leg. EMT-6 cells were implanted into female mice and PC-3 and FaDu cells into male mice. After cell injection, the animals were monitored weekly for weight and tumor growth (volume = (a × b2)/2; a: long side, b: short side). At the end of the experiments, animals were sacrificed by CO2 asphyxiation.
Study Design
The study was divided into 3 phases. First, we performed ex vivo dual-tracer autoradiography, comparing, in the same animals, 18F-FAZA intratumor distribution with the early accumulation of 64Cu-ATSM. In the second phase, we performed in vivo PET studies to compare, in the same animals, intratumor distribution of 18F-FAZA with both early and delayed accumulation of 64Cu-ATSM. Finally, PET data were validated using immunohistochemistry analysis in tumor samples collected postmortem.
Ex Vivo and In Vivo Comparison of Intratumor Uptake of 18F-FAZA and 64Cu-ATSM
The time frame for the ex vivo and in vivo comparison of tracer uptake was decided on the basis of the rate of growth and biologic features of lesions. The rate of growth and biologic features were determined using longitudinal studies in the same animals (n = 3 per cell line), with 18F-FDG and 18F-FAZA imaging started at a tumor volume of approximately 100 mm3. PET scans were obtained weekly for 3 wk using a small-animal tomograph, the YAP-(S)-PET II (I.S.E. S.r.l.) scanner. 18F-FDG is routinely prepared in our facility for clinical use (European Pharmacopoeia VII Edition), whereas 18F-FAZA was obtained using the radiosynthesis procedure previously described by Reischl et al., with slight modifications (26). The radiochemical purity of both the injected radiotracers was greater than 99%. 18F-FDG PET images were acquired as previously described (27); for the 18F-FAZA PET scans, animals were injected with 3.13 ± 0.42 MBq and 2 h after radiotracer injection were positioned on the PET tomograph and submitted to a 30-min dynamic PET acquisition (6 scans of 5 min each) centered on the tumor. The animals remained anesthetized with 2% isoflurane throughout the acquisition period. As based on 18F-FAZA uptake and the presence of nonglycolytic/necrotic areas, a lesion volume of approximately 200 mm3 was selected as optimal for ex vivo and in vivo tracer comparison.
Ex Vivo Dual-Tracer Autoradiography.
Thanks to the different half-lives of the 2 radioisotopes (18F, 109.8 min; 64Cu, 762 min), dual-tracer autoradiography with phosphor imaging could be used to compare radioactivity distribution in the same animals. The 64Cu-ATSM was prepared as previously described (28), with minor modifications. The mice (n = 1 per cell line) were injected intravenously with 2.66 ± 0.05 MBq of 18F-FAZA and 0.4 ± 0.01 MBq of 64Cu-ATSM 3 and 2 h, respectively, before being sacrificed by CO2 asphyxiation. Tumors were rapidly removed and frozen. Slices, each 60 μm thick (Cryostat Leica), were exposed for 3 h in a dark room and then acquired with a Cyclone Storage Phosphor System (Canberra Packard) to determine total 18F and 64Cu distribution. After complete 18F decay (24 h), slices were reexposed overnight for 64Cu acquisition. Images were analyzed using Optiquant software (Packard Instrument Co.) as follows: 64Cu images were corrected for decay and subtracted pixel by pixel from the 18F-plus-64Cu images to obtain the true 18F distribution. Before the acquisition of the slices, the imaging system was calibrated according to 18F and 64Cu standards, and optical units were converted into radioactivity values expressed as megabecquerels. To compare 18F-FAZA and 64Cu-ATSM distribution, regional uptake values from 18F and 64Cu images were normalized to the maximum uptake of the tumor to obtain the net percentage maximum uptake in each defined region, as described by Dence et al. (21).
In Vivo PET Studies.
For in vivo comparison of the hypoxia-imaging compounds, PET studies were performed according to the following schedule: day 1, 18F-FAZA; day 2, early 64Cu-ATSM; and day 3, late 64Cu-ATSM. The mice (n = 4 per line) were injected intravenously with 4.66 ± 0.88 or 3.87 ± 1.03 MBq of 18F-FAZA or 64Cu-ATSM, respectively. 18F-FAZA images were acquired for 15 min at 2 h after tracer injection (3 scans of 5 min each) whereas 64Cu-ATSM images were acquired for 30 min (6 scans of 5 min each) at 2 and 24 h after tracer injection. Quantification analyses were performed using PMOD 2.7 software (PMOD Technologies) as follows: circular regions of interest (20 mm3) were drawn on tumors to identify maximum radioactivity concentration values. Background levels were measured by drawing 3 circular regions of interest (9 mm3) on a muscle of the leg contralateral to the one affected by the tumor. Radioactivity concentrations in tumors were expressed as tumor-to-background radioactivity concentration ratios. The volume of radioactivity distribution, expressed in centimeters cubed, was defined by a threshold signal midway between the mean background and maximum tumor values. After the last PET scan, the animals were sacrificed by CO2 asphyxiation, and lesions were removed for histologic analysis.
Immunohistochemistry Analysis
Harvested tumors were either fixed in buffered 4% formalin and embedded in paraffin for immunohistochemical analysis or embedded in optimum-cutting-temperature compound and frozen in liquid nitrogen for hematoxylin and eosin staining.
Paraffin sections (3 μm) were immunostained with rabbit antihuman ATP7B antibody (GeneTex, Inc.), rabbit antihuman carbonic anhydrase IX antibody (GeneTex, Inc.), and rabbit antihuman CTR1 antibody (GeneTex, Inc.) after antigen retrieval.
The immunoreactions were revealed using rabbit-on-rodent horseradish peroxidase–polymer (Biocare Medical) and using 3,3 diaminobenzidine as chromogen (Biogenex). Slides were counterstained with hematoxylin.
Photomicrographs were taken using the AxioCam HRc (Zeiss) with the AxioVision System 6.4 (Zeiss).
Statistical Analysis
Results are expressed as mean value ± SD. Experimental differences were tested for statistical significance using a Student t test (unpaired, 2-sided, with P values < 0.05 considered statistically significant). Correlations were evaluated using a Pearson test (2-tailed, 95% confidence interval) with Prism software (GraphPad Software Inc.).
RESULTS
Ex Vivo and In Vivo Comparison of Intratumor Uptake of 18F-FAZA and 64Cu-ATSM
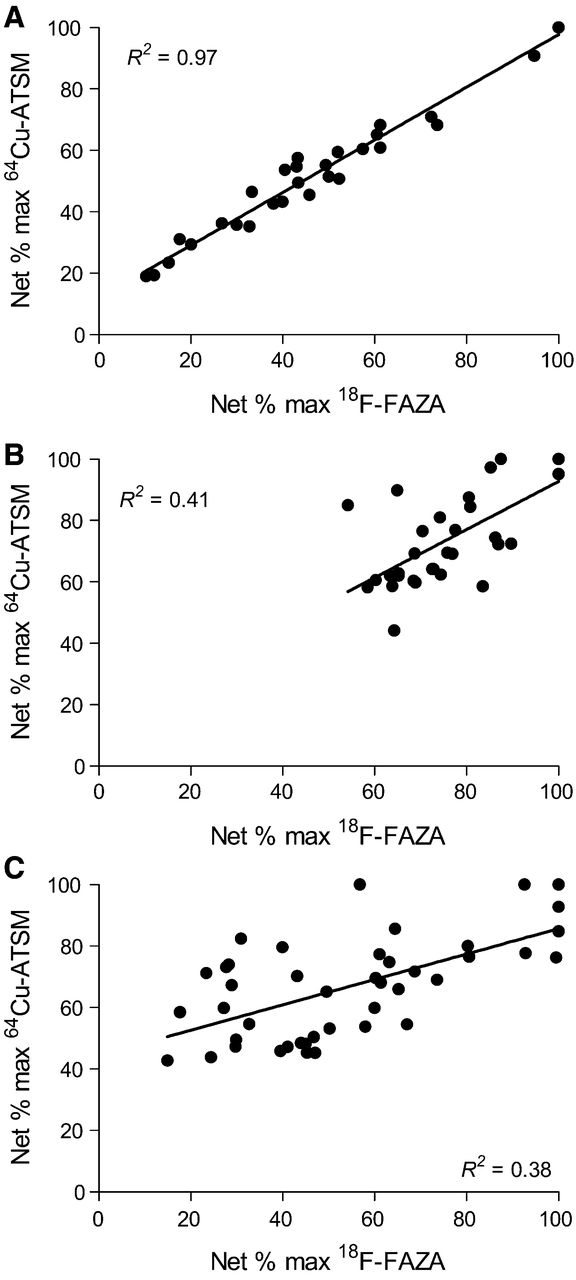
Because most clinical studies are performed using the short half-life 60Cu copper isotope, we preliminarily evaluated the early distribution of 64Cu-ATSM using autoradiography in animals coinjected with both the radioligands considered. The FaDu model showed a similar peripheral distribution of radioactivity and a high correlation (R2 = 0.97) between 64Cu and 18F radioactivity concentrations (Fig. 1A; Supplemental Fig. 1 [available online only at http://jnm.snmjournals.org]). In the inner parts of the tumors, an extensive necrotic area was present (data not shown).

18F-FAZA and 64Cu-ATSM regional uptake in dual autoradiography. Correlation between 18F-FAZA and 64Cu-ATSM (2 h) uptake expressed as net percentage maximum uptake (cpm). Excellent correlation is observed in FaDu tumor (A), whereas poor correlation is seen in EMT-6 (B) and PC-3 tumors (C). max = maximum.
In EMT-6, we observed a partial colocalization of radioactivity and a larger volume of tissue labeled by 64Cu (Fig. 2). In this model, correlation between regional radioactivity concentrations was poor (R2 = 0.41) (Fig. 1B). Finally, in the PC-3 model, the 18F images were found to differ greatly from those obtained with 64Cu, with radioactivity being distributed throughout the lesion on the latter and present mainly at tumor burden on the former (Fig. 2). Regional radiotracer distributions (net percentage maximum uptake) were poorly correlated with each other (R2 = 0.38) (Fig. 1C).
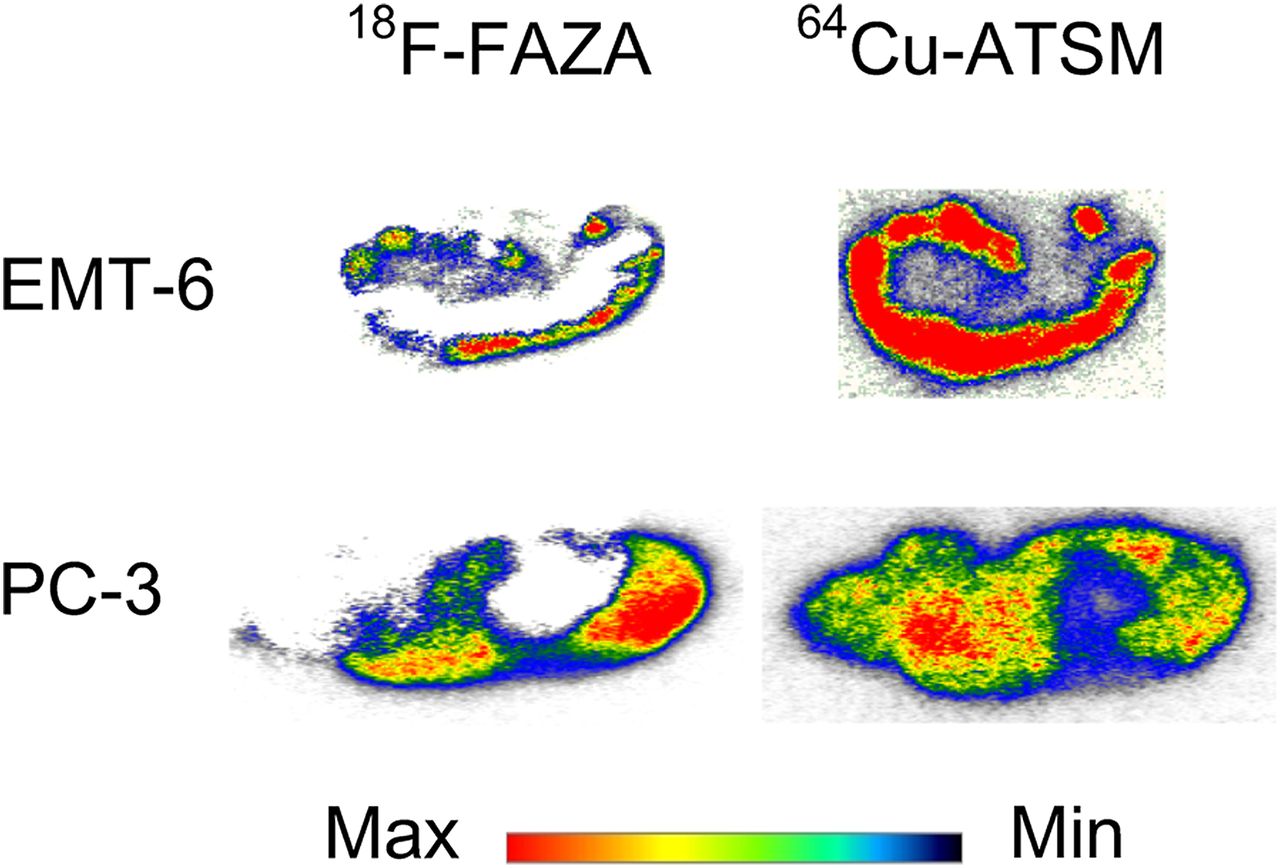
Dual autoradiography studies. Representative images of dual autoradiography obtained after injection of 18F-FAZA and 64Cu-ATSM in the same mouse. In EMT-6 tumor, there is only partial colocalization of 2 radiotracers. In PC-3 tumor slices, 64Cu-ATSM is more diffused within all tumor mass in comparison to 18F-FAZA. max = maximum; min = minimum.
In vivo PET studies showed higher retention of 64Cu-ATSM, expressed as tumor-to-muscle ratios, than of 18F-FAZA in all the models examined and irrespective of the time of 64Cu measurement (Table 1).
Radiopharmaceutical Uptake on PET
As previously observed, in FaDu lesions the regional distribution of 64Cu-ATSM overlapped that of 18F-FAZA also at the later time point (24 h) after 64Cu-ATSM injection (Supplemental Fig. 2).
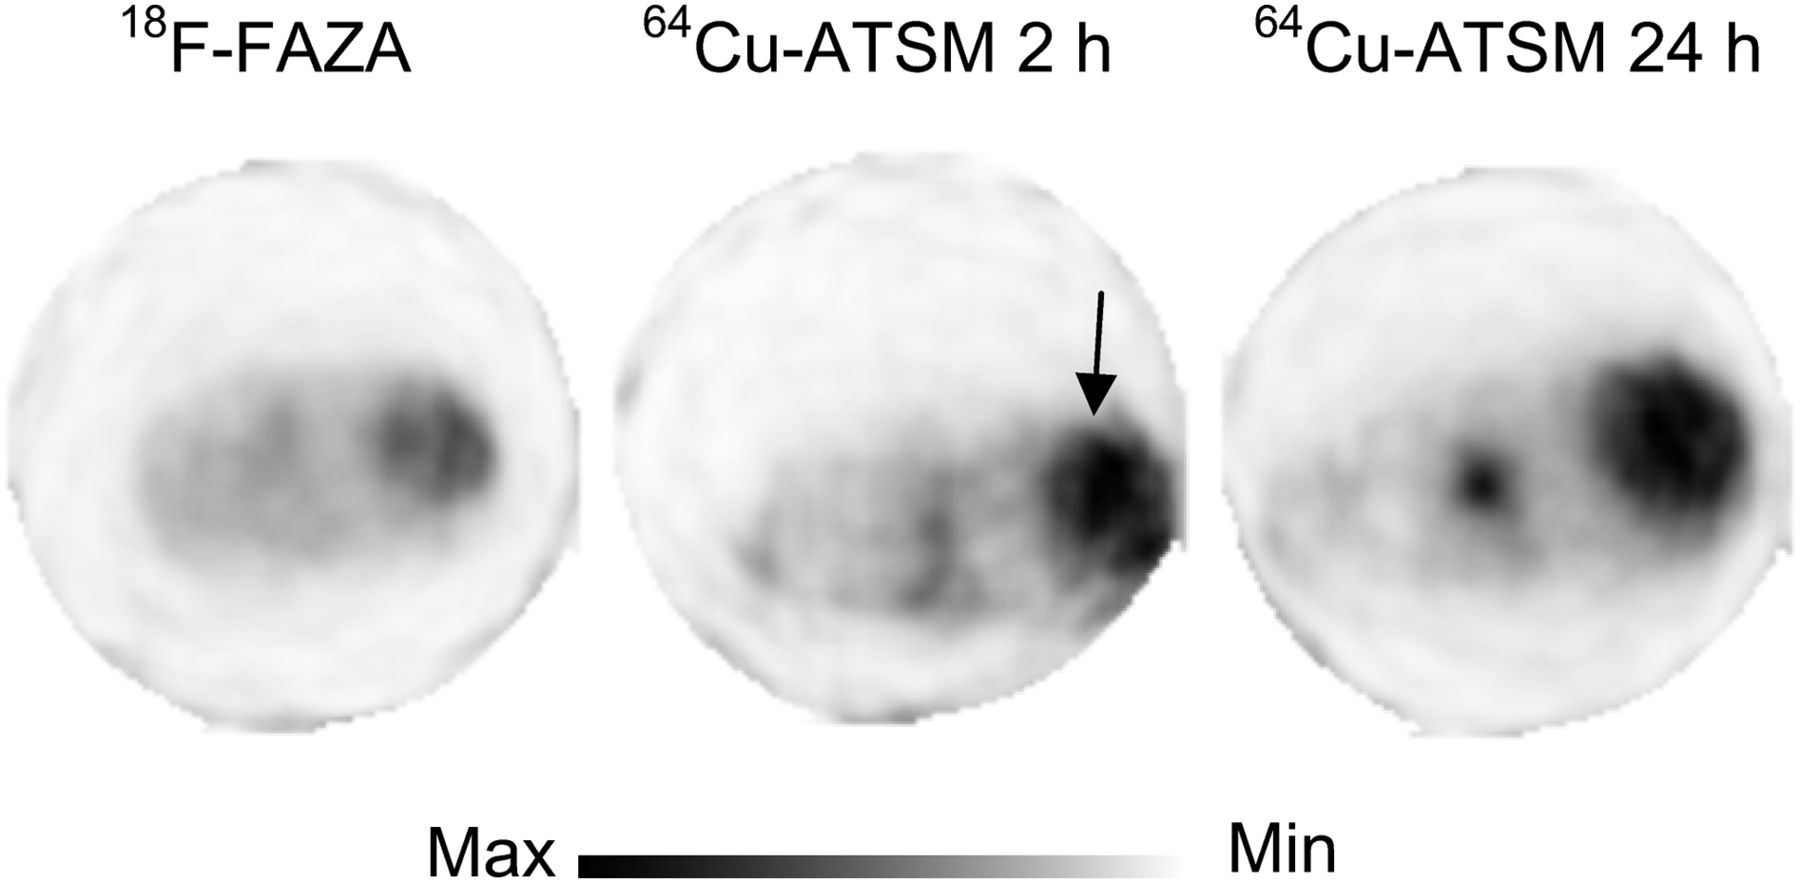
Contrary to what was observed in the FaDu model, 64Cu-ATSM images of EMT-6 tumors showed a time-dependent and heterogeneous pattern of intratumor radioactivity distribution. In particular, in 1 of the animals, the images showed a different pattern of 64Cu-ATSM distribution at the early and late time points, with the late images partially overlapping those obtained with 18F-FAZA (Fig. 3). In the remaining animals (data not shown), 18F-FAZA and 64Cu-ATSM distribution differed from each other irrespective of the time of 64Cu acquisition, displaying only limited colocalization. 64Cu-ATSM retention was also highly heterogeneous in the PC-3 prostate cancer model, in some animals showing similar distributions, albeit only when comparing late 64Cu-ATSM images with 18F-FAZA images (Fig. 4), and in other animals showing differences irrespective of the time of 64Cu acquisition (data not shown). In addition, as already observed in autoradiography studies at the early time point, the uptake volume of 64Cu-ATSM was generally larger than that of 18F-FAZA, particularly in the delayed acquisitions (FaDu: 0.08 ± 0.07, 0.17 ± 0.14, and 0.22 ± 0.16 cm3; EMT-6: 0.17 ± 0.13, 0.18 ± 0.02, and 0.32 ± 0.01 cm3; and PC-3: 0.18 ± 0.13, 0.25 ± 0.09, and 0.28 ± 0.17 cm3 for 18F-FAZA, 2-h 64Cu-ATSM, and 24-h 64Cu-ATSM, respectively).
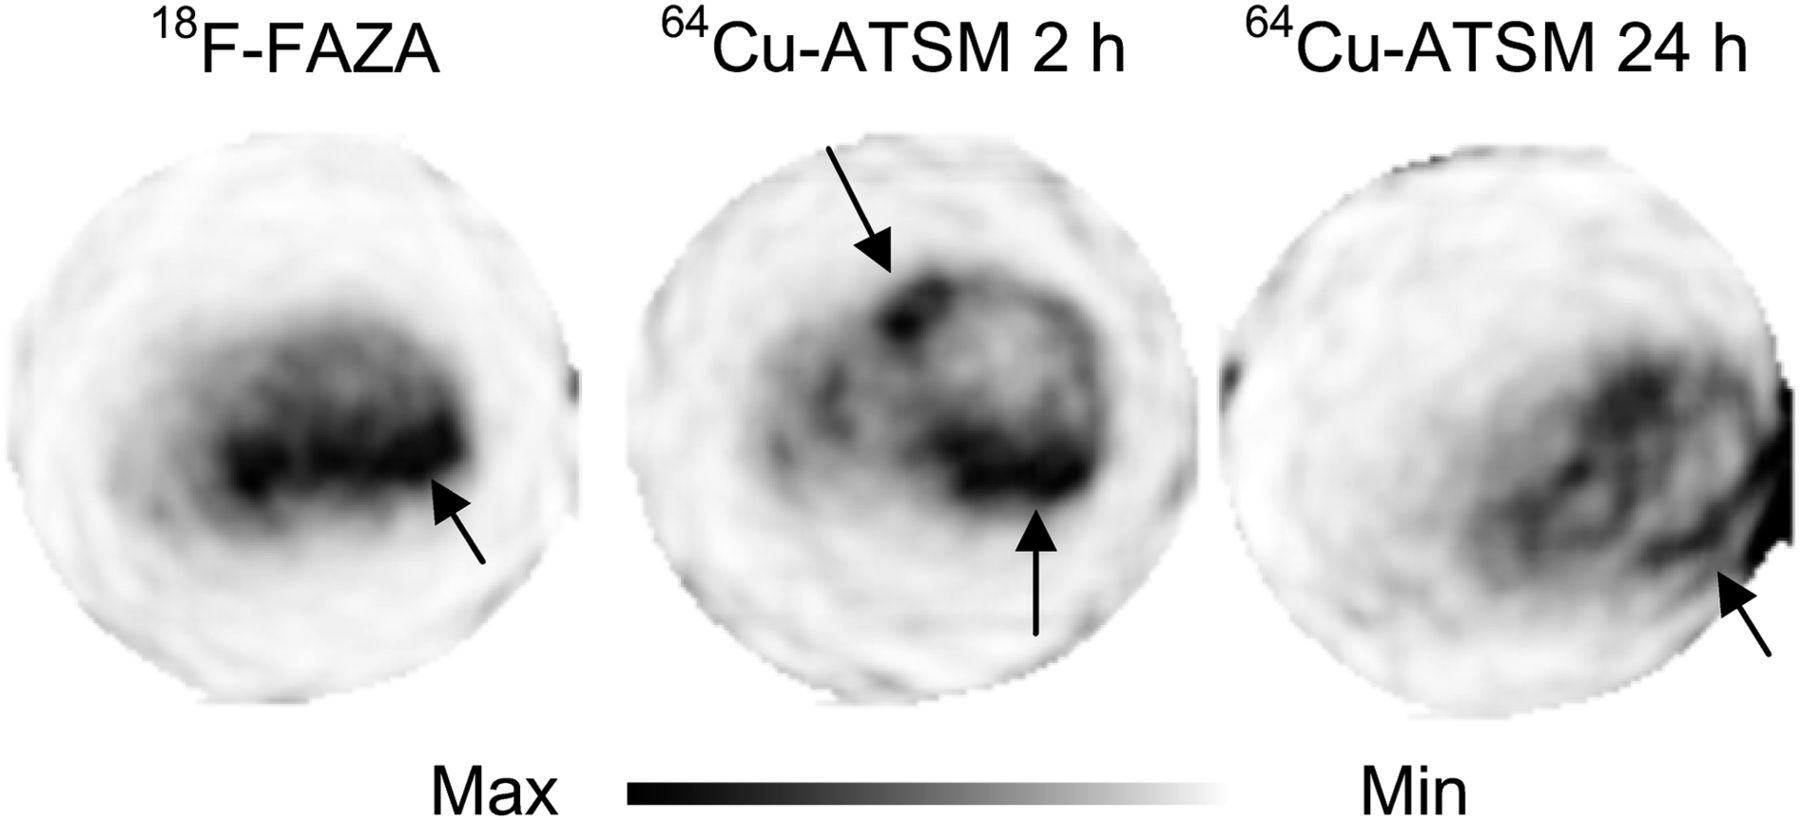
18F-FAZA and 64Cu-ATSM comparison in EMT-6 model. Representative axial PET images from 18F-FAZA, 64Cu-ATSM at 2 h, and 64Cu-ATSM at 24 h after injection in the same mouse. In this mouse, uptake of 64Cu-ATSM after 2 and 24 h is completely different, with uptake at 24 h partially similar to that of 18F-FAZA, as indicated by arrows. max = maximum; min = minimum.

18F-FAZA and 64Cu-ATSM comparison in PC-3 model. Representative axial PET images from 18F-FAZA, 64Cu-ATSM at 2 h, and 64Cu-ATSM at 24 h after injection in the same mouse. In this animal, 64Cu-ATSM at late time is similar to 18F-FAZA, as indicated by arrows. max = maximum; min = minimum.
Histology and Immunohistochemistry
At the end of the last PET scan, the animals were sacrificed and tumors excised for hematoxylin and eosin staining and evaluation of CAIX and copper pump markers (ATP7B and Ctr1).
Microscopic evaluation of hematoxylin and eosin–stained tumor slides showed the presence of central extensive necrotic areas in FaDu and EMT-6 lesions, where PET-negative regions were mainly concentrated (Supplemental Fig. 3). In PC-3 lesions, however, necrotic foci were multiple and scattered in the tumor mass in a geographic pattern.
CAIX expression corresponded to the distribution of the hypoxia ligand 18F-FAZA. In FaDu and EMT-6 lesions, CAIX immunostaining was present in the regions of 18F-FAZA uptake, with an increasing gradient in the perinecrotic areas (Supplemental Fig. 3). In PC-3 tumors, CAIX staining was localized homogeneously in small viable cellular foci alternated with negative necrotic areas. In agreement with these data, in this tumor, due to the limited spatial resolution of the method, we observed homogeneous areas of 18F-FAZA uptake present in the whole lesion. In FaDu and EMT-6 models, the pattern of distribution of the copper pump markers, Ctr1 and ATP7B, was similar. Ctr1 and ATP7B were expressed by viable cells with an increasing gradient toward necrotic areas. In addition, ATP7B was mainly localized on the tumor cell membranes and neoplastic vessels. Contrary to what was observed in the other models, in PC-3 lesions, Ctr1 and ATP7B were homogenously expressed within the tumor mass without a hypoxia-dependent gradient. In addition, the ATP7B staining was weaker, compared with that seen in the other models, and was restricted to the cytoplasm of the cells. In this case, both pumps were present in tumor vessels (Supplemental Fig. 4).
DISCUSSION
In the present study, we compared the distribution of 18F-FAZA and 64Cu-ATSM, evaluated at early (2 h) and delayed (24 h) time points in different tumor mouse models: FaDu, EMT-6, and PC-3. We observed a higher tumor-to-background ratio with 64Cu-ATSM than with 18F-FAZA in all 3 models, thereby underlining the potential advantage, in terms of signal identification, of using 64Cu-ATSM. However, irrespective of the time of measurement, only the FaDu model showed a radioactivity distribution pattern, after injection of 64Cu-ATSM, that overlapped that of 18F-FAZA—that is, that matched the distribution of CAIX measured postmortem by immunohistochemistry. In the other 2 models (PC-3 and EMT-6), the distribution of 64Cu-ATSM was found to be time-dependent and heterogeneous among the animals evaluated. Only in a few of the animals examined were delayed 64Cu-ATSM images found to be similar to those obtained with 18F-FAZA and the distribution pattern to correspond to the regional expression of measured CAIX. CAIX is expressed on the tumor cell surface and is strongly upregulated in hypoxic conditions, contributing to cell survival and invasion (29). As well as a marker of hypoxia, CAIX has been shown in patients to be a negative prognostic indicator for many types of cancer (30).
When we compared the early distribution of 64Cu-ATSM with that of 18F-FAZA in the dual-tracer autoradiography study, we observed a high correlation between the 2 radioligands only in the head and neck cancer model. Conversely, in EMT-6 and PC-3 lesions, 64Cu-ATSM localization overlapped that of 18F-FAZA only in some regions, being completely different in others. Our results are in agreement with the findings reported in the limited number of studies that have focused on this issue (20,21). O’Donoghue et al., comparing the distribution of 18F-FMISO and 64Cu-ATSM in a model of prostate cancer, showed a time-dependent distribution of 64Cu-ATSM that overlapped that of 18F-FMISO only in the delayed acquisition (20). As reported in our study, which used 18F-FAZA instead of 18F-FMISO as a 2-nitroimidazole reference compound, in the FaDu model the 2 tracers gave similar results irrespective of the time of 64Cu-ATSM acquisition. In the FaDu and in the 9L glioma models, 64Cu-ATSM behaves like 2-nitroimidazoles (21). These tumors are characterized by an impaired vascular network and rapid development of extensive necrotic areas with a limited portion of vital hypoxic cells contributing to the tumor burden. This extreme condition, typical of highly glycolysis-dependent tumors, may select the most aggressive and hypoxic cells (probably CD133-positive stem cells), thus reducing the heterogeneity of cell phenotype and the involvement of other molecular events that may influence cell trapping (31).
The redistribution of 64Cu-ATSM at the delayed time point, observed in some animals in our study as well as in the study by O’Donoghue, may be explained by the high blood flow dependence of 64Cu-ATSM, whereby the initial delivery of the tracer depends on both tissue perfusion and hypoxia status. This behavior is in agreement with some of the mechanisms of oxygen-dependent trapping proposed for the radiolabeled Cu–ATSM complex. Indeed, according to Maurer et al. and Holland et al., radiolabeled Cu–ATSM is reduced to an unstable anionic copper (I) species in both normoxic and hypoxic tissue (32,33). This anion may dissociate, leading to the irreversible trapping of copper I inside the cells or—depending on its redox potential—reoxidize to the original copper II complex, which is released back into the bloodstream. For this reason, it is not surprising that early radioactivity distribution may reflect both hypoxia status and blood flow; subsequently, the perfusion-dependent fraction of the uptake is progressively cleared from tissue and radioactivity is taken up and retained in regions where redox potential promotes dissociation of the copper complex.
However, in some of the animals examined we did not observe a complete overlapping of 18F-FAZA and 64Cu-ATSM images, even at the delayed time point. In general, we observed that the tissue volume occupied by 64Cu-copper was definitely larger than that of 18F-FAZA or present in regions where 18F-fluorine was totally absent.
Intrusion and extrusion copper transporter pumps could be a potential confounding factor in the mechanism of 64Cu-ATSM retention (12). Copper I is taken up by cells through the Ctr1 transporter and released by 2 different exporter systems: ATP7A and ATP7B. According to this model, on the basis of cell culture 64Cu-ATSM uptake studies, the absolute and relative expression of the copper transporter and exporter may influence radioactivity retention and localization (34,35).
To better explore this issue, also in vivo, we analyzed postmortem the regional expression of the copper transporter Ctr1 and copper exporter ATP7B. We found a similar pattern of distribution of Ctr1 and ATP7B in FaDu and EMT-6. In both models, the copper pumps were similarly distributed in all the animals examined, being localized mainly in proximity of the necrotic areas, with an increasing gradient from viable toward dead cells. Conversely, in the PC-3 model, the expression was homogeneous and spread throughout the lesion. In addition, whereas in the FaDu and EMT-6 mice ATP7B pumps were mainly localized on cell membranes, in PC-3 mice they were present only in the cytosolic fraction. Finally, in all 3 models, ATP7B antibodies also labeled neoplastic vessels. The differences in copper retention that we observed between FaDu and EMT-6 cells cannot be explained on the basis of copper pump expression, which was found to be similar in these 2 cell models. However, the intracellular localization of Ctr1, found in PC-3, although unable to promote the redistribution of circulating copper, may promote its sequestration in intracellular compartments and facilitate the dissociation of the 64Cu-ATSM complex. Finally, whereas the study of copper transport distribution does not explain the differences in tracer uptake, it does highlight a need for greater understanding of the role of copper in cell proliferation and of the involvement of transporters in the resistance and in the toxicity of platinum derivatives (36,37).
Tracer delivery and redistribution cannot per se explain the differences found between 18F-FAZA and 64Cu-ATSM at the delayed time point. Tissue hypoxia imaging is, in general, based on redox-dependent modifications of the chemical structure of the radioligand, which are responsible for the sequestration in poorly oxygenated tissue. In severe hypoxic conditions, 2-nitroimidazoles are reduced at the nitro group and then transformed into highly reactive species that irreversibly bind to unknown intracellular sites. Trapping of 64Cu-ATSM is much more complicated and depends on the stability of the reduced copper complex (33).
According to the results of other experiments on models of ischemia and mitochondrial disorders (38,39), 64/62Cu-ATSM uptake may also be influenced by modifications in intra- and extracellular pH or by the activity of nicotinamide adenine dinucleotide hydrogen (NADH)–dependent enzymes. Hypoxic cells produce and exchange lactate in the extracellular matrix, leading to a decrease in extracellular pH (40); in this way, 64Cu-ATSM could be retained in peritumoral areas, too, resulting in a higher metabolic volume, compared with that of 18F-FAZA. Recently, Yoshii et al. observed that 64Cu-ATSM accumulates in cells with overreduced states caused by mitochondrial dysfunction, regardless of oxygenic levels but in correlation with NADH and nicotinamide adenine dinucleotide phosphate hydrogen (NADPH) levels (39).
As seen, various molecular or electrochemical events, still to be fully clarified, underlie complex stability and copper trapping. The activity of the mitochondrial electron transport chain, the levels of NADH and NADPH, and modifications in intra- or extracellular pH have been proposed to contribute to the 60/62/64Cu-ATSM signal. These factors are, in general, related to defects in nutrient supply and hypoxia. However, in cancer, due to the abnormal metabolism (Warburg effect, mitochondrial complex I impairments, glutamine metabolism, different regulation of NADH/NADPH levels, modification of pH), copper retention may also occur in normoxic or moderately hypoxic regions. This, indeed, may justify the heterogeneous behavior of 64Cu-ATSM observed in our study, favor its use in redox disorders, and explain its sensitivity as a prognostic agent in some forms of cancer (15,16).
CONCLUSION
The results of this study confirm the favorable kinetics and biologic profile of 18F-FAZA for the in vivo imaging of hypoxia-related events. The variability of 64Cu-ATSM distribution, on the other hand, means that it cannot be considered a reliable ligand for hypoxia imaging. However, the well-established predictive values in some types of cancer and the recent findings on mitochondrial disorders underline the need for a better understanding of the complicated, although intriguing, mechanism of 64Cu-ATSM cell trapping.
DISCLOSURE
The costs of publication of this article were defrayed in part by the payment of page charges. Therefore, and solely to indicate this fact, this article is hereby marked “advertisement” in accordance with 18 USC section 1734. This work was supported by EMIL (European Molecular Imaging Laboratory), Sixth European Program, project no. LSHC-CT-2004-503569; AIRC (Associazione Italiana Ricerca sul Cancro) grant 2006-2008; Regional AIRC project no. 6278; Italian University Ministry (FIRB RBIP06M8ZA_001); and PIO (Programma Integrato Oncologia) project no. RFPS-2006-2-342023.8. No other potential conflict of interest relevant to this article was reported.
Acknowledgments
We thank Pasquale Simonelli for technical assistance with imaging experiments; Dr. Valeria Carina for data analysis; Dr. Maria Grazia Minotti, Dr. Mario Matarrese, and Francesco Sudati for radiochemical production and quality controls; Martina Rocchi and Arianna Vino of the Mouse HistoPathological Unit for histological and immunohistochemical preparation; and Dr. Catherine Wrenn for English revision.
Footnotes
Published online May 22, 2013.
- © 2013 by the Society of Nuclear Medicine and Molecular Imaging, Inc.
REFERENCES
- Received for publication July 27, 2012.
- Accepted for publication November 26, 2012.


