


Abstract
High-sensitivity dedicated cardiac camera systems provide an opportunity to lower the injected doses for SPECT myocardial perfusion imaging (MPI), but the exact limits for lowering doses have not been determined. List-mode data acquisition allows for reconstruction of various fractions of acquired counts, enabling a simulation of gradually lower administered dose. We aimed to determine the feasibility of very low dose MPI by exploring the minimal count level in the myocardium required for accurate MPI. Methods: Seventy-nine patients were studied (mean body mass index, 30.0 ± 6.6; range, 20.2–54.0 kg/m2) who underwent 1-d standard-dose 99mTc-sestamibi exercise or adenosine rest–stress MPI for clinical indications using a cadmium-zinc-telluride dedicated cardiac camera. The imaging time was 14 min, with averaged 803 ± 200 MBq (21.7 ± 5.4 mCi) of 99mTc injected at stress. To simulate clinical scans with a lower dose at that imaging time we reframed the list-mode raw data. Accordingly, 6 stress-equivalent datasets were reconstructed containing various count fractions of the original scan. Automated quantitative perfusion and gated SPECT software was used to quantify total perfusion deficit (TPD) and ejection fraction for all 553 datasets (7 × 79). The minimal acceptable left ventricular region counts were determined on the basis of a previous report with repeatability of same-day, same-injection Anger camera studies. Pearson correlation coefficients and the SD of differences in TPD for all scans were calculated. Results: The correlations of quantitative perfusion and function analysis were excellent for both global and regional analysis between original scans and all simulated low-count scans (all r ≥ 0.95, P < 0.0001). The minimal acceptable counts were determined to be 1.0 million for the left ventricular region. At this count level, the SD of differences was 1.7% for TPD and 4.2% for ejection fraction. This count level would correspond to a 92.5-MBq (2.5-mCi) injected dose for the 14-min acquisition or 125.8-MBq (3.4-mCi) injected dose for the 10-min acquisition. Conclusion: 1.0 million counts appear to be sufficient to produce myocardial images that agree well with 8.0-million-count images on quantitative perfusion and function parameters. With a dedicated cardiac camera, these images can be obtained over 10 min with an effective radiation dose of less than 1 mSv without significant sacrifice of accuracy.
Reducing patient radiation exposure has become an important challenge for nuclear cardiology. The last few years brought several rapid developments that have increased photon sensitivity in nuclear cardiology scanner hardware. Additionally, software applying new methods of SPECT reconstruction on conventional and dedicated systems has preserved or even improved SPECT image quality with lower count statistics (1–9). As a result, the acquisition time for SPECT myocardial perfusion imaging (MPI) may be significantly shortened. Several new dedicated camera systems with optimized acquisition geometry and collimator design resulting in increased count sensitivity have been introduced by vendors (10–16). Although it is convenient for patients to have imaging completed in 2–4 min, the efficiency of these systems provides the opportunity to reduce both the duration of the acquisition and the radiation dose to the patient. The degree to which the radiation dose can be reduced while the acquisition times are simultaneously reduced has not been explored.
List-mode data acquisition available in these new systems allows for reconstruction of various fractions of acquired counts such that lower levels of administered dose can be simulated. We aimed to determine, for a dedicated cardiac system with cadmium-zinc-telluride (CZT) detectors, the minimal count level in the left ventricular (LV) region that could provide reproducibility similar to a standard Anger camera. We focused on stress MPI data to simulate the minimal LV counts in a stress scan, with application to very low dose stress-only protocols (17).
MATERIALS AND METHODS
Study Patients
We evaluated 79 consecutive patients who underwent MPI using a CZT camera (D-SPECT; Spectrum Dynamics). Patients were referred for evaluation by rest–stress MPI for clinical indications. Before scanning, we collected information on the presence of categoric cardiac risk factors in each individual. Hypertension was defined on the basis of a documented history of hypertension or treatment with antihypertensive medications. Diabetes mellitus was defined on the basis of a clinical history of diabetes or use of insulin or oral hypoglycemic agents. Dyslipidemia was also defined on the basis of clinical history or use of lipid-lowering medications. A history positive for smoking was defined as current smoking or smoking cessation less than 3 mo before MPI testing. A family history of coronary artery disease was defined as myocardial infarction or cardiac death before age 55 y in a man and before age 65 y in a woman as reported by the patient. The occurrence of a prior myocardial infarction was based on either an initial report by the patient or chart documentation. This study was conducted according to guidelines of the Institutional Review Board of the Oregon Heart and Vascular Institute. All patients provided written informed consent for the use of their clinical and imaging data for research purposes.
Patient Preparation and Image Acquisition
The patients were instructed to abstain from any products containing caffeine for 24 h before the test. β-blockers and calcium-channel antagonists were discontinued for 48 h, and nitrates for 6 h, before testing. Rest–stress 1-d 99mTc-sestamibi imaging was performed on all patients using weight-adjusted doses of 111–296 MBq (3–8 mCi) for rest and 481–1,221 MBq (13–33 mCi) for stress (12), in the upright position. Rest images were not used in this study because we focused on simulations that could be applicable to stress-only protocols (17–19). Patients underwent symptom-limited standard exercise treadmill testing (51%) or adenosine stress (49%, 140 μg/kg/min for 6 min) with injection at peak stress (20,21). Stress imaging began at 15–30 min after injection and continued for 14 min. With regard to the administered dose of 99mTc-sestamibi, in our experience we have found that an average of 74 MBq (2 mCi) remains in the syringe and the injection tubing.
A full description of the dedicated cardiac system used in this study has been previously reported (13,22,23). Briefly, the system uses 9 tungsten collimated CZT detector columns rotating in synchrony, each consisting of 1,024 (16 × 64), 5-mm-thick CZT elements (2.46 × 2.46 mm). The size of the collimator holes matches the dimensions of the detector elements. Before imaging, the detector was positioned parallel to the patient’s chest, with the heart in the center of the field of view. A 6- to 12-s prescan acquisition was performed to locate the heart and to set the angle limits of scanning for each detector column (region-of-interest–centric scanning). Each image set was acquired with 120 projections per detector.
The vendor reconstruction includes 2 steps. A first reconstruction step uses a uniform gray starting image with 3 iterations. In this step, the LV region is determined for the LV count calculation. This approximate LV region reconstruction is subsequently used as a “prior” for further reconstruction of full image data with an additional 4 iterations. This final transaxial image is generated from list-mode data by the vendor reconstruction algorithm based on the maximum-likelihood expectation maximization method (23) with resolution recovery using a total of 4–7 iterations and 32 subsets and additional interiterative kernel convolution smoothing (12). These parameters are the default reconstruction parameters validated in a previous study (12) in which image quality and quantitative parameters were compared with conventional MPI. No attenuation or scatter correction was applied. Images were then automatically reoriented into short-axis and vertical and horizontal long-axis slices using standard quantitative perfusion SPECT (QPS) software (Cedars-Sinai Medical Center).
LV Count Determination
The LV counts were determined from the planar projections of the approximate LV region defined during the first step of data reconstruction. We could not use the reconstructed image data and accurate 3-dimensional LV segmentation, since the vendor adjusts the reconstructed counts to account for the efficiency of the detectors and collimators. During this first reconstruction step, a circular region of interest was adjusted by the observer around the LV on the transaxial, coronal, and sagittal projections. Subsequently, the volumetric region of interest was back-projected on all the detectors, creating planar regions of interest, which were used for the LV count calculation. In this way, most of the extracardiac and background activity was eliminated.
Simulation of Lower Injected Dose
To simulate a clinical scan with lower counts acquired over the full acquisition time, the patient’s list-mode raw data were reframed such that only a fraction of each view was used, and subsequently these truncated views were reconstructed in the same manner as for the full-count scans. For example, a 14-min, 120-view scan acquired with 7 s per view was reframed to a subset of the data with 3.5 s per view to simulate half-dose images (Fig. 1). Using this methodology, 6 low-count stress scans were reconstructed from each full-count reconstruction scan to simulate various levels of myocardial counts (3.6, 2.0, 1.3, 1.0, 0.7, and 0.5 million counts [MC]). The acquisition and reconstruction parameters were the same for all data used in the current study.
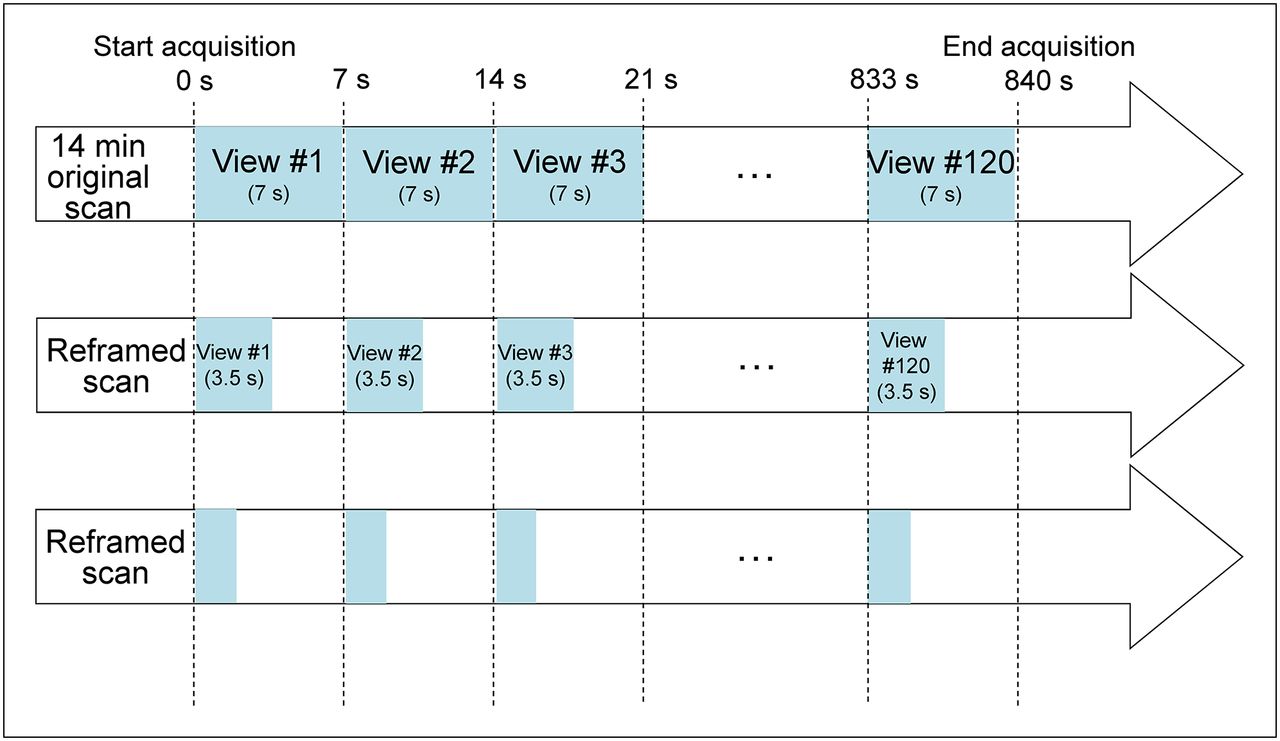
Reframing methodology: a time reframing for each view. Each CZT-SPECT clinical scan is done with 120 views generally between 1 and 7 s per view. By selecting part of each view, we can simulate reduction in scanning time retrospectively.
Image Analysis
Automated QPS and quantitative gated SPECT (QGS; Cedars-Sinai Medical Center) software was used to quantify myocardial perfusion and function for all 553 datasets (7 × 79) (24). The quantitative perfusion variable used was total perfusion deficit (TPD), which reflects a combination of both defect severity and the extent of the defect in a single parameter, as previously described (25,26). On a per-patient basis, abnormal stress TPD was defined as being at least 5% and was categorized as mild (5%–10%) or moderate/severe (>10%) (27). Regional TPD was also calculated for each vascular territory, with abnormal being defined as at least 2% (26). We analyzed these cases separately to assess the minimal counts required in patients with abnormal TPD.
From this population, we generated count-specific reference normal limits using 34 patients (14 men and 20 women) who had normal findings on rest and stress images by visual assessment (26). Stress perfusion defects were assessed by quantification of TPD using these count-specific normal limits as well as standard limits previously obtained for this system (26). LV ejection fraction was quantified using a modified version of QGS (28) accounting for higher resolution and better visibility of the myocardial base (29).
Statistical Analysis
Continuous variables are presented as means ± SDs and categoric variables as frequencies. Pearson correlation coefficient, Bland–Altman limits of agreement, and SD of differences were calculated using a high-count study of 8.0 MC as the reference standard. A 2-tailed P value of less than 0.05 was considered statistically significant. The minimal acceptable count was based on a previous report with repeatability of same-day, same-injection Anger camera studies (30). All statistical calculations were performed using STATA (version 11; StataCorp LP) for Windows (Microsoft).
RESULTS
The patient characteristics of the study population are given in Table 1. Mean body mass index (BMI) was 30.0 ± 6.6 kg/m2, and the range was 20.2–54.0 kg/m2. Thirty-two of 79 patients had abnormal stress TPD (≥5%), including 12 patients with mild stress perfusion defects (TPD of 5%–10%) and 20 patients with moderate/severe stress perfusion defects (TPD > 10%). In 32 patients with abnormal stress TPD, 8 had fixed perfusion defects, and 24 had reversible perfusion defects in the 8.0-MC scan. On a per-vessel analysis, stress perfusion abnormality (TPD ≥ 2% per vascular territory) was seen in 22, 22, and 19 patients in the left anterior descending, left circumflex, and right coronary artery territories, respectively. A mean dose of 802.9 ± 199.8 MBq (21.7 ± 5.4 mCi) of 99mTc-sestamibi for stress was drawn up in the syringe; assuming 74 MBq (2 mCi) remained in the syringe and the injection tubing, 728.9 MBq (19.7 mCi) were administered to the patients. The average LV counts for the stress scan were 7,962,719 ± 2,349,989, 3,598,744 ± 14,929, 2,000,125 ± 7,092, 1,300,958 ± 8,121, 1,000,180 ± 5,177, 700,363 ± 5,332, and 500,760 ± 3,964 for the 8.0-, 3.6-, 2.0-, 1.3-, 1.0-, 0.7-, and 0.5-MC scans, respectively.
Patient Characteristics (n = 79)
An experienced imaging technologist without knowledge of the quantitative results determined that 14 of 553 myocardial contours generated from QPS needed adjustment for static perfusion images, with no relationship to the number of myocardial counts in the study (Table 2).
Number of Cases Requiring Contour Adjustment
The reproducibility of simulated global perfusion and function results is shown in Table 3. The correlations of quantitative perfusion analysis were excellent for global analysis in all simulated low-count scans (all r ≥ 0.99, P < 0.0001). At the level of 1.0 MC, the SD of the differences for TPD was 1.7%, and the SD of the differences for ejection fraction was 4.2%. Bland–Altman analyses for global perfusion quantification are shown in Figure 2. Compared with the 8.0-MC scan, the reduced-count studies showed a small negative bias, which increased as counts were reduced; however, the Bland–Altman plots demonstrated that bias remained low through the range of simulated low-count scans. In patients with abnormal stress perfusion defects (separately evaluated), the correlation was also excellent (r = 0.99, P < 0.0001) and the SD of differences was 1.7% at the level of 1.0 MC. In patients without abnormal stress perfusion defects, the SD of differences was 1.2% at the level of 1.0 MC. The results were similar between patients with and without abnormal stress perfusion defects. In patients with a BMI greater than 30 kg/m2 (n = 34), the correlation was also excellent (r = 0.99, P < 0.0001) and the SD of differences was 1.4% at the level of 1.0 MC.
Global Reproducibility of Perfusion and Function Parameters
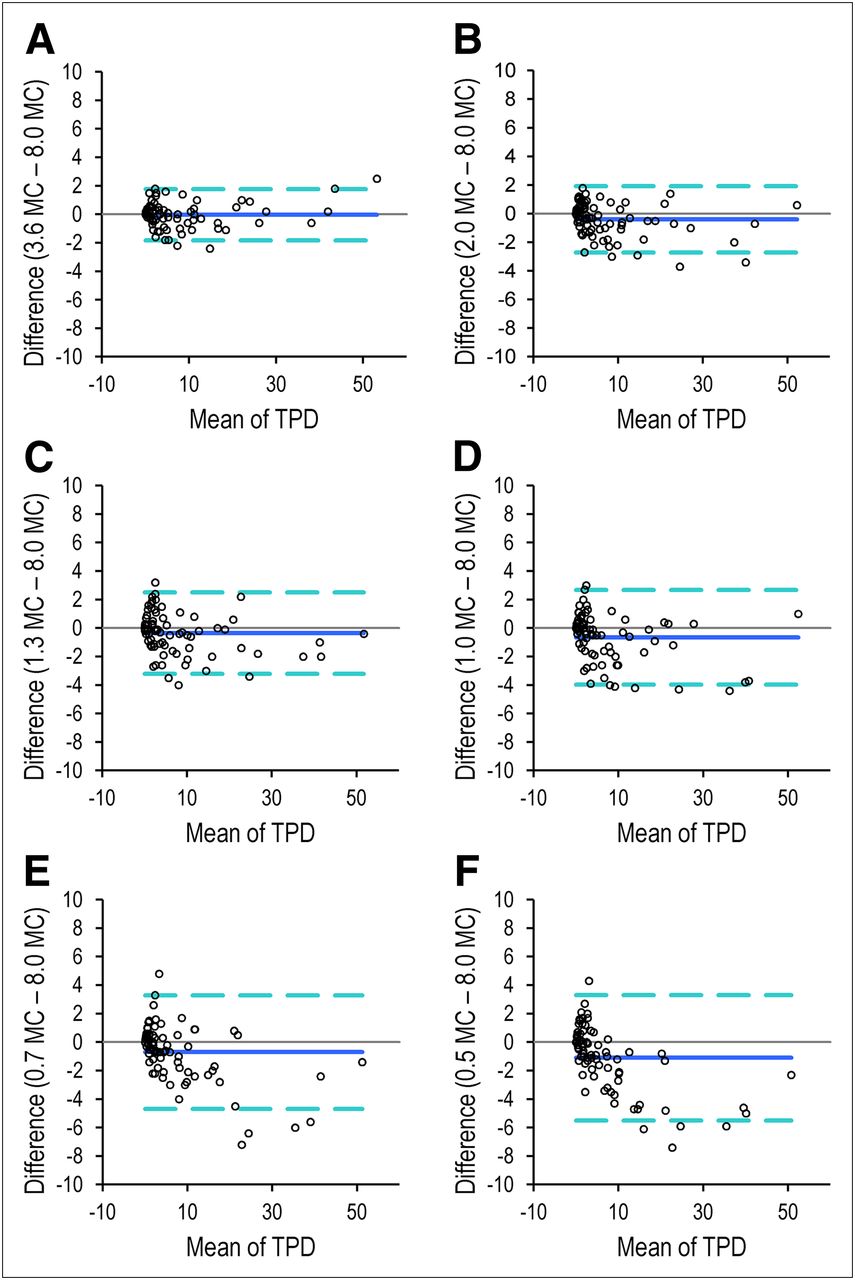
Bland–Altman plots for TPD at different count levels—3.6 (A), 2.0 (B), 1.3 (C), 1.0 (D), 0.7 (E), and 0.5 (F) MC—vs. TPD for high-count scan (8.0 MC). Count-specific normal limits were used for TPD.
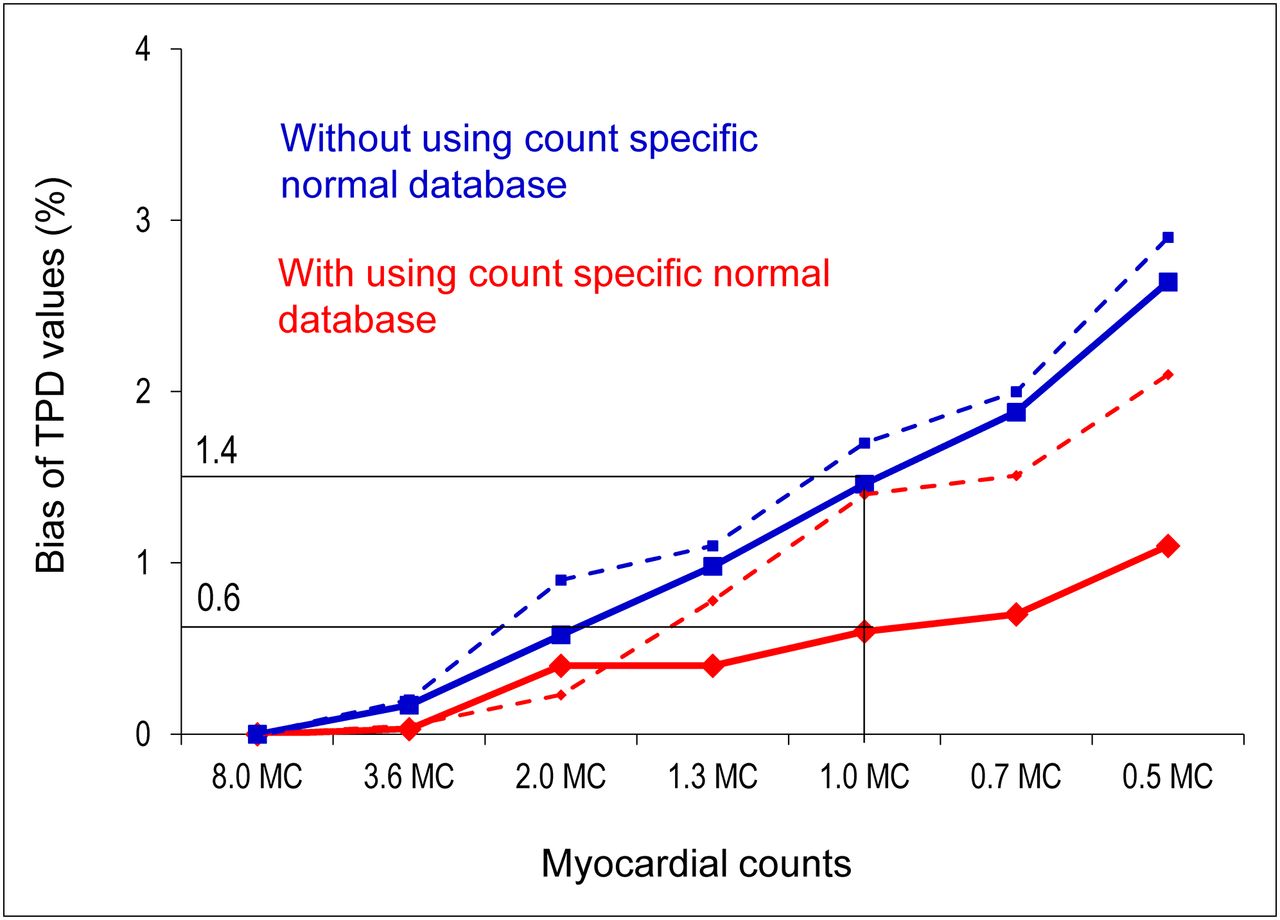
Figure 3 shows the bias of TPD values using the count-specific normal limits compared with using the same normal limits for different levels of counts. The use of the count-specific normal limits was associated with a significant reduction of TPD bias from 1.4% to 0.6% in the overall population. Similarly, in patients with a BMI greater than 30 kg/m2, TPD bias was 22% lower on average using the count-specific normal limits.

TPD bias as a function of decreasing count levels with (red) and without (blue) count-specific normal limits. Solid lines correspond to TPD bias for overall population (n = 79). Dashed lines correspond to TPD bias for patients with abnormal stress perfusion (n = 32).
The reproducibility of simulated perfusion results for regional perfusion analysis is shown in Table 4. Correlation values were similar to those observed for global perfusion analysis on the simulated low-count scans (all r ≥ 0.95, P < 0.0001).
Regional Reproducibility of Perfusion Parameters
In a previous report with repeatability of same-day, same-injection full-count Anger camera studies, the SD of the differences was 1.7% for TPD and 3.6% for ejection fraction (30). In the present study, on a 1.0-MC scan the SD of the differences was 1.7% for TPD and 4.2% for ejection fraction. There was no significant difference in the SD of the differences for ejection fraction between these 2 reports (P = 0.4). Therefore, the minimal acceptable count level was determined to be 1.0 MC for stress CZT MPI. For the 14-min acquisition, the 1.0-MC scan allows the injected dose to be reduced by a factor of 8, which corresponds to an average injected dose of 92.5 ± 25.9 MBq (2.5 ± 0.7 mCi) (range, 51.8–144.3 MBq [1.4–3.9 mCi]) and would have resulted in an effective average radiation dose of 0.71 ± 0.20 mSv (range, 0.40 to 1.11 mSv) in a 14-min study and an average radiation dose of 0.99 ± 0.28 mSv (range, 0.56–1.55 mSv) in a 10-min study. In patients with a BMI greater than 30 kg/m2 at the level of 1.0 MC (average counts, 1,001,319), the average injected dose would be 111.0 ± 25.9 MBq (3.0 ± 0.7 mCi) (range, 66.6–144.3 MBq [1.8–3.9 mCi]) with an average radiation dose of 0.85 ± 0.20 mSv (range, 0.51–1.11 mSv) in a 14-min study.
Case examples of images at gradually reduced doses are shown in Figures 4 and 5.

Case example of normal-perfusion images. Original and all reframed scans had TPD of 0%. SA = short axis; VLA = vertical long axis; HLA = horizontal long axis.

Case example of abnormal-perfusion images.TPD values were 11%, 12%, 12%, 12%, 12%, 12%, and 9% for 8.0, 3.6, 2.0, 1.3, 1.0, 0.7, and 0.5 MC, respectively. HLA = horizontal long axis; SA = short axis; VLA = vertical long axis.
DISCUSSION
Reducing the effective radiation dose to patients and reducing the exposure of staff to radiation are important goals in the field of nuclear cardiology (31). Our study demonstrated that dedicated cardiac scanners may allow acquisitions with average LV region counts of as low as 1.0 MC for stress MPI regardless of the presence of stress perfusion defects while maintaining excellent agreement in quantitative perfusion and function parameters with those determined from very high count images. Our calculations used the average doses administered, and the estimate specific to a given patient may vary depending on the injected dose (based on the patient’s BMI). Therefore, the minimal dose could be higher in patients with a higher BMI and lower in patients with a lower BMI. For patients with a BMI greater than 30 kg/m2, the average estimated radiation dose of 0.85 ± 0.20 mSv (range, 0.51–1.11 mSv) at the 1-MC level was higher than in the overall study population (0.71 ± 0.20 mSv [range, 0.40–1.11 mSv]).
The findings show that the amount of injected radioactivity can be reduced by a factor of 8 with a 14-min acquisition, resulting in a 1.0-MC scan with a 92.5-MBq (2.5-mCi) injected dose, which would be associated with an average 0.71-mSv effective radiation dose to the patient (32). Because it is desirable to reduce both radiation dose and scanning time, these findings further imply that by increasing the injected dose to 125.8 MBq (3.4 mCi), a submillisievert stress-only MPI study can be achieved with an acquisition time of 10 min. However, a larger, prospective multicenter trial is warranted for further investigation.
We established precise minimum count levels by retrospective analysis of full-dose, full-time data and reconstruction of only a fraction of the counts spread over the full acquisition time. Such an approach is facilitated by the list-mode capabilities of the new scanners. Especially for the new stationary scanners, it is possible to retrospectively simulate a scan with an arbitrary activity or, alternatively, duration from the original full-dose, full-time acquisition data. Using a similar approach, Herzog et al. have shown by retrospective list-mode reconstruction that a 2-min acquisition is optimal for the ultrafast cardiac scanner (GE Healthcare) (14). In our study, the data were acquired over the full imaging time, and therefore the simulation should closely correspond to low-dose, full-time acquisition protocols.
The reference standard of 8.0 MC is a very high photon count—much higher than currently obtained by Anger cameras. The reason why significant count reductions do not translate into poorer reproducibility is the high sensitivity of the collimators used and detector geometry focused on the cardiac region, rather than the use of solid-state detectors. These characteristics allow 6–8 times the counting rate of the conventional system to be obtained. Acquisitions obtained with these new systems at standard doses and standard counting rates have a very high photon count; therefore, significant reductions can be obtained while still maintaining adequate image statistics. Similar simulation studies can be performed for other dedicated cardiac systems without solid detectors (4) or for new reconstruction methods (7,9) if list-mode acquisition is available. Our findings show little benefit to imaging with such high count levels, compared with low-count studies.
In the present study, we used fully automated quantitative analysis of MPI studies. Quantitative analysis eliminates observer variability and bias and is useful for comparing sequential MPI studies (33,34). Quantitative analysis also provides an approach that is more generalizable to other centers, as it is not dependent on the expertise of the interpreter. The reported variability is the overall variability due to the count level differences but also to the intrinsic variability of the quantitative software (sampling methods, valve plane determination). However, this overall variability is the practical clinical measure by which low-dose imaging can be judged. We have demonstrated here that this overall variability for studies with gradually decreasing count levels (≤8 times) is similar to the quantitative variability of repeated studies with the same count level obtained on a Anger camera.
The use of the same normal limits for all count levels (26) was associated with increasing bias in TPD values. Count-specific normal limits allowed a significant reduction of this bias. Therefore, our findings indicate that count-specific normal limits are needed to provide comparable findings for studies with different count levels, since the normal thresholds for perfusion studies can be affected by the bias.
The method used for count estimation may overestimate myocardial counts because of the approximate shape of the LV region. Although the use of 3-dimensional QGS and QPS boundaries can improve the results by excluding background activity more precisely, in the current implementation of the vendor reconstruction the tomographic counts cannot be used because they are scaled to correct for known detector and collimator efficiencies. However, the advantage of our method for LV count estimation is that it is easily available to the scanner operator, without the need for additional software processing during image acquisition. Even if 3-dimensional LV counts have been estimated from the precise LV segmentation, the myocardial count levels would still be affected by the extent of hypoperfusion. We have, however, shown good reproducibility in abnormal studies with low count levels as well.
Our study has several limitations. The acquisitions were performed at only a single center with a single type of system; however, our application of automated quantitative analysis in this study increases the likelihood that our results can be replicated elsewhere. More important, because of the specialized high-dose, full-time protocol, which was used in only a limited number of patients, we could not use a separate population for development of count-specific normal limits. However, we obtained the results separately in a population with abnormal stress perfusion defects, and these results agree with the findings in the overall population. We included patients with a BMI ranging from 20.2 to 54.0 kg/m2. However, the mean BMI was 30.0 kg/m2 in our population. Caution must be taken when extrapolating the average estimated dose to patients with a substantially higher BMI. Therefore, we also provided ranges of the estimated doses and separately evaluated the doses for the patients with a high BMI. We did not use attenuation correction, because this camera is not equipped with that option.
CONCLUSION
This simulation study based on reframing of patient image data suggests that a dedicated cardiac scanner may allow counts of as low as 1.0 MC for stress MPI while maintaining excellent agreement in quantitative perfusion and function parameters with those determined from high-count, full-time images. Our findings suggest that a 10-min stress scan can be performed with an effective average radiation dose of less than 1 mSv with the dedicated cardiac scanners.
DISCLOSURE
The costs of publication of this article were defrayed in part by the payment of page charges. Therefore, and solely to indicate this fact, this article is hereby marked “advertisement” in accordance with 18 USC section 1734. This research was supported in part by grant R01-HL089765 from the National Heart, Lung, and Blood Institute/National Institutes of Health (NHLBI/NIH). The content of the article is solely the responsibility of the authors and does not necessarily represent the official views of the NHLBI. Dr. Daniel Berman is a shareholder in Spectrum-Dynamics. Rafael Baavour and Nathaniel Roth are Spectrum-Dynamics company employees. No other potential conflict of interest relevant to this article was reported.
Acknowledgments
We thank Arpine Oganyan for editing and proofreading the manuscript.
Footnotes
Published online Jan. 15, 2013.
- © 2013 by the Society of Nuclear Medicine and Molecular Imaging, Inc.
REFERENCES
- Received for publication June 28, 2012.
- Accepted for publication September 25, 2012.


Jump to section
Related Articles
Cited By...
- Quantitative Clinical Nuclear Cardiology, Part 1: Established Applications
- Solid-State Detector SPECT Myocardial Perfusion Imaging
- Prognostic Value of Combined Clinical and Myocardial Perfusion Imaging Data Using Machine Learning
- Prognostic Value of Myocardial Perfusion Imaging with a Cadmium-Zinc-Telluride SPECT Camera in Patients Suspected of Having Coronary Artery Disease
- High-Sensitivity and High-Resolution SPECT/CT Systems Provide Substantial Dose Reduction Without Compromising Quantitative Precision for Assessment of Myocardial Perfusion and Function
- 124I PET/CT to Predict the Outcome of Blind 131I Treatment in Patients with Biochemical Recurrence of Differentiated Thyroid Cancer: Results of a Multicenter Diagnostic Cohort Study (THYROPET)
- Approaches to Reducing Radiation Dose from Radionuclide Myocardial Perfusion Imaging
- Radiation Dose and Prognosis of Ultra-Low-Dose Stress-First Myocardial Perfusion SPECT in Patients with Chest Pain Using a High-Efficiency Camera
- Minimizing Patient-Specific Tracer Dose in Myocardial Perfusion Imaging Using CZT SPECT
- Comparison of Image Quality, Myocardial Perfusion, and Left Ventricular Function Between Standard Imaging and Single-Injection Ultra-Low-Dose Imaging Using a High-Efficiency SPECT Camera: The MILLISIEVERT Study
- Achieving Very-Low-Dose Radiation Exposure in Cardiac Computed Tomography, Single-Photon Emission Computed Tomography, and Positron Emission Tomography
- Serial Myocardial Perfusion Imaging: Defining a Significant Change and Targeting Management Decisions