


Abstract
We have investigated the opioid receptor (OR) agonist (20R)-4,5-α-epoxy-6-(2-18F-fluoroethoxy)-3-hydroxy-α,17-dimethyl-α-(2-phenyleth-1-yl)-6,14-ethenomorphinan-7-methanol (18F-FE-PEO) as a candidate OR PET ligand. This tracer is attractive because it combines 18F labeling, is suited to the slow kinetics of high-affinity ligands, and has agonist binding, which has been shown to be more sensitive to changes in OR occupation than is antagonist binding. Methods: Agonist potency and off-target binding were investigated in vitro, and autoradiographic studies on rat brain sections were used to assess binding patterns. Quantification of the tracer in vivo was investigated using small-animal PET in rats with blood sampling. Results: 18F-FE-PEO was obtained by direct nucleophilic radiofluorination and subsequent deprotection with a yield of 28% ± 15%, a specific activity of 52–224 MBq/nmol, and a radiochemical purity of more than 97% (90 min from end of bombardment). In vitro studies showed it to be a full agonist ligand, which selectively binds to OR with high affinity, although it is not selective to a single OR subtype (inhibition constant, 0.4–1.6 nM across OR subtypes). Autoradiography binding patterns were consistent with the known distribution of OR, although nondisplaceable signal typically constituted one third of the signal in OR-dense regions. Although metabolites were present in blood (∼40% of plasma radioactivity was nonparent 3 h after injection), no significant metabolite fraction was found in brain tissue, aiding PET quantification. A plasma input 2-tissue-compartment model provided good fits to the PET data, and regional distribution volumes from the latter correlated well with those from Logan plot analysis (r2 = 0.98). The cerebellum had the lowest distribution volume, but the time–activity curve data could not be adequately fitted with a 1-tissue-compartment model. Reference tissue models using the cerebellum as the reference region did not provide good fits to the data, so blood-based kinetic analysis is recommended. Conclusion: As the first 18F-labeled OR agonist ligand, 18F-FE-PEO is a useful addition to the existing OR ligand portfolio.
Opioid receptor (OR) subtypes μ (MOR), δ (DOR), and κ (KOR) belong to the group of G protein–coupled receptors. ORs are prominent targets for imaging studies because opioid signaling pathways are involved with a variety of physiologic functions, including addiction, appetite, cognition, feeding behavior, motivation, pain processing, and social behavior (1).
OR binding sites are widely distributed throughout the human brain, with the highest total density being in the amygdala (2). Relative expression of the 3 OR subtypes is similar in caudate, putamen, and frontal cortex. In contrast, a few regions show a distinct dominance of a single subtype: thalamus (67% MOR), substantia nigra (66% KOR), and amygdala (60% KOR). OR subtypes are also spatially co-located together in the rat brain (3–5); however, relative OR expression levels show varying degrees of agreement between rats and humans. For instance, in the rat, as in humans, MOR dominates in the thalamus and similar levels of the 3 subtypes are found in the striatum, but unlike in humans, in the rat the substantia nigra is dominated by MOR and the amygdala has comparable levels of all OR subtypes.
To date, most validated radioligands available for OR receptor quantification with PET have been antagonists. Their use, however, has limited utility because of the complex nature of opioid neurotransmission. Agonist binding has been shown to be significantly more sensitive to changes in OR occupation than antagonists (6); hence, the availability of an OR agonist PET ligand is highly desirable. The 11C-labeled agonist radiotracers 11C-carfentanil, 11C-salvinorin A, and 11C-PEO for OR imaging have been reported and used in humans, nonhuman primates, and rodents, respectively (7–9). However, the short half-life of 11C (20.3 min) restricts these compounds to PET centers with a cyclotron and limits quantification in receptor-rich domains with high-affinity radioligands such as 11C-carfentanil and 11C-PEO (1,10).
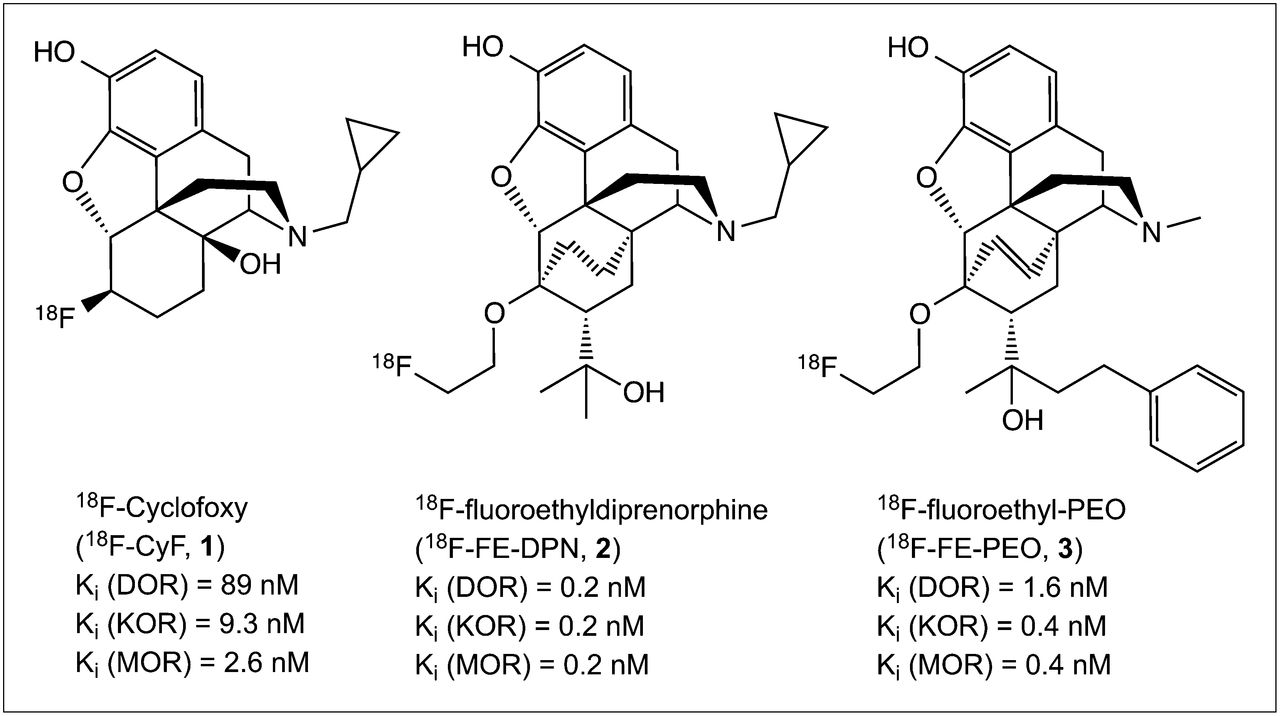
Consequently, we have investigated (20R)-4,5-α-epoxy-6-(2-18F-fluoroethoxy)-3-hydroxy-α,17-dimethyl-α-(2-phenyleth-1-yl)-6,14-ethenomorphinan-7-methanol (18F-FE-PEO) as a candidate 18F-labeled OR radiotracer (Fig. 1), with the aim of providing an agonist alternative to the antagonists 18F-cyclofoxy and 18F-fluorethyldiprenorphine (1,11–14).

18F-labeled PET ligands for OR imaging.
The structural attributes of FE-PEO facilitate the use of structurally matched agonist/antagonist/inverse agonist pairs to study OR occupation and availability in pain management and drug abuse. These investigations have so far been hampered by the lack of available tracers.
MATERIALS AND METHODS
Radiosynthesis
The precursor (TE-TDPEO) was obtained from ABX Advanced Biochemical Compounds and was synthesized as described in Supplemental Figure 1 (supplemental materials are available online only at http://jnm.snmjournals.org). The reference substance (FE-PEO), synthesized from thebaine as described previously (9), was also obtained from ABX. Further details on the precursor and reference substance are given in the supplemental data.
18F-FE-PEO was synthesized from TE-TDPEO via aliphatic nucleophilic substitution with [K⊂222][18F]F− using a TRACERlab FX F-N synthesis module (GE Healthcare) followed by acid hydrolysis of a trityl ether protective group (Supplemental Fig. 16). TE-TDPEO (7.0 ± 0.4 mg) in 0.9 mL of anhydrous MeCN was added to dried [K⊂222][18F]F− at 40°C. The reaction mixture was heated to 90°C and stirred for 10 min. The reactor was cooled to 40°C before the addition of 1 mL of 1 M HCl in EtOH. After stirring of the mixture at 40°C for 5 min, it was neutralized by adding 1 mL of 1 M NH4OH.
The obtained mixture was passed through a SepPak plus alumina N cartridge (Waters Ltd.) and injected into the preparative high-performance liquid chromatography (HPLC) system of the FX F-N module. The stationary phase consisted of 2 VWR Chromolith RP-18e columns (10 × 100 mm; Merck KGaA), and the mobile phase was a mixture of MeCN and 0.05 M ammonium formate buffer at pH 6.8 (36:64) at a flow rate of 10 mL/min. The product fraction was collected after a total retention time of 9 min in a vessel containing 50 mL of sterile water. The ultraviolet detection wavelength was 254 nm.
The diluted product fraction was passed through an Oasis HLB cartridge (Waters Ltd.) preconditioned with 5 mL of ethanol and 10 mL of water. The trapped product was washed with 10 mL of water before the elution of the trapped 18F-FE-PEO in 0.6 mL of ethanol. The ethanolic solution was collected in a vial precharged with 6 mL of 0.9% NaCl solution. The final formulation of 18F-FE-PEO for animal experiments was obtained via sterile filtration of the mixture of ethanol and NaCl solution into a sterile multiinjection vial.
For quality control, 15 μL of the 18F-FE-PEO formulation was injected into an analytic HPLC system (Agilent Technologies U.K. Ltd.). The single radioactive peak eluted after 12–15 min. The specific activity of the product was determined via comparison of the ultraviolet peak area with a calibration curve obtained from 6 different concentrations of FE-PEO in 9% ethanol in water (Supplemental Fig. 17). The identity of 18F-FE-PEO was established by the simultaneous injection of FE-PEO, and radiochemical and chemical purity were determined by integration of the ultraviolet and radioactivity traces, respectively.
Binding Affinity
The potential of FE-PEO to competitively inhibit radioligand binding to a plethora of central nervous system receptors, transporters, and ion channels, stably or transiently transfected in cell culture, was determined as detailed elsewhere (15). When a significant inhibition of radioligand uptake was detected at a 10-μM concentration of FE-PEO, the potency of inhibition (inhibitory concentration of 50%) was determined. Inhibition constants (Ki) were computed using the Cheng–Prussof equation (16). DOR, KOR, and MOR receptor activation of FE-PEO was measured according to published procedures.
Stability Studies
18F-FE-PEO was mixed with 2.5 mL of heparinized rat blood to obtain a radioactivity concentration of 0.3 MBq/mL of blood, which was distributed into 15 conical tubes (150 μL/tube). The tubes were incubated at 37°C for up to 2 h. After 1, 15, 30, 60, and 120 min, 3 tubes were spun at 5,000 rpm for 5 min before removal of the supernatant plasma (50 μL). Aliquots of the plasma were transferred into 0.3-mL tubes containing acetonitrile (250 μL), and the samples were spun at 5,000 rpm for 5 min. The supernatant was directly spotted on silica gel 60–coated aluminum plates (Merck KGaA) for analysis.
Autoradiography
In vitro autoradiography was conducted following standard procedures detailed previously (17,18). Coronal rat brain sections were exposed to 18F-FE-PEO at a concentration of 0.4 nM (∼Ki). To assess selectivity for OR receptors, 24 sections from 2 animals were preincubated with either the nonselective OR antagonist naloxone (10 μM; 12 sections) or the MOR-selective agonist [d-Ala2,N-MePhe4,Gly-ol]-enkephalin (DAMGO) (1 μM; 12 sections). Detection was performed using BAS-IP MS storage phosphor screens (GE Healthcare) and a Duerr CR 35 NDT image plate scanner (Raytest Isotopenmessgeraete GmbH). To quantify the impact of preincubation with naloxone or DAMGO on radioligand binding, regions of interest were drawn on the images using Raytest QWBA software.
PET
All animal experiments were conducted in accordance with the U.K. Animal (Scientific Procedures) Act of 1986. Studies were performed on 3 Lister hooded rats (Charles River). Anesthesia was induced with 2% isoflurane administered in 1 L/min of oxygen and maintained throughout the experiment with less than 1% isoflurane. The left femoral vein was cannulated for intravenous administration of 18F-FE-PEO and drugs, and the left femoral artery was cannulated to allow for collection of blood samples. During all surgical procedures, body temperature was maintained at 37°C using a heating blanket connected to a rectal thermistor probe. After PET imaging, the animals were sacrificed by intravenous injection of 1 mL (200 mg/mL) of pentobarbital sodium, and the brains were harvested for metabolite analysis.
PET data were acquired using a microPET Focus 220 scanner (Concorde Microsystems). The rats were placed prone on the scanner bed, and the head was fixed in a custom-made plastic frame using ear bars and a bite bar. Anesthesia and body temperature were maintained as described above. In addition, oxygen saturation, heart rate, and respiratory rate were measured and maintained within physiologic limits throughout using a noninvasive mouseOX (Starr Life Science Corp.) pulse oximeter sensor attached to the foot.
Before injection, singles-mode transmission data were acquired for 8.5 min using a rotating 68Ge point source (∼25 MBq). An attenuation correction sinogram was produced from this scan, and a blank scan of the same duration with scatter correction was applied. In all experiments, 18F-FE-PEO (8–20 MBq) was injected intravenously over 30 s, followed by a 15-s heparinized saline flush. The injected activity was varied in order to keep the injected mass of FE-PEO constant at 0.1 nmol. List-mode data were histogrammed into sinograms for the following time frames: 12 × 5 s, 6 × 10 s, 3 × 20 s, 4 × 30 s, 5 × 1 min, 10 × 2 min, and 30 × 5 min (3 h in total). Corrections were applied for random events, dead time, normalization, attenuation, scatter, and decay. Fourier rebinning (19) was used to compress the 4-dimensional sinograms to 3 dimensions before reconstruction with 2-dimensional filtered backprojection with a Hann window cutoff at the Nyquist frequency. The image voxel size was 0.95 × 0.95 × 0.80 mm, with an array size of 128 × 128 × 95. The reconstructed images were converted to kBq/mL using global and slice factors determined from imaging a uniform phantom filled with an 18F-fluoride solution. This phantom acquisition was also used to cross-calibrate the scanner and the well counter used to measure blood radioactivity concentration.
To determine arterial blood and plasma 18F-FE-PEO kinetics, serial blood samples were taken via the arterial cannula. Blood samples (∼30 μL each apart from those used for metabolite analysis) were taken every 6 s for the first 2 min, every 20 s for the next minute, and then at approximately 5, 7, 10, 20, 30, 60, 90, 120, 150, and 180 min. Whole blood and plasma were counted for each sample in a Genie2000 well counter (Harwell Instruments).
Metabolite Analysis
Blood samples collected after 5, 10, 60, 120, and 180 min were used for metabolite studies. Samples of blood (100 μL) were centrifuged at 5,000 rpm for 5 min, and then 50 μL of the supernatant plasma were transferred into 200 mL of methanol, thoroughly agitated, and centrifuged at 5,000 rpm for 5 min. An aliquot (50 μL) of the supernatant was counted, and 20 μL of the supernatant were directly injected into the analytic HPLC system. The HPLC eluate was separated into 2 fractions containing the radioactive metabolites and the intact 18F-FE-PEO, respectively. Both fractions were weighed, and an aliquot of each fraction was counted using a 431-040 well counter (Hidex Oy).
Brain tissue was homogenized by grinding under methanol (3 mL/g of tissue) in a glass tissue homogenizer for 5 min. The supernatant layer was transferred into a centrifuge tube and centrifuged at 5,000 rpm for 5 min. The supernatant was analyzed in the same manner as described for the blood analysis.
PET Data Analysis
For each scan, a mean PET image (1–3 h after injection) was manually coregistered to a T2-weighted MR atlas of 21 healthy Lister hooded rats (20), and the dynamic PET images were resliced to the MR atlas using these coregistration parameters. To facilitate the production of regional time–activity curves, the following regions of interest were manually defined on the MR atlas using Analyze 7.0 software (AnalyzeDirect): frontal cortex, striatum, hippocampus, thalamus, amygdala, and cerebellum. The cerebellum was used to produce the reference tissue time–activity curve. For each rat, a Hill function (21) was fitted to the blood metabolite data and applied to the plasma input function to produce a metabolite-corrected plasma input function.
Region-of-interest distribution volume (VT) and nondisplaceable binding potential (BPND) (22) were estimated using a metabolite-corrected plasma input function together with reversible 1-tissue-compartment model (1TCM) and 2-tissue-compartment model (2TCM) and the Logan plot (23). Compartmental modeling included blood volume correction using the whole-blood time–activity curve. The results of blood-based modeling were compared with those obtained from the following reference tissue methods: reference tissue model (24), simplified reference tissue model (25), and reference tissue input Logan plot (26), with k2 of the reference region, as required in the latter method, determined from the 2TCM. Blood and reference tissue compartmental modeling methods (i.e., 1TCM, 2TCM, reference tissue model, and simplified reference tissue model) utilized weighted nonlinear least-squares fitting, with the weights calculated as described by Gunn et al. (27). Plasma and reference tissue Logan plots used data acquired 70–180 min after injection. In addition, maps of VT were produced using the plasma input Logan plot. The correlation between parameters was assessed using Pearson correlation testing.
RESULTS
Radiosynthesis
After some optimization (Supplemental Fig. 18), 18F-FE-PEO was obtained with a reliable yield of 28% ± 15%, a specific activity of 52–224 MBq/nmol, and a radiochemical purity of greater than 97%. To avoid overloading the HPLC column, only 7 mg of labeling precursor were used as a compromise between radiochemical yield and purification of the reaction mixture. The production of the radiotracer took 90 min in total.
Binding Affinity of FE-PEO
FE-PEO did not present significant potency to inhibit binding of radioligands other than for ORs (Table 1). Despite structural modification, FE-PEO retained full agonist characteristics at DOR, KOR, and MOR receptors; agonist potencies were greater than 100%, compared with dynorphine for DOR; 100%, compared with salvinorin A for KOR; and 100%, compared with DAMGO for MOR, essentially in the same range as reported for its congener PEO (9).
Central Nervous System Binding Profile of FE-PEO
Stability Studies
18F-FE-PEO was found to be highly stable in rat blood (>95% intact parent compound after 2 h of incubation). This result indicates that metabolite determination in rat plasma was not confounded by deterioration of the radiotracer in the blood samples.
Autoradiography
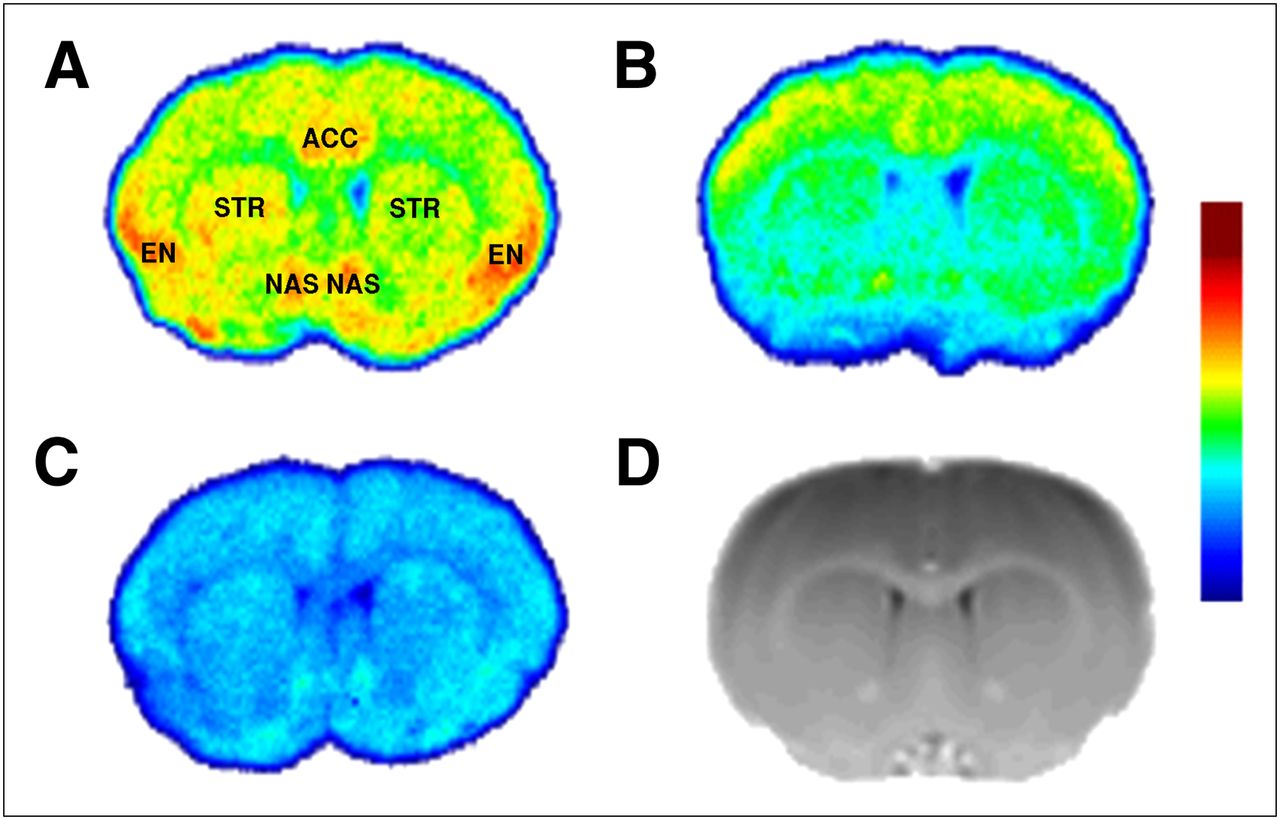
Figure 2 depicts the distribution of 18F-FE-PEO in coronal sections of the Lister hooded rat brain at a concentration of 0.4 nM. Figure 2A represents the native binding pattern of the radiotracer, with high binding in the endopiriform nucleus, the shell of the nucleus accumbens, and the anterior cingulate cortex. Less pronounced binding was found in the striatum. After pretreatment with a 1-μM solution of the MOR-selective OR agonist DAMGO, binding was reduced by 61%, 59%, and 42% in the endopiriform nucleus, anterior cingulate cortex, and striatum, respectively. Preincubation with a 10-μM solution of the nonselective OR antagonist naloxone resulted in a global reduction of binding, with binding in the endopiriform nucleus, anterior cingulate cortex, and striatum reduced by 63%, 65%, and 66%, respectively.

Autoradiographic distribution of 18F-FE-PEO in coronal sections of rat brain: without preblockade (A), before incubation with MOR-selective DAMGO (B), and before incubation with nonselective OR antagonist naloxone (C). All autoradiography images have the same absolute intensity range. (D) Coronal section through MR template provides anatomic localization for autoradiography images. ACC = anterior cingulate cortex; EN = endopiriform nucleus; NAS = shell of nucleus accumbens; STR = striatum.
18F-FE-PEO Metabolites
Supplemental Figure 19 shows the time course of the parent fraction in blood (n = 3 rats) and the plasma input function together with the metabolite-corrected plasma input function for 1 rat. Despite the presence of metabolites in the blood, no significant metabolite fraction was found in brain tissue (95% ± 7% parent compound).
PET
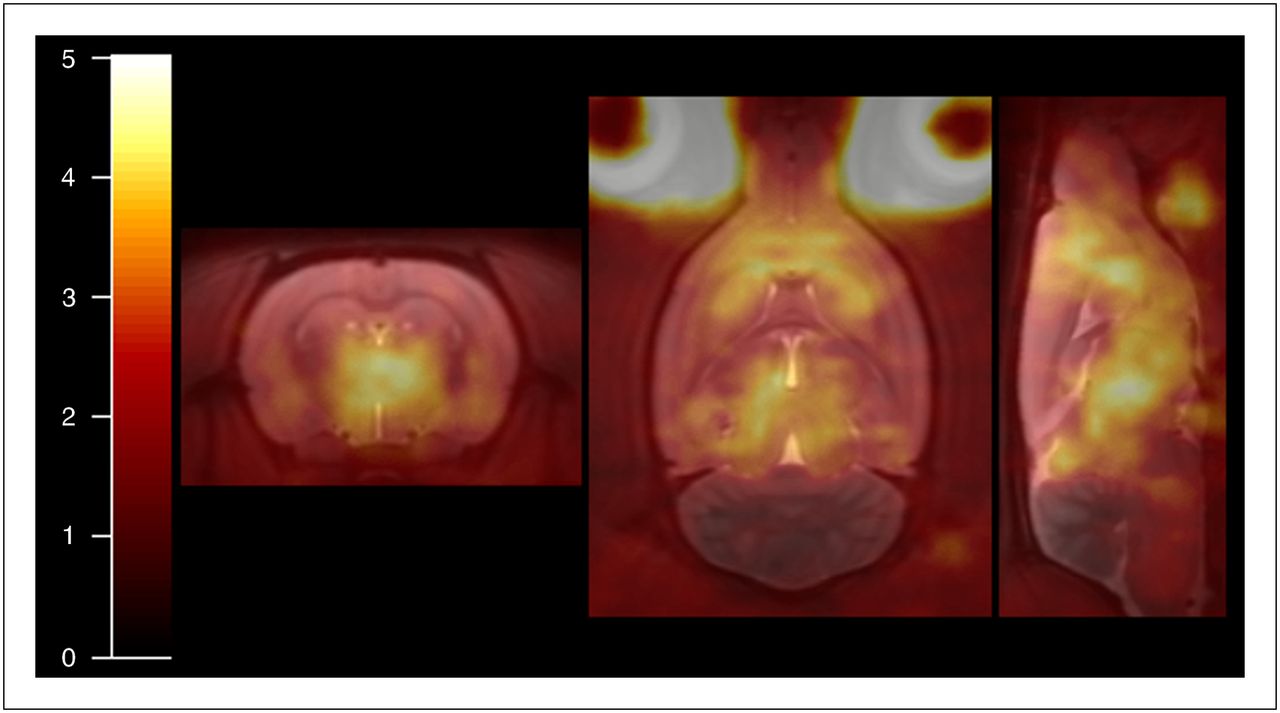
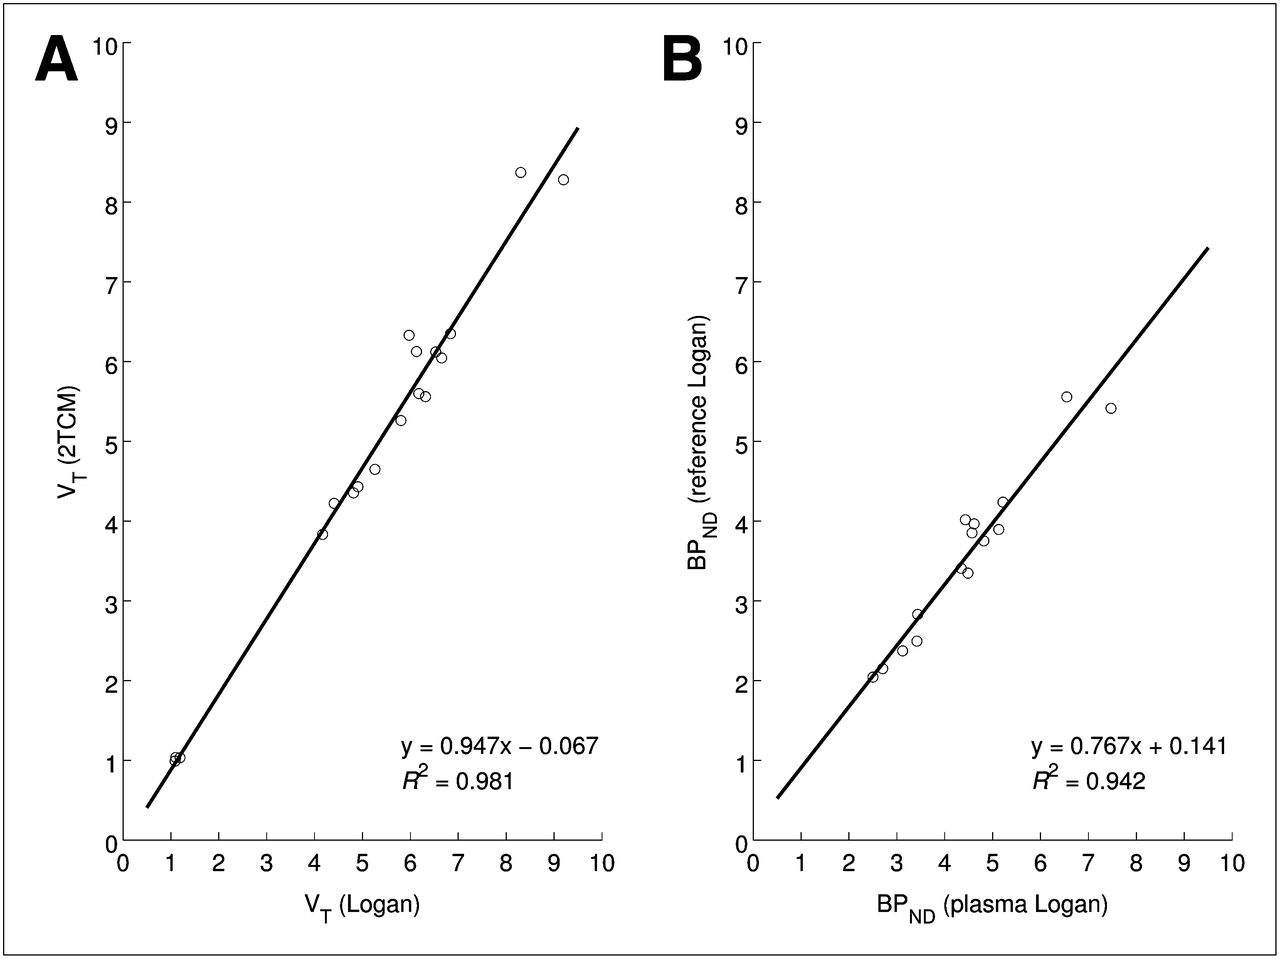
High VT values were observed in the thalamus, parts of the striatum, and the frontal cortex (Figs. 3 and 4). The cerebellum appeared to have the lowest VT of any brain region. With respect to kinetic modeling, blood-based 1TCM did not provide accurate fits to any of the time–activity curves, including the cerebellum, whereas 2TCM provided good fits to all time–activity curves (Fig. 5). VT values obtained with 2TCM correlated tightly with those from the Logan plot (Fig. 6), as did BPND values estimated from the respective VT values using the distribution volume ratio (DVR)−1, with the cerebellum acting as the reference tissue (R2 = 0.957; P < 0.001). As the Logan plot does not assume a particular model structure, the high correlation of 2TCM VT estimates with those from Logan plot analysis indicates that although the ligand binds to 3 OR subtypes, the similar affinities mean that kinetically these behave as a homogeneous group and hence can be modeled as a single bound tissue compartment.

Coronal, transverse, and sagittal sections through VT map for 1 rat overlaid on MR template. VT map was produced using metabolite-corrected plasma input Logan plot analysis and has color scale threshold of 5.
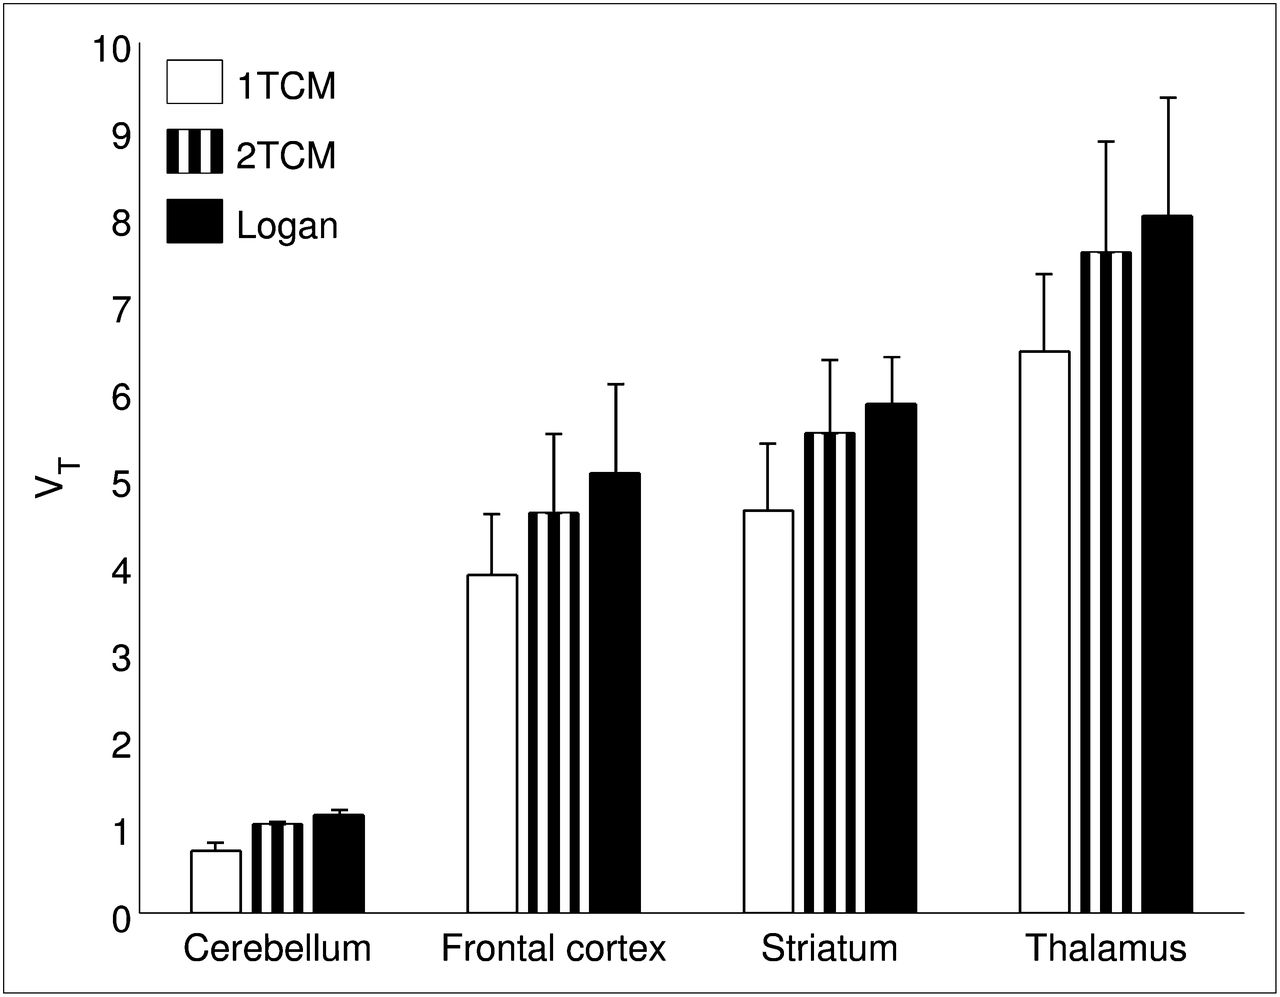
Mean regional VT values (n = 3 scans) produced using metabolite-corrected plasma input in conjunction with 1TCM, 2TCM, and Logan plot analysis. Error bars denote SD.

Regional time–activity curves for cerebellum (A) and thalamus (B) of 1 scan together with fits to data using metabolite-corrected plasma in conjunction with compartmental modeling with 1 and 2 tissue compartments.

Linear regression plots between regional VT values produced using metabolite-corrected plasma together with Logan plot analysis and 2TCM (A) and regional nondisplaceable BPND estimated from metabolite-corrected plasma input Logan plot analysis and reference tissue input Logan plot analysis (B). For both plots, statistical significance of Pearson correlation was P < 0.001.
Although BPND values estimated with the reference tissue approaches correlated with those from blood-based modeling, they provided relative underestimates (Fig. 6), likely because of the differential way in which the reference tissue information is used. The failure of 1TCM modeling for the cerebellum (Fig. 5) indicates the presence of nonspecific binding that is kinetically distinguishable from the free compartment and/or specific binding. The latter is likely to be responsible for the relatively poor fits obtained with the reference tissue model and the simplified reference tissue model (Supplemental Fig. 20). In this regard, the reference tissue Logan plot has an advantage over the reference tissue and simplified reference tissue models as it does not assume that the reference tissue can be modeled by a single tissue compartment. It should also be noted that the blood-based BPND estimates also assume no specific binding in the reference tissue and the same level of nonspecific binding in target and reference regions.
DISCUSSION
Few 18F-labeled ligands have been evaluated and validated for OR imaging (1,11–14). Only one of these ligands, 18F-fluorethyldiprenorphine, actually provides subnanomolar affinity (1). The main drawback of this radioligand, however, is related to its antagonist properties. Opioid antagonists have shown low susceptibility to changes in endogenous opioid concentration and to challenge with agonist OR ligands (6). Hence, because of their higher sensitivity to changes in OR availability, OR agonist ligands are highly desirable, including for our own studies on animal models of drug addiction (28,29).
A promising lead for the development of an 18F-labeled agonist OR ligand was published by Marton et al. (9). Their orvinol-type full OR agonist (PEO) showed a central nervous system distribution in accordance with OR receptor expression in the rat brain. 11C-PEO PET data acquired in rats indicated a slow pharmacokinetic profile due to high binding affinity to OR sites in the brain (Bmax (total receptor density)/Kd (dissociation constant) > 1,000 (9)). We, therefore, surmised that estimation of VT and/or BPND values with acceptable variability from kinetic modeling would require PET data acquisition periods of 3–4 h, and hence the 11C label needed to be replaced by a nuclide with a longer half-life, such as 18F.
A fluorine-labeled analog of 11C-PEO, namely 18F-FE-PEO, was synthesized starting from thebaine, an alkaloid from papaver somniferum. The binding pattern of FE-PEO to a large set of G-protein–coupled receptors, ion channels, and neurotransmitter transporters did not reveal significant off-target binding (Table 1). Despite modification of the lead structure, the binding affinities to cloned human OR remained high; subnanomolar Ki values were found for MOR and KOR and low-nanomolar affinity was observed for DOR. FE-PEO retained full agonist properties, activating DOR, KOR, and MOR with high potency. Based on the in vitro characterization, we conclude that FE-PEO provides promising in vitro characteristics as a full agonist OR ligand.
An automated 2-step process for the production of 18F-FE-PEO was then developed on a TRACERlab FX F-N radiosynthesis module according to the scheme shown in Supplemental Figure 16. The labeling precursor TE-TDPEO was obtained with high chemical purity, and in our initial attempts we used 2 mg of TE-TDPEO. However, the outcome of individual productions was unreliable. Radiochemical yields as high as 30% were accompanied by low-yielding productions with less than 2% product. Hence, the amount of precursor was gradually increased in order to improve the reliability of the automated procedure (Supplemental Fig. 18). Radiochemical yield gradually improved with higher precursor concentration, but more strikingly, so did the consistency of the radiochemical yield, with error margins of less than 3% achieved using greater than 7 mg of TE-TDPEO in 1 mL of MeCN.
However, at this point in the development of 18F-FE-PEO, we observed a general decline of labeling yields. After an approximately 3-mo storage period, radiochemical yield was typically lower than 10% with the formation of an unlabeled by-product. As a result, specific radioactivities of 12–50 GBq/μmol (n > 20) at the end of synthesis were obtained in our studies. This apparently low specific radioactivity was attributed to the presence of the nonradioactive by-product, which was found to originate from degradation of the precursor. Exhaustive screening for stationary phase–eluent combinations that permitted separation of the desired radioligand 18F-FE-PEO from this ultraviolet impurity were only partly successful. This problem posed a considerable constraint on our in vivo PET studies, since the exact nature of the by-product was not known and a risk of intoxicating the subject by exposure to a potential OR agonist was possible. However, thorough purification of the precursor by preparative HPLC resulted in a product of sufficient quality for animal studies. Notably, freshly prepared precursor in combination with 2 serial HPLC columns and bombardments of up to 60 min at a proton current of 48 μA resulted in much higher specific activities (52–224 GBq/μmol).
18F-FE-PEO binding (Figs. 2 and 3) was found to be consistent with OR expression data for the rat brain (3–5). Autoradiography after preincubation with the nonselective OR antagonist naloxone indicated that nonspecific binding appears to have a relatively uniform distribution (Fig. 2). Pretreatment using the MOR selective agonist DAMGO resulted in a significant reduction in specific binding (>90%) in high-binding regions that express mainly MOR, such as the endopiriform nucleus and anterior cingulate cortex (Fig. 2). Specific binding in the striatum, however, was reduced by approximately 60%. Assuming that DAMGO achieved a high level of occupancy, one can conclude that binding to DOR and/or KOR is a nonnegligible contributor to the specific binding in regions such as the striatum, consistent with the literature (3–5). This reduces the effective specificity of 18F-FE-PEO to changes in the MOR system, which is the OR subtype of most interest in addiction and pain processing (1,9). Conversion of VT obtained from blood-based kinetic analysis to DVR−1 in an effort to increase specificity for MOR is compromised by the spatial heterogeneity of the other OR subtypes and perhaps nonspecific binding; otherwise, normalization with VT in a MOR-devoid area could be a solution. Binding potential estimation from reference tissue modeling is similarly compromised as a MOR-specific measure.
CONCLUSION
The novel radiotracer 18F-FE-PEO was synthesized via an automated process using current good manufacturing practice–compliant equipment. Close similarities in labeling, purification, and quality control facilitate straightforward adoption of 18F-FE-PEO in PET centers that have been using the OR antagonist 18F-fluorethyldiprenorphine. 18F-FE-PEO was obtained in sufficient radiochemical yields and quality for routine application. Binding studies indicated high selectivity for OR compared with other potential targets and full agonist characteristics at all 3 OR subtypes. In vivo evaluation of this OR agonist showed a distribution in accordance with the OR distribution in the rat brain. Quantification of VT was feasible using metabolite-corrected blood data and is the recommended analysis method. Importantly, no discernible metabolite fraction was found in brain tissue. Reference-tissue Logan plot analysis could be used as an alternative to blood-based kinetic analysis. On the basis of the full agonist characteristics and 18F label, we conclude that 18F-FE-PEO is a useful addition to the portfolio of OR imaging agents.
DISCLOSURE
The costs of publication of this article were defrayed in part by the payment of page charges. Therefore, and solely to indicate this fact, this article is hereby marked “advertisement” in accordance with 18 USC section 1734. This study was funded by Medical Research Council (MRC) ICCAM grant G1000018 and by a joint award from the MRC and Wellcome Trust to the Behavioural and Clinical Neuroscience Institute at the University of Cambridge. The study was also supported in part by the Higher Education Funding Council for England (HEFCE), a Rosalie Canney endowed lectureship at the University of Cambridge, the NIMH Psychoactive Drug Screening Program, NIH grant R01 DA017204, and the Wolfson Brain Imaging Centre Major Research Facility. No other potential conflict of interest relevant to this article was reported.
Acknowledgments
We thank Bianca Jupp, Steve Sawiak, and Carolyn McNabb for their contribution to the biologic evaluation of the radiotracer.
Footnotes
↵† Deceased.
Published online Jan. 7, 2013
- © 2013 by the Society of Nuclear Medicine and Molecular Imaging, Inc.
REFERENCES
- Received for publication May 17, 2012.
- Accepted for publication August 21, 2012.


Jump to section
Related Articles
Cited By...
- No citing articles found.