


Abstract
In the course of metformin treatment, staging abdominal cancer lesions with 18F-FDG PET images is often hindered by the presence of a high bowel radioactivity. The present study aimed to verify the mechanism underlying this phenomenon. Methods: Fifty-three mice were submitted to dynamic acquisitions of 18F-FDG kinetics under fasting conditions. Three small-animal PET scans were obtained over a 4-mo study period. The animals were subdivided into 4 groups according to the following metformin administration protocol: group 1, untreated mice (n = 15); group 2, mice exposed to metformin treatment (750 mg/kg/d) for the 48 h before each PET study (pulsed, n = 10); group 3, mice treated for the whole study period (prolonged, n = 10); and group 4, mice in which prolonged treatment was interrupted 48 h before PET (interrupted, n = 8). The rate constant of 18F-FDG uptake was estimated by Patlak analysis. At the end of the study, the ileum and colon were harvested, washed, and counted ex vivo. Two further groups, of 5 animals each, were included to evaluate the effect of prolonged metformin treatment on phosphorylated adenosine monophosphate (AMP)–activated protein kinase (pAMPK) form and gene expression for thioredoxin-interacting protein (TXNIP). Results: Pulsed treatment did not modify gut tracer retention with respect to the untreated group. Conversely, prolonged treatment induced a progressive increase in 18F-FDG uptake that selectively involved the colonic wall, without any significant contamination of bowel content. This effect persisted after a complete drug washout in the interrupted group. These responses were paralleled by increased pAMPK availability and by reduced expression of TXNIP messenger RNA in colonic enterocytes exposed to prolonged metformin treatment. Conclusion: Metformin causes a selective increase in colonic 18F-FDG uptake. This effect appears after a relatively long period of treatment and persists soon after drug washout. Accordingly, the increased bowel glucose metabolism reflects a biologic response to chronic metformin treatment characterized by increased levels of pAMPK and reduced levels of TXNIP.
In patients under metformin treatment, high bowel radioactivity hampers interpretation of 18F-FDG PET images, because it can either mimic pathologic uptake or mask malignant lesions located within or near the gut (1–4). The association between metformin treatment and increased intestinal 18F-FDG uptake partially fits with current pharmacodynamics models considering the gut as a key organ for drug effect (5). Metformin actually decreases glucose transport from food to plasma (6) and enhances glucose consumption by enterocytes (5). However, modifications in glucose handling are mostly evident in the small intestine, whereas high 18F-FDG retention is more frequently observed in the colon (1,4,7).
Different methods have been proposed to improve image quality in these patients. However, both pharmacologic interventions (8) and preliminary colonic lavages (9) yielded contradictory results. On the other hand, discontinuation of metformin is a complex task because it implies a treatment change and insulin administration in most cases (4).
The present study aimed to elucidate the determinants of high intestinal 18F-FDG radioactivity content in mouse models, treated with long- or short-term metformin administration. To this purpose, we accurately identified the structure responsible for 18F-FDG accumulation and characterized the temporal trend of intestinal tracer uptake. Finally, to verify the underlying molecular mechanisms, we assessed the prevalence of the phosphorylated form of α AMPK subunit, phosphorylated adenosine monophosphate (AMP)–activated protein kinase (pAMPK), as a primary sensor of energetic cell asset (10). Moreover, we completed this analysis with the measurement of messenger RNA levels encoding for thioredoxin-interacting protein (TXNIP), a gene whose expression is powerfully suppressed by pAMPK yet stimulated by glucose (11).
MATERIALS AND METHODS
Animal Models
All experiments were conducted under the Guide for the Care and Use of Laboratory Animals (12). The study lasted 3 mo and included 53 nude outbred mice of either sex (aged 4 wk at the beginning of the experiment) that were kept under standard conditions and submitted to 4 different treatments. Animals in the first group (control, n = 15) did not receive any treatment. The second group (pulsed, n = 10) received metformin treatment for only the 48 h before each PET scan. In the third group (prolonged, n = 10), the drug was administered for the entire duration of the study, and in group 4 (interrupted, n = 8) metformin was continuously administered, but it was interrupted 48 h before scanning.
In groups 1–3, imaging was performed at months 1, 2, and 3 after the beginning of the experiment. By contrast, imaging was performed only at month 3 in the interrupted group (group 4) to avoid the possible consequences of 2 subsequent interruptions before the study and to better reproduce the clinical scenario. Ten additional mice, not submitted to 18F-FDG injection, were used to estimate AMPK phosphorylation and TXNIP gene expression 3 mo after either continuous metformin administration (group 5, n = 5) or the control regimen (group 6, n = 5).
Normal food consumption was maintained for the whole experiment for all groups. All animals were allowed free access to water. Metformin was orally administered by diluting the drug in autoclaved drinking water at a concentration of 3 mg/mL. Because water consumed by mice per day approaches 7.5 mL/30 g of body weight (13), this concentration approximately accounts for a dose of 750 mg/kg per day (14).
Experimental Small-Animal PET Protocol
Before imaging studies, mice were kept fasting for 8–12 h but had access to drinking water at all times. Soon before each PET scan, they were weighed, and anesthesia was induced by intraperitoneal administration of xylazine (10 mg/kg of body weight) and ketamine (100 mg/kg of body weight). Immediately after measurement of serum glucose, the animals were positioned on the bed of a small-animal PET system (Albira; Carestream Inc.) whose 2-ring configuration permits the covering of the whole animal. A dose of 3–4 MBq of 18F-FDG was then injected through a 26-gauge cannula placed in a tail vein, right after the start of a 50-min list-mode acquisition. Thereafter, the bed was moved and tail radioactivity was visualized to rule out significant extravasation (>10% of injected dose) in the injection site. Both before and during image acquisition, the animals were kept warm by exposure to red heating lamps.
Image Processing
The acquisition was reconstructed using the following framing rate: 10 × 15, 5 × 30, 2 × 150, 6 × 300, and 1 × 600. PET data were reconstructed using a maximum-likelihood expectation maximization method, with 12 iterations over a grid of 60 × 60 × 60 cubic voxels of 1 mm per side. An experienced observer, unaware of the experimental type of analyzed mouse, reviewed a representative chest slice in cine mode and drew the left ventricular volume of interest (VOI). Then, the computer was asked to plot the time–concentration curve within this volume throughout the whole acquisition to define the tracer input function. Whole-body 18F-FDG clearance (in mL × min−1) was calculated using the conventional stochastic approach, as the ratio between injected dose and integral of input function from 0 to infinity, fitting the last 20 min with a monoexponential function. Whole-body glucose consumption (in μmol × min−1) was thus obtained by multiplying clearance data for the corresponding glucose blood concentration.
A similar procedure was used to draw gut VOIs in the anterior abdomen, taking care to exclude contamination from the liver, spleen, kidney, and large vessels throughout all frames. Average uptake values (standardized uptake value [SUV]) were measured in the last frame. Moreover, this same VOI was used to plot the abdominal time–concentration curve to estimate the 18F-FDG rate constant using the Gjedde–Patlak graphical approach (15).
Ex Vivo Counting
At the end of the study, the animals were sacrificed by cervical dislocation. A modified Levin method was used to isolate the intestine (16) and to break up the colon and ileum. Thereafter, the distal end of each segment was placed in a vial, and the proximal end was cannulated with a syringe. Luminal content was thus gently washed with 2 mL of saline. Each intestinal segment was then weighted with a precision balance and placed in a separate vial containing 1 mL of saline. Counting was performed using a γ-counter (COBRA II; Packard) with a 10% energy window centered at 511 keV. For each series, a calibration vial containing 30 kBq of 18F was counted and decay-corrected.
The radioactivity of intestinal content was expressed as a fraction of injected dose, and intestinal tissue radioactivity concentration was expressed as ex vivo SUV index according to the following formula:
Molecular Signaling
After 3 mo of treatment, the animals of groups 5 and 6 were sacrificed for harvesting of the ileum and colon. The 2 mucosal epithelia were separated by careful scraping with a glass slide.
For measuring pAMPK levels, total proteins were extracted, homogenizing the corresponding samples at 4°C in lysis buffer (17) before centrifugation at 15,000g for 30 min at 4°C. Supernatants were collected for Western blot analysis of total cell proteins. Solubilized proteins were resolved by electrophoresis on 10% sodium dodecyl sulfate polyacrylamide gels, transferred onto nitrocellulose membranes, and subjected to immunoblot analysis with rabbit anti-pAMPK. Actin was used as a loading control. Data in enterocytes were compared with a positive control, represented by metformin-sensitive cells. To this purpose, we used a non–small cell lung carcinoma line (Calu-1) whose cells were exposed for 24 h to a high metformin concentration (10 mM) according to a procedure previously validated in our lab (17).
To estimate TXNIP messenger RNA levels, samples were homogenized using the Tissue Lyser (Qiagen) homogenizer. RNA was isolated by homogenization in Qiazol followed by further purification on RNeasy columns (Qiagen) and Dnase1 treatment for the removal of contaminating genomic DNA. Reverse transcription was performed with oligo dT primers in a final volume of 20 μL using the SuperScript reverse transcription kit (Invitrogen).
Primers were designed using Primer3 software (SourceForge) and checked for secondary structures. Real-time polymerase chain reaction was performed on a LightCycler 480 (Roche) using Platinum SYBR Green qPCR SuperMix UDG (Invitrogen) supplemented with 2 μL of complementary DNA, 10 mM sense and antisense primers, and 20X bovine serum albumin (1 mg/mL) (Invitrogen) in a final volume of 20 μL. An initial denaturation step of 2 min, during which the well factor was measured, was followed by 50 cycles of 5 s at 94°, 10 s at 55°, and 10 s at 72°. Fluorescence was performed during the annealing step in each cycle. After amplification, melting curves with 80 steps of 15 s and a 0.5°C increase were obtained to monitor amplicon identity. Expression data were normalized on the mean of β-actin, and glyceraldehyde-3-phosphate dehydrogenase gene expression data were obtained in parallel. Relative expression values were obtained using QGene software.
Statistical Analysis
Data are presented as mean ± SD. Different measurements in the same animal were compared using ANOVA for repeated measurements. For comparison between different groups, the null hypothesis was tested by a single-factor ANOVA for multiple groups. Linear regression analysis was performed by the least-squares method. P values of less than 0.05 were considered statistically significant.
RESULTS
Model Description
The study was completed in all animals, and no side effects occurred. As shown in Table 1, body weight was not significantly different in the 6 groups at any time, with the modest increase in body mass that occurred over time being independent of the protocol of drug administration. Similarly, Table 2 indicates that serum glycemia was always comparable in both untreated and pulsed groups, whereas a slight but progressive reduction occurred in the prolonged group. Blood sugar levels remained unchanged 48 h after drug withdrawal in the interrupted group. At laparotomy, gross visual inspection did not show any morphologic abnormalities in either the liver or the bowel.
Body Weight in Each Study Group at 3 Different Scan Times
Serum Glucose Levels of Animals Belonging to Each Study Group
Imaging of 18F-FDG Uptake by the Intestine
As shown in Figure 1, mean abdominal SUV remained relatively constant in untreated and pulsed mice throughout the study. However, continuous drug exposure markedly augmented gut 18F-FDG uptake. In fact, average abdominal SUV was already higher in the prolonged group than in either the untreated or the pulsed groups at month 1 and increased further thereafter (Fig. 1). Finally, drug withdrawal did not modify gut 18F-FDG uptake, because the interrupted and prolonged groups showed similar intestinal SUVs (Fig. 1).

SUV (A) and 18F-FDG rate constants (Ki) (B) in bowel region. Although 2-d metformin treatment did not modify these parameters, prolonged drug administration significantly increased bowel radioactivity uptake. These modifications appeared after 30 d of treatment (white columns), persisted without significant changes at months 2 and 3 (gray and black columns, respectively), and did not disappear after 48-h drug withdrawal in interrupted group. *P < 0.01 vs. both untreated and pulsed groups at same time.
Effect of Metformin on Whole-Body and Gut 18F-FDG Kinetics
Whole-body glucose consumption was similar in untreated and pulsed mice, without significant variations over time. By contrast, in the prolonged group, whole-body glucose consumption decreased at month 1 and remained steadily reduced thereafter (Fig. 2). The interrupted group showed values comparable to those observed in the prolonged group at the same time.

Under prolonged treatment, whole-body 18F-FDG clearance (A) showed initial drop but slowly returned to values similar to both pulsed and untreated models. However, product clearance × serum glucose concentration displayed by glucose consumption (B) showed stable reduction in models of prolonged treatment. Again, whole-body parameters did not revert to normal 2 d after drug interruption. *P < 0.01 vs. both untreated and pulsed groups.
The dual-phase response produced by long-term metformin treatment on whole-body glucose disposal presented a divergent time trend with respect to serum glycemia, which shows a progressive decrease. This pattern corresponded to a down-and-up behavior of 18F-FDG clearance that transiently decreased at month 1 (0.12 ± 0.03 mL × min−1, P < 0.01 vs. both untreated and pulsed animals) and returned to control values for the rest of the study (Fig. 2).
Patlak graphical analysis of gut 18F-FDG uptake provided well-defined regression lines with r values greater than 0.95 in all cases (Fig. 3). In untreated mice, the rate constant was 0.09 ± 0.03 min−1 at the first scan and did not change throughout the study (Fig. 1). Figure 1 shows that pulsed treatment did not significantly modify this variable at any time. By contrast, the intestine rate constant was already increased after 30 d of metformin treatment (0.25 ± 0.08 min−1, P < 0.01 vs. both pulsed and untreated groups) and remained steadily high thereafter. Again, the rate constant was similar in the interrupted group with respect to the prolonged one (Fig. 1).

Representative images from prolonged (A) and untreated groups (D). (B and E) Arterial (black) and gut (red) time–concentration curves. (C and F) Plots of Patlak regression lines indicating marked difference in slope induced by prolonged metformin treatment. Int = intestine.
Bowel glucose consumption was the main determinant of SUVs measured in the anterior abdomen. In fact, the 18F-FDG rate constant and SUVs correlated closely under all experimental conditions: in untreated mice (r = 0.71, P < 0.01), in pulsed mice (r = 0.71, P < 0.01), and in models of prolonged treatment (r = 0.81, P < 0.01).
Ex Vivo Evaluation
As shown in Table 3, the weight of both ileal and colonic samples was similar among the 4 groups. The contribution from radioactivity that had accumulated within the intestinal content accounted for 6%–12% of the whole measured gut counts, without any difference between proximal and distal segments. Similarly, metformin treatment did not modify tracer content within the bowel lumen (Table 3) either in the ileum or in the colon. Actually, 18F-FDG showed a preferential accumulation in the gut wall: average abdominal SUV measured on PET images indeed showed a strict correlation with the ex vivo SUV index (r = 0.89, P < 0.01).
In Vitro Experiment Data
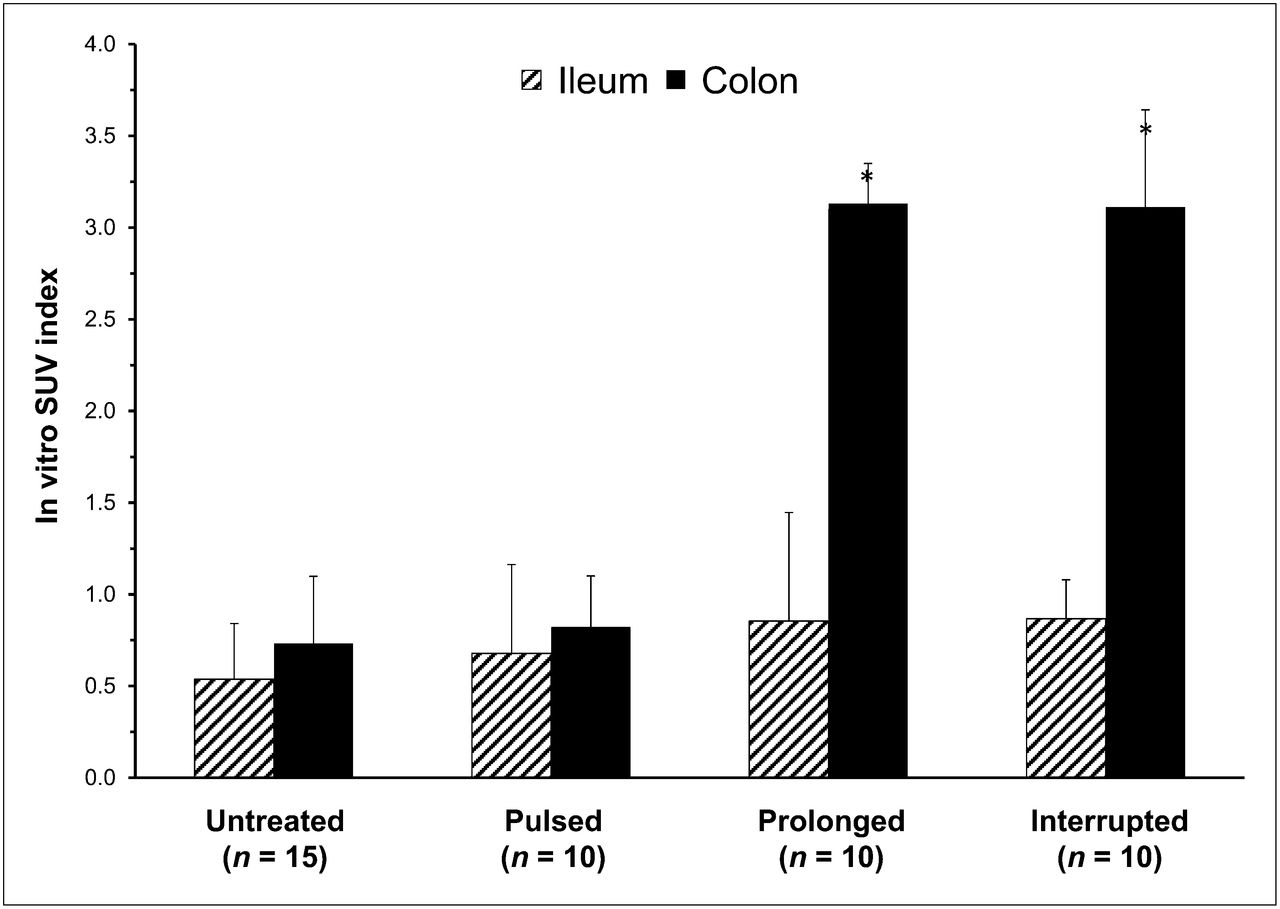
Moreover, the fraction of the dose retained in the ileal and colonic walls was similar in untreated and pulsed animals. In contrast, mice submitted to prolonged metformin treatment displayed a marked increase in the fraction of the dose retained by bowel (Table 3). This effect was reproduced in the animals of the interrupted group. This increase was selectively located in the colon, whereas the ileum showed a similar radioactivity concentration in all 4 groups (Table 3). Obviously, as shown in Figure 4, the same trend was observed when tracer concentration was analyzed as ex vivo SUV index, which selectively increased in the colonic tissue of mice exposed to the prolonged drug administration regimen.

Ex vivo counting data of radioactivity content in walls of ileum (hatched columns) and colon (black columns). Prolonged metformin treatment induced selective increase in colonic tracer uptake that persisted up to 48 h after its discontinuation. *< P < 0.01 vs. both untreated and pulsed groups.
Molecular Signaling
Analysis of the AMPK pathway showed that pAMPK was remarkably low in both epithelia under control conditions but markedly increased under prolonged metformin treatment. However, as shown in Figure 5, this effect was selective in colonic epithelium: no changes could be observed in ileal enterocytes.

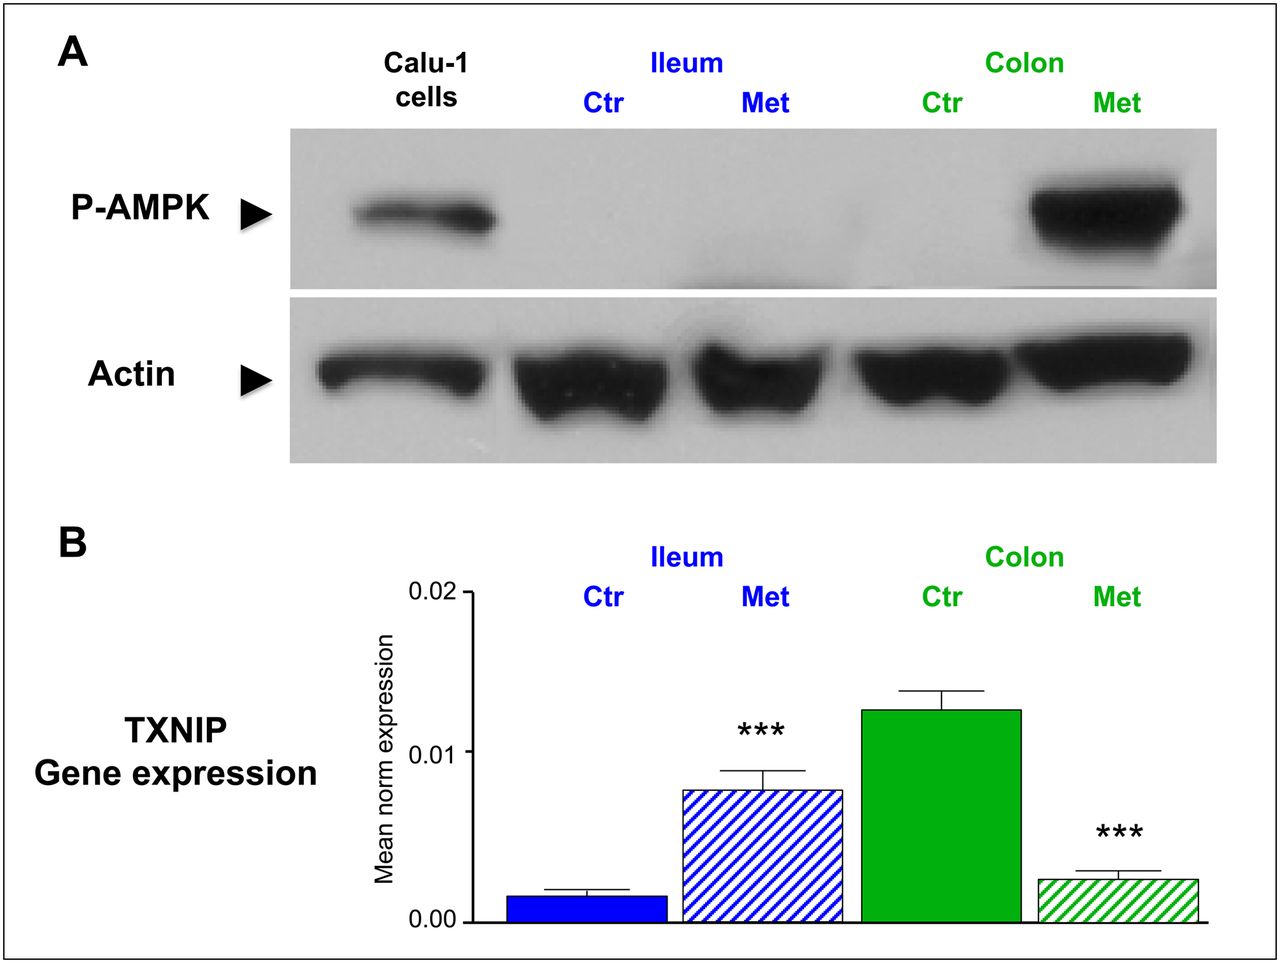
(A) Example of colonic increase of P-AMPK as documented by Western blot in proteins extracted from colon and ileum after prolonged metformin treatment. Total cell lysate of Calu-1 cells treated with metformin for 24 h (10 mM) was used as positive control (left). (B) Levels of messenger RNA encoding for TXNIP in 5 untreated mice and in 5 animals exposed to prolonged treatment. In colon (green columns), gene expression was high in untreated animals and was significantly downregulated by prolonged metformin treatment. The opposite, but equally significant, trend occurred in ileum (blue columns). Ctr = control; Met = metformin. ***P < 0.001.
Analysis of messenger RNA levels encoding for TXNIP (Fig. 5) displayed a completely opposed pattern. In fact, TXNIP gene expression was highly expressed in colon samples in untreated mice but was significantly downregulated by prolonged metformin treatment (P < 0.001).
Conversely, this variable showed the opposite trend in the small intestine, in which the low expression under basal condition was markedly enhanced in metformin-treated animals (P < 0.001).
DISCUSSION
The present experimental study was designed to evaluate the mechanisms underlying the metformin effect on gut 18F-FDG uptake.
To this purpose, we first verified whether the tracer was retained inside the lumen or in the wall tissue. This issue has not been solved by imaging studies (1–4) because of the influence of peristaltic activity, which limits image quality in 2 major ways: first, the time gap between the instantaneous CT map and delayed nuclear imaging limits the accuracy of the coregistration process, and second, the unavoidably long PET acquisition time results in a smeared aspect on functional images. To overcome these limitations, we completed the in vivo approach by measuring ex vivo tracer content in the different intestinal compartments. This procedure documented that metformin selectively increased 18F-FDG uptake in colon tissue, without affecting radioactivity retention in the ileum or contamination of lumen content.
As a further insight, our experimental approach documented that this drug effect needs a relatively long time. Because the half-life of metformin is about 6 h (18), 48-h treatment should have raised the drug concentration to a therapeutic level in the pulsed group, whereas the same duration of treatment withdrawal should have caused a complete drug washout in interrupted animals. Nevertheless, the gut metabolic pattern was not modified by pulsed treatment, whereas the chronic effect of metformin persisted unchanged 2 d after its suspension. Accordingly, these data indicate that the metabolic action of metformin cannot be directly attributed to the presence of therapeutic drug concentrations; rather, they reflect phenotypic modifications in gut cells that occur after a relatively long time and persist at least 2 d after drug disappearance.
This biologic reaction agrees with the kinetic model of metformin, whose concentration in the intestine is 10–20 times greater than in the rest of the body (19). At these levels, metformin inhibits the mitochondrial respiratory complex-1 (19), thus reducing the availability of adenosine triphosphate (ATP). The energy-tuning pathway AMPK phosphorylation (10,20) is thus activated, leading to a reduction in ATP-consuming sugar transport from food to blood (6) and to a marked increase in ATP production through glycolysis whose anaerobic nature—caused by the mitochondrial block—increases lactate production (5,20). In agreement with this model, cytosolic pAMPK was extremely low in untreated animals but greatly increased under prolonged metformin treatment. However, like the increased 18F-FDG uptake, this effect occurred only in colonic enterocytes.
To understand the mechanism underlying the divergent responses in the small and large intestines, we thus analyzed the genic expression of messenger RNA encoding for TXNIP. This protein (previously known as vitamin-D3-upregulated protein 1) (21) is a 50-kDa protein structurally homologous to the arrestins. Although its most acknowledged function is the inhibition of thioredoxin-reducing activity (22), recently TXNIP has been found to play a major physiologic role in glucose metabolism. In fact, mice with targeted deletion of this gene have low blood glucose, hyperlipidemia, and a severely dysregulated response to fasting (23). In agreement with this role, TXNIP concentration in the cytosol is regulated by cell energy status, with divergent actions exerted by glucose and pAMPK. The former increases its levels through the binding of 2 glycolytic intermediates (glyceraldehyde-3-phosphate and glucose-6-phosphate) to the gene activators carbohydrate-response elements and Mondo (24). The latter exerts the opposite effect and inhibits TXNIP production in response to changes in metabolite availability (11) and the presence of metformin (25).
Under control conditions, messenger RNA levels encoding for TXNIP were high in the colonic epithelium and low in the ileum. This gene expression pattern was reverted under prolonged metformin exposure. Although a detailed description of the molecular mechanisms underlying this opposite behavior are beyond the scope of the present study, the combined analysis of the 2 intestinal segments fits with the large differences in availability of sugar from the lumen. Under control conditions, the ileum transfers a large part of the alimentary sugar to the blood; the adequate energy asset and the relatively low rate of glycolysis results in low levels of AMPK and TXNIP. Under metformin treatment, the mitochondrial block reduces sugar transport to blood, and high-rate glycolysis prevents AMPK phosphorylation and promotes TXNIP gene expression.
The behavior of the colonic epithelium is indeed completely different. Given the virtual absence of lumen glucose in the large intestine, the only available fuel in this district is blood-driven glucose whose uptake is tracked by 18F-FDG. However, the lower availability of this metabolite would result in relatively lower levels of both ATP and glycolytic intermediates, thus explaining the increased AMPK phosphorylation and the silenced TXNIP expression, respectively.
According to these considerations, the present data also support the role of the intestines in the antihyperglycemic action of metformin (5,6) beyond the known reduction in liver glucose output (26). In fact, prolonged drug treatment caused a slight but progressive decrease in fasting serum glucose levels. This behavior coexisted with an otherwise paradoxic reduction in whole-body glucose consumption that decreased in the first month and remained relatively stable thereafter. The progressive reduction in glycemia is at least partially explained by the progressive increase in gut rate constants for 18F-FDG.
From a clinical perspective, the evidence of a selective and active increase of 18F-FDG uptake in the colon tissue explains the relative ineffectiveness of empiric attempts to reduce lumen contamination by colonic lavages (9) and confirms the potential of drug discontinuation protocols in reducing colonic SUVs (4). This procedure is routinely used with patients with kidney disease who are candidates for studies using contrast medium; however, its application would markedly complicate the clinical PET/CT activity because of its possible consequences on serum glucose levels and the need to accurately estimate the adequate washout duration. Even more important, the present data also provide a new insight into the protective role of metformin against colorectal cancer (27). In fact, the increased pAMPK availability in enterocytes—promoted by the combined action of prolonged treatment and absent luminal glucose—can inhibit colon cancer cell proliferation in vitro (28) and colon carcinoma growth in vivo (29).
Several limitations of our study need to be carefully considered. From a technical point of view, the limited resolution of PET images and the lack of coregistered anatomic maps might limit the accuracy of measurement in 2 major ways. First, the abdominal VOI might have included further organs besides the intestines, thus limiting the analysis of gut SUV trends. However, the availability of the dynamic sequence always permitted us to recognize and thus exclude the contamination coming from the 6 major abdominal organs (liver, large vessels, spleen, the 2 kidneys, and bladder). By contrast, VOI definition might have not included the whole gut, although this limitation seems of minor relevance considering the physiologic nature of the model and the agreement between imaging data and ex vivo measurement of intestinal radioactivity. Furthermore, partial-volume effect and spillover from the left ventricular myocardium might have altered the definition of arterial input function, thus limiting the accuracy of intestinal rate constants. However, the longitudinal nature of our protocol should have controlled the influence of this technical limitation, implying a similar systematic error in the same animals over time.
As a second limitation, the present study was performed in nondiabetic nude mice whereas metformin is used almost only in diabetic patients. On the one side, nude mouse models offer the relevant advantage of representing one of the most validated animal models of diabetes (30), providing a heterozygous background that better approximates the genetic variability encountered in the clinical activity. On the other hand, the prolonged persistence of 18F-FDG in the blood further increases gut tracer uptake in diabetics. However, our main purpose was to document the drug effect on gut metabolism. This task has been most often pursued in organs collected from nondiabetic animals (5,6,18,30). Moreover, the presence of diabetes would have further complicated our analysis because of the high tracer concentration in the blood pool, both at imaging and in harvested organs. Accordingly, although further studies in different mouse types with and without diabetes are needed to elucidate the role of gut in metformin action, the present data provide a clue to identify possible effective maneuvers to reduce gut radioactivity and to improve diagnostic interpretation of abdominal 18F-FDG distribution.
Animal sacrifice and ex vivo counting were performed only at the end of the study. This procedure does not permit verification of the time trend of an ileocolonic radioactivity gradient that might have been reverted even in the early phases of metformin treatment (5). However, this choice was motivated by the need to mimic the clinical condition, in which PET scanning is performed in diabetic patients with a long history of metformin treatment. Similarly, the gut 18F-FDG rate constants were not converted to absolute values of glucose consumption, despite the availability of serum glucose levels in all animals, because of the dual-input nature of intestinal glucose availability (from lumen and from blood) processed by energy-dependent sodium hexose symporter or by facilitative hexose transporter (glucose transporter type 2), respectively (5). A complete definition of drug effect on glucose handling would have implied the measurement of both uptake mechanisms. However, this complex issue was not tested because our goal was focused mostly on the mechanisms explaining the increased bowel uptake of the blood-driven 18F-FDG.
Finally, a similar consideration applies to the assessment of gut molecular response to metformin. In fact, both AMPK phosphorylation and TXNIP expression were assessed only in untreated animals and in mice receiving prolonged metformin treatment. This timing was set on the basis of maximal metformin effect as identified by PET. These evaluations were performed in animals not submitted to imaging to avoid any delay—which may have been caused by tissue counting—on tissue processing. This limitation prevented us from verifying the temporal relationship between glucose metabolism and signaling pathways. However, this analysis permitted us to at least partially explain the molecular mechanisms underlying the increased colonic 18F-FDG uptake under prolonged metformin treatment, thus better approximating the clinical setting of PET/CT in diabetic patients.
CONCLUSION
The molecular mechanisms underlying the action of metformin on glucose homeostasis and insulin effect have been extensively studied in tissues such as liver, muscle, and fat. However, relatively little is known about the effects of this compound on gut metabolism. Our study shows a markedly increased 18F-FDG uptake in the colonic wall of animals treated with metformin for a prolonged time. This selective effect reflects a biologic response of cells populating the distal intestinal tract in which ATP depletion caused by the prolonged exposure to metformin enhances AMPK phosphorylation and TXNIP gene expression. The differences in molecular signaling and metabolic patterns displayed by ileal and colonic enterocytes are coherent with the largely divergent availabilities of alimentary sugar in the bowel lumen. The biologic nature of this response indicates that heuristic attempts to improve 18F-FDG distribution by colonic lavages are most likely ineffective. These data indicate a greater potential for drug withdrawal, although feasibility and washout duration have to be directly verified in patients.
DISCLOSURE
The costs of publication of this article were defrayed in part by the payment of page charges. Therefore, and solely to indicate this fact, this article is hereby marked “advertisement” in accordance with 18 USC section 1734. No potential conflict of interest relevant to this article was reported.
Footnotes
Published online Jan. 3, 2013
- © 2013 by the Society of Nuclear Medicine and Molecular Imaging, Inc.
REFERENCES
- Received for publication March 29, 2012.
- Accepted for publication September 14, 2012.


Jump to section
Related Articles
Cited By...
- Metformin Impairs Intestinal Fructose Metabolism
- "Metformin Impairs Intestinal Fructose Metabolism"
- New Aspects of Diabetes Research and Therapeutic Development
- Enhanced Release of Glucose Into the Intraluminal Space of the Intestine Associated With Metformin Treatment as Revealed by [18F]Fluorodeoxyglucose PET-MRI
- Computational approaches for parametric imaging of dynamic PET data
- GDF15 and the beneficial actions of metformin in pre-diabetes
- Metformin, cancer and glucose metabolism