


Abstract
Quantification of molecularly targeted radiotracer uptake in the myocardium from SPECT remains challenging in part due to potentially low levels of focal tracer uptake of presently available molecularly targeted agents and further degradation of cardiac SPECT by extracardiac radioactivity and partial-volume effect. The purpose of this study was to derive and validate a new SPECT quantification method for assessments of absolute radiotracer uptake in the myocardium. Methods: The method was integrated with a hybrid micro-SPECT/CT imaging protocol to calculate radiotracer uptake of a molecularly targeted agent in the ischemic myocardium. CT coregistered with SPECT was used to identify the position and orientation of the left ventricle. Corrections for extracardiac activity and partial-volume errors were performed via a heuristic method derived with a total count sampling scheme. Myocardial radiotracer uptake was quantified from SPECT using an external point source as a known reference. Methods were validated using an ischemic rat model injected with a 99mTc-labeled SPECT radiotracer targeted at αvβ3 integrin. SPECT-quantified myocardial radiotracer uptake was compared with postmortem myocardial tissue well-counted radioactivity. Results: Initial correlation between SPECT-quantified and well-counted radioactivity was fair (R2 = 0.19, y = 0.50x + 0.05, P = 0.06) when no correction was applied to SPECT quantification. Correlation was significantly improved with tissue weight correction (R2 = 0.84, y = 1.82x − 0.01, P < 0.001), and a trend toward the improvement of correlation was observed with extracardiac activity correction (R2 = 0.85, y = 1.54x − 0.01, P < 0.001) and partial-volume correction (R2 = 0.86, y = 1.68x − 0.01, P < 0.001). Reproducibility of the SPECT quantification was excellent, either with no correction (R2 = 0.99, y = 1.00x + 0.00, P < 0.001) or with all corrections (R2 = 1.00, y = 1.00x − 0.00, P < 0.001). Conclusion: Corrections for the myocardial tissue weight, extracardiac activity, and partial-volume errors are crucial for precise assessments of myocardial radiotracer uptake using micro-SPECT/CT. The quantitative SPECT/CT approach developed provides a reasonable and reproducible in vivo estimation of absolute radiotracer uptake in a model of myocardial injury and should permit quantitative serial monitoring of subtle changes in the myocardial uptake of targeted radiotracers.
Substantial research has been directed toward the developments of molecularly targeted agents (1) and in vivo nuclear cardiac imaging techniques for noninvasive visualization and characterization of the molecular processes in the myocardium (1). Radiolabeled agents targeted at these molecular processes result in focal hot spot images. Precise detection of this focal tracer uptake via SPECT remains challenging in part due to the partial-volume errors associated with SPECT, leading to underestimation of radiotracer activity. Assessments of the myocardial radiotracer uptake in vivo are further complicated by the extracardiac radioactivity from organs adjacent to the heart. Visually tracking the changes of these targeted agents in the myocardium using current in vivo SPECT imaging techniques has never been straightforward. Although visual analysis might be possible under conditions in which the kinetics of the radiotracer and optimal imaging time are known, this type of visual analysis is subjective and not highly reproducible. Hence, a sophisticated quantitative approach is required for precise and reproducible assessments of focal myocardial radiotracer uptake.
We have previously developed a stochastic quantitative approach (2) for quantifying regional radiotracer uptake from cardiac SPECT/CT images. These prior studies used a 99mTc/201Tl dual-isotope imaging protocol, in which 201Tl was used for reference perfusion imaging and a 99mTc-labeled agent was used for molecularly targeted hot spot imaging. 201Tl SPECT images were used to identify the position and orientation of the heart for SPECT image reconstruction and hot spot quantification. Our previous dual-isotope SPECT approach worked reasonably well for a cardiac phantom (3) and large animals (2). However, the crosstalk between the 2 radiotracers used in the dual-isotope imaging may be problematic and adversely affect the precision of this dual-isotope quantitative approach. To alleviate this crosstalk contamination, we propose using CT in place of 201Tl SPECT to provide the anatomic information about the heart for SPECT hot spot quantification.
Although the partial-volume effect causes underestimation of true radiotracer uptake due to the limited SPECT resolution, the extracardiac activity, on the other hand, results in overestimation due to the spill-in radioactivity from extracardiac regions (4). The partial-volume effect is particularly severe in small-animal imaging, because the myocardial thickness is approximately 1–1.5 mm, which is less than 2.5 times of the full width at half maximum (FWHM) of the system resolution (∼1.3 mm for micro-SPECT) (5,6). To correct for the extracardiac activity and minimize the partial-volume errors, high-resolution SPECT/CT imaging systems and sophisticated data sampling and correction schemes are requisite for precise quantification of focal myocardial radiotracer uptake.
Corrections for the extracardiac spill-in contamination and partial-volume errors based on the anatomic structure have been proposed and validated by others for the heart (7–9) and brain (10,11). In essence, these correction methods require the anatomic data from magnetic resonance images (MRI) or CT images as a support for the corrections. For instance, the methods presented by Rousset et al. (11,12) define the geometric transfer matrix to recover the true radiotracer concentrations of different geometric regions by simultaneously solving the linear equations. Unfortunately, all of these methods require an assumption of homogeneous radiotracer distribution within each of the geometric regions. This homogeneous assumption can be applied to traditional myocardial perfusion images but may not be suitable for molecularly targeted (hot spot) images in that radiotracer uptake may be specifically localized to a small region of the myocardium and is not homogeneous.
In this paper, we introduce a new SPECT/CT segmentation algorithm based on the level-set framework (13). We also present a new approach to the corrections of extracardiac activity and partial-volume errors. Absolute myocardial tracer uptake is quantified from coregistered SPECT/CT images in which the segmented CT is used for identification of the left ventricular (LV) edges.
MATERIALS AND METHODS
The method derivation and validation described herein were based on SPECT/CT images acquired sequentially using a dual-head hybrid micro-SPECT/CT imaging system (Gamma Medica-Ideas). The micro-SPECT camera was equipped with two 1-mm pinhole collimators and 2 NaI detectors each pixilated into an image matrix size of 82 × 82 pixels, with a sensitive area of 12 × 12 cm. The SPECT system resolution was measured at approximately 1.3 mm using a micro hot rod phantom (ECT/DLX/MMP; Data Spectrum Corp.) filled with 99mTc. The micro-CT scanner with the spatial resolution of approximately 0.15 mm was mounted in the same gantry of the hybrid imaging system. An external point source (1 mm in diameter) filled with 99mTc was imaged simultaneously with the subject. Images were reconstructed via filtered backprojection and were reoriented in batch mode to ensure precise SPECT and CT coregistration using the external reference point source.
Method Derivation
In Vivo CT Image Segmentation
Cardiac CT images in vivo (Fig. 1A) usually suffer from low contrast and ambiguous LV boundaries in part due to the cardiac motion. Myocardial edge detection for cardiac CT is particularly complicated by the low contrast in the LV boundary as a result of LV cavity changes even in the presence of a contrast agent and is also affected by the random photon noise embedded in the image, causing false myocardial edges in image segmentation. In addition, the size of LV cavity changes during the cardiac cycle. As such, detection of the myocardial edges from low-contrast cardiac CT as shown in Figure 1A is immensely challenging. Here we derive an effective segmentation algorithm for in vivo CT based on the level-set framework (13) to obtain the endocardial boundary, whereas the epicardial boundary is estimated on the basis of the endocardial boundary and a priori information of known LV myocardial thickness. Details of the algorithm derivation are described in the Supplemental Appendix (supplemental materials are available at http://jnm.snmjournals.org). In brief, our LV segmentation algorithm consists of 2 major steps: LV cavity separation and LV epicardial edge detection. The LV myocardium is defined as the volume between the boundary of the LV cavity (endocardium) and the epicardial edge. Taking advantage of the coregistration of SPECT and CT, the myocardial boundaries derived from CT can be subsequently applied to the coregistered SPECT for quantification of targeted radiotracers, for which definition of the myocardium may be difficult secondary to focal or low levels of myocardial uptake.
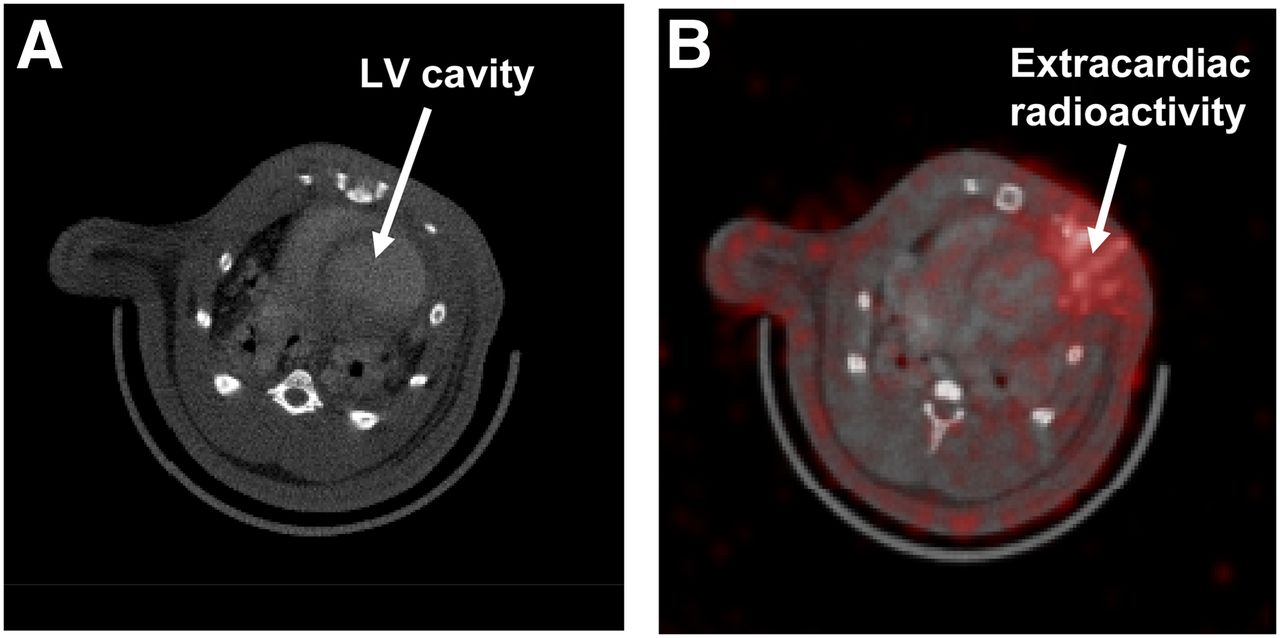
Illustrations of in vivo CT short-axis slice before LV cavity segmentation (A) and SPECT/CT fusion showing severe extracardiac activity in SPECT (B).
Point Source Extraction and Point Spread Function (PSF) Approximation
The external point source mentioned above is used to generate the PSF of the micro-SPECT system, which is incorporated into the extracardiac activity and partial-volume corrections and is also used for a reference of known dose for SPECT quantification. The volume of the reference point source imaged and reconstructed is estimated on the basis of a scheme of 3-dimensional (3D) gaussian fitting. Total counts of the external point source fitted as a 3D ellipsoidal gaussian shape are integrated within 2 SDs of the 3D gaussian function from the center of the point source volume to acquire 97.5% of counts in the point source (14). The 3D gaussian function of the point source is formulated as (15) Eq. 1where X = (x, y, z) denotes the spatial coordinates, Xn = (xn, yn, zn) denotes the spatial coordinates of the point source center, A is the height of the gaussian shape, N is a local neighborhood forming a basin of attraction of the point source, T is the matrix transpose operator, and M represents the variance matrix defined as
 Eq. 2
Eq. 2
The variances of the 3D gaussian function, (σx2, σy2, σz2), indicating the anisotropic distribution of the point source, are not necessarily identical. The parameters of the point source distribution are estimated by a gradient-expansion algorithm (16) to compute a nonlinear least squares (Supplemental Appendix). To locate the point source in SPECT, a seed is manually introduced into the point source region. The initial center of the point source is defined as the position of the pixel with maximal intensity in a finite region around the seed. Total counts of the point source are integrated from the 3D gaussian-fitted ellipsoidal volume (VPS). The total counts integrated from the external point source are used for the normalization of SPECT total counts within the myocardial volume and for the calculation of absolute myocardial tracer uptake.
The 3D gaussian function extracted from the point source can be approximated as the PSF of the SPECT imaging system used (17). In this study, the FWHMs of the PSF in the x, y, and z directions were measured, respectively, as 2.72, 2.37, and 2.43 mm, from the micro-SPECT system (voxel size, 1.524 mm3). This PSF in fact represents a composite spatial resolution function of intrinsic imaging system characteristic, collimator response, image reconstruction, and filtering processes. As such, the LV myocardial volume estimated from the coregistered CT can be convolved with this composite PSF for the extracardiac activity and partial-volume corrections described below.
Extracardiac Activity Correction
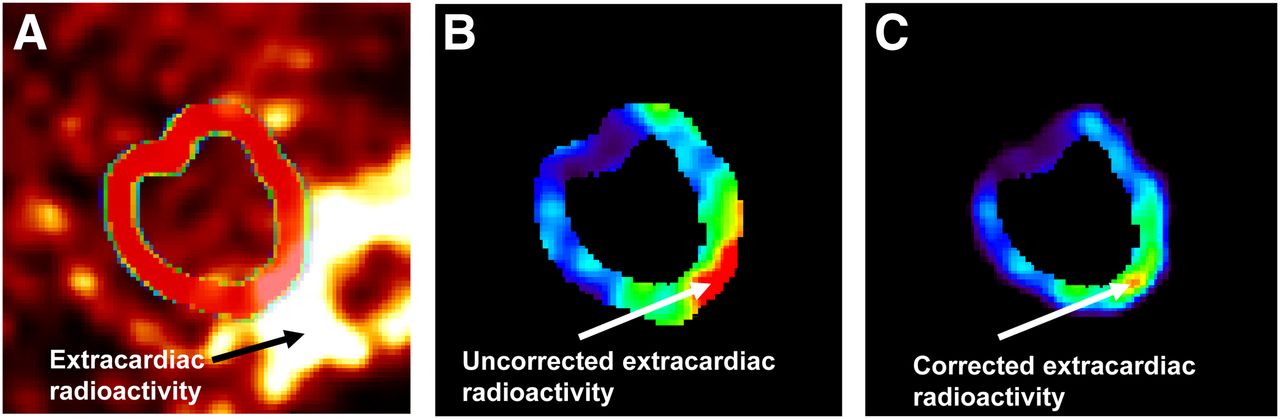
Extracardiac radioactivity (Fig. 1B), such as that from the adjacent liver or surgical wounds, inevitably contaminates or spills into the myocardium and subsequently causes overestimation of true myocardial uptake. This extracardiac contamination also results from the limited SPECT resolution (5,6,18). To correct for the extracardiac activity, we developed a heuristic detection approach to identifying the contaminated areas by inspecting the pixel value distribution f(r,θ) in the polar coordinate system along the radial direction of each myocardial segment (Supplemental Fig. 1), in which radius r is the distance from the center of gravity in the LV myocardial volume. If the radial count profile across the myocardial segment is a gaussian distribution or a uniform distribution (14), then the area enclosed by these voxels is assumed a noncontaminated region for which extracardiac (spill-in) activity correction is not necessary. Otherwise, the extracardiac radioactivity correction described below is applied to the region. This heuristic criterion is also used to inspect the center of the gaussian count profile in each myocardial segment (Supplemental Fig. 1). In short, our method for the extracardiac activity correction starts with the epicardial edges obtained from CT. We separate the extracardiac volume by 1 pixel (∼0.3 mm) from the epicardial edge defined by CT (Fig. 2A). This epicardial surface is used to generate a probability map for photons spilling into the myocardium as a result of extracardiac activities. In our method, the probability map (Fig. 2B) is generated by convolving the 1-pixel-wide extracardiac volume (Fig. 2A) with the 3D PSF mentioned above, taking into account the SPECT resolution. This probability map is used as a correction map (ρ) for extracardiac activity correction. The correction process is implemented on a voxel-by-voxel basis as Eq. 3where f(.) denotes original uncorrected voxel values in the polar coordinate system, ρ(.) is the correction probability (Fig. 2B), γ(.) is the corresponding voxel contaminated by extracardiac activities, and fa(.) is the voxel values after the extracardiac activity correction. Notice that the extracardiac activity correction expressed in Equation 3 is implemented only for the voxels within the epicardial edge determined by CT plus 1 voxel outward from the epicardial edge as illustrated in Figure 2A. With this correction scheme, voxels on the epicardial edge have a higher correction probability (ρ) than those inside the edge because of the gaussian property (2,14). However, the extracardiac activity correction is not implemented for the uncontaminated voxels determined above—that is, ρ = 0 in Equation 3.

Illustrations of CT epicardial edge (A), correction map for extracardiac activity correction (B), LV myocardial volume in CT with unit activities assigned (C), and correction map for partial-volume effect generated by convolving binary CT image shown in C with PSF (D).
Partial-Volume Effect Correction
Our method for partial-volume correction is derived using a priori LV anatomic information from CT. The partial-volume effect in SPECT is primarily caused by image degradation and inadequate count recovery when the object size is smaller than 2.5 × FWHM of the imaging system resolution (6). We simulate this effect by convolving the LV myocardial volume, in which all voxels are assigned unit activities (Fig. 2C), with the composite 3D PSF (2.5 × FWHM = ∼9 mm for this study) calculated from the point source SPECT images. The binary CT images of the LV myocardial volume blurred (convolved) by the PSF can be used as a correction map (λ) (Fig. 2D) for the partial-volume correction thanks to the coregistration of CT and SPECT. The partial-volume errors of SPECT are rectified using the correction map on a voxel-by-voxel basis as Eq. 4where fa(.) represents the voxel values with the extracardiac activity correction (Eq. 3) in the myocardial volume of which the LV edges are determined by CT (Fig. 2C), λ(.) denotes the corresponding voxel values from the correction map illustrated in Figure 2D, and fb(.) is the voxel values in the corresponding voxel after additional partial-volume correction.
Absolute Focal Tracer Uptake Calculation
The correction algorithms derived above are performed in 3D. To match the tissue well-counted data for comparisons, the LV myocardium volume in SPECT needs to be divided into the same number of slices in its corresponding excised left ventricle. The 3D LV myocardial volume determined by CT is applied to the coregistered SPECT. The external point source filled with 99mTc is used as a known reference to quantify absolute focal tracer uptake in the LV myocardium as aforementioned. After the corrections for extracardiac activity and partial-volume errors, the total counts of targeted radiotracer uptake in the segmented LV myocardium are normalized by the total counts of the external point source (Eq. 5). The radiotracer uptake is in turn weighted by the known radioactivity of the external point source to yield absolute radiotracer uptake. The total radiotracer uptake is thus calculated by (15) Targeted radiotracer uptakeEq. 5
where ζ(ν) denotes the targeted radioactivity in the segmented LV myocardial voxel v, p(u) denotes the radioactivity in the point source voxel u, c is the known radioactivity (expressed in MBq) in the point source, and VLV and VPS represent the total volumes of the LV myocardium and the point source, respectively.
Method Validation
Surgical and Imaging Preparation
Four rats weighing 200–250 g were used in our method validation. Rats were anesthetized with isoflurane, and the heart was exposed via a limited left anterolateral thoracotomy. The left anterior descending (LAD) coronary artery was ligated at 7 mm distal to the origin by snare. The LAD occlusion was continued for 45 min, followed by reperfusion to create nontransmural ischemic injury, resulting in new microvessel formation (a process termed angiogenesis) in the injured myocardium. The chest was subsequently closed in layers, and the rats were recovered from anesthesia.
Four weeks after the myocardial injury, rats were anesthetized again with isoflurane and positioned in the hybrid micro-SPECT/CT imaging system for sequential CT and SPECT imaging. An iodinated x-ray vascular contrast agent (Omnipaque; GE Healthcare) was infused continuously at a constant rate of 0.6 mL/min during CT imaging to visually separate the LV cavity from the myocardium. An external point source filled with approximately 1 MBq of 99mTc was placed under the imaging table and near the heart. A 99mTc-labeled radiotracer (148–370 MBq) targeted at αvβ3 integrin (Maraciclatide; GE Healthcare), a biomarker of angiogenesis, was injected into rats via a jugular vein catheter for SPECT imaging. All experimental protocols were approved by the Institutional Animal Care and Use Committees at the Yale University School of Medicine according to the guiding principles of the American Physiologic Society on research animal use.
Image Acquisition and Reconstruction
Five hundred twelve CT projections were acquired at 50 kVp and 600 μA for 15 min using the hybrid dual-head micro-SPECT/CT imaging system. CT images were reconstructed using conventional filtered backprojection. The matrix size of CT images was 512 × 512 × 512 voxels, with a voxel size of 0.1557 mm3. For SPECT acquisition, a 20% energy window was symmetrically centered at a 140-keV photopeak of 99mTc. SPECT images were acquired for 35 min at 75 min after the radiotracer injection. Thirty-two SPECT projections per camera head were acquired using a circular orbit and reconstructed via filtered backprojection. The SPECT matrix size was 82 × 82 × 82 voxels, with a voxel size of 1.524 mm3. CT and SPECT images were fused and coregistered with a common matrix size of 256 × 256 × 256 voxels and a voxel size of 0.3114 mm3.
Quantification of SPECT Regional Tracer Uptake
The level-set image segmentation method (Supplemental Appendix) was applied to the CT images obtained above to determine the LV cavity and epicardial edges. The resulting myocardial edges were applied to the SPECT images, which had been precorrected for the extracardiac activity and partial-volume errors. Total counts in the LV myocardium were obtained by integration of counts between the CT-determined endo- and epicardial edges, and the total counts were then normalized by the total counts of the external point source to calculate regional radiotracer uptake in the LV myocardium.
γ-Well Counting of Radioactivity
Rats were sacrificed immediately after in vivo SPECT/CT imaging. The heart was extracted from the chest and was filled with dental molding material (alginate impression material; Quala Dental Products) to facilitate uniform cutting of the LV myocardium into 2-mm-thick slices. The total number of the postmortem slices was determined by the size of the heart, and each of the slices was further subdivided into 8 radial segments for γ-well-counting measurements (Supplemental Fig. 2A). For the apex, the slice was divided into 4 segments rather than 8 because the apical slice (Supplemental Fig. 2B) was relatively small, compared with the other LV slices. Radioactivities of each myocardial sample and the external point source were measured by a γ-well counter (Cobra Packard) using the 140-keV energy peak and window limits based on FWHM analysis of the peak derived from pure 99mTc isotope. Raw tissue counts were corrected for background, decay, and tissue weight. Ultimately, the corrected counts were converted to megabecquerels using a previously determined counter efficiency.
Comparisons Between SPECT-Quantified and Well-Counted Regional Uptake
To compare SPECT-quantified radiotracer uptake with well-counted measurements, the LV myocardium from SPECT images was divided into slices with the same equal thickness of 2 mm as the postmortem slices. The numbers of SPECT slices and segments of the LV myocardium were chosen to match the numbers of postmortem data as aforementioned (Supplemental Fig. 2) for identification and calculation of the numbers of the myocardial segments contaminated by the extracardiac activity. To take into account the regional variation of thickness and area in the postmortem LV slices, SPECT-quantified radioactivity was further corrected by a weighting factor (Ω) defined as Eq. 6
Eq. 6
where Wt denotes the total weight of the left ventricle, Nt represents the total number of tissue slices, and i and n are the slice and rat indices, respectively. In this study, 19 (4 slices × 2 rats + 5 slices × 1 rat + 6 slices × 1 rat) LV myocardial slices from 4 rats were compared before and after the tissue weight correction.
Assessment of Reproducibility for SPECT Quantification
The SPECT quantitative processes and analyses described above mainly included 3 automatic procedures (epicardial boundary edge detection, extracardiac activity and partial-volume corrections, and quantification of myocardial radioactivity) and 2 manual procedures (LV cavity segmentation and point source extraction). These procedures were repeated twice for the following 2 extreme cases: one without any correction and the other with all corrections (tissue weight, extracardiac activity, and partial-volume errors), to assess reproducibility of the SPECT-quantified results.
Statistical Analysis
SPECT-quantified regional uptake in the LV myocardium was compared with γ-well-counted radioactivity on a segment-by-segment and slice-by-slice basis. Linear regression analysis was performed, and SEE was calculated for the comparisons.
RESULTS
Illustrations of Image Segmentation
The LV cavity determined using the level-set method for a representative rat is shown in Figure 3A. We demonstrate here a short-axis slice of the left ventricle as an example whereas the LV segmentation method was in fact implemented over the entire 3D space. As detailed in the Supplemental Appendix, a cost function was designed to determine the endocardial and epicardial surfaces. Shown in Supplemental Fig. 3 are 2 local maximums derived from the cost function optimization (Equation A5, Supplemental Appendix), in which the first local maximum defines the endocardial surface and the second local maximum defines the epicardial surface. The thickness of the LV myocardium was calculated as the distance between the endocardial and epicardial surfaces (e.g., 7 pixels in Supplemental Fig. 3). The estimated LV myocardium in the short-axis view of a representative rat was color-coded in green as shown in Figure 3B. The myocardial thickness of 7 pixels estimated above was equivalent to 2.2 mm (7 × 0.3114 mm/pixel), whereas the true thickness of the rat myocardium used in this study was approximately 1–1.5 mm. The estimated myocardial thickness adapted to the coregistered SPECT below seemed reasonable, in consideration of the relatively low system resolution (∼1.3 mm), compared with the CT resolution (∼0.15 mm). The LV edges were applied to the αvβ3-targeted SPECT images (Fig. 3C) for the corrections of extracardiac activity and partial-volume errors and for the total count sampling.

Illustrations of in vivo CT short-axis slice with segmented LV cavity colored in red (A), in vivo CT short-axis slice with LV myocardium (in green) superimposed (B), and in vivo SPECT short slice of αvβ3-targeted image with LV myocardium superimposed (C).
Demonstrations of Extracardiac Activity Correction
Figure 4A shows an αvβ3-targeted SPECT image superimposed with the corresponding LV myocardial edges estimated by our method. The counts distribution in the segmented LV myocardium is shown in Figure 4B. The extracardiac radioactivity in part caused by the surgical wound from our experiments was noticeably corrected (Fig. 4C).
Demonstrations of in vivo SPECT short-axis slice of αvβ3-targeted image with region of interest (A), segmented LV myocardium volume in same SPECT slice before extracardiac activity correction (B), and SPECT slice after extracardiac activity correction (C).
Illustrations of SPECT Quantification With and Without Corrections for Extracardiac Activity and Partial-Volume Errors
Figure 5 shows comparisons between well-counted radioactivity and SPECT-quantified radioactivities with and without extracardiac activity and partial-volume corrections, for the representative SPECT slice shown in Figure 4. The well-counted radioactivity for each of the segments (Supplemental Fig. 2A) in the slice is shown in Figure 5 (green curve). Notice that the well-counted data had been corrected for decay according to the interval between SPECT imaging and γ-well-counting times. SPECT-quantified radioactivity with and without extracardiac activity and partial-volume corrections are shown in Figure 5 as red and black curves, respectively. As seen, the overestimation of the myocardial focal tracer uptake caused by the extracardiac activity and partial-volume errors, particularly in segments 5–7, was markedly reduced when both corrections were implemented. Nonetheless, there was still residual overestimation of true radioactivity presumably due to the fact that the correction of tissue weight had not been implemented for the results shown in Figure 5.

Comparisons between SPECT-quantified and well-counted radioactivities for representative SPECT slice shown in Figure 4. Green curve shows true well-counted radioactivity. Red and black curves demonstrate SPECT-quantified radioactivity with and without corrections, respectively.
Comparisons Between SPECT-Quantified and Well-Counted Radioactivities
The spill-in extracardiac activity in the LV myocardium of the rats used in this study was substantial (43% ± 4% of LV myocardial segments/slice, n = 19 slices) and required corrections. Figure 6 shows the correlations between SPECT-quantified and well-counted radioactivities with no correction (NC) and with the step-by-step corrections for tissue weight (TC); tissue weight plus extracardiac activity (TEC); and tissue weight, extracardiac activity, and partial-volume errors (TEPC). Without any correction (NC), the correlation was fair (R2 = 0.19, y = 0.50x + 0.05, SEE = 0.03, P = 0.06, n = 19), whereas the correlations continued to improve with the accumulative step-by-step corrections for TC (R2 = 0.84, y = 1.82x − 0.01, SEE = 0.03, P < 0.001), TEC (R2 = 0.85, y = 1.54x + 0.01, SEE = 0.02, P < 0.001), and TEPC (R2 = 0.86, y = 1.68x − 0.01, SEE = 0.02, P < 0.001). Estimation errors (mean ± SD) of SPECT-quantified myocardial radioactivities for NC, TC, TEC, and TEPC were 0.03 ± 0.04, 0.03 ± 0.04, 0.02 ± 0.03, and 0.02 ± 0.03 MBq, respectively. The mean estimation errors and SDs with additional corrections for extracardiac activity and partial-volume errors (TEC and TEPC) were less than those without any correction (NC) and with tissue weight–only correction (TC). Reproducibility of the SPECT quantification was excellent in both NC (R2 = 0.99, y = 1.00x + 0.00, SEE = 0.003, P < 0.001, n = 19) and TEPC (R2 = 1.00, y = 1.00x − 0.00, SEE = 0.003, P < 0.001, n = 19).
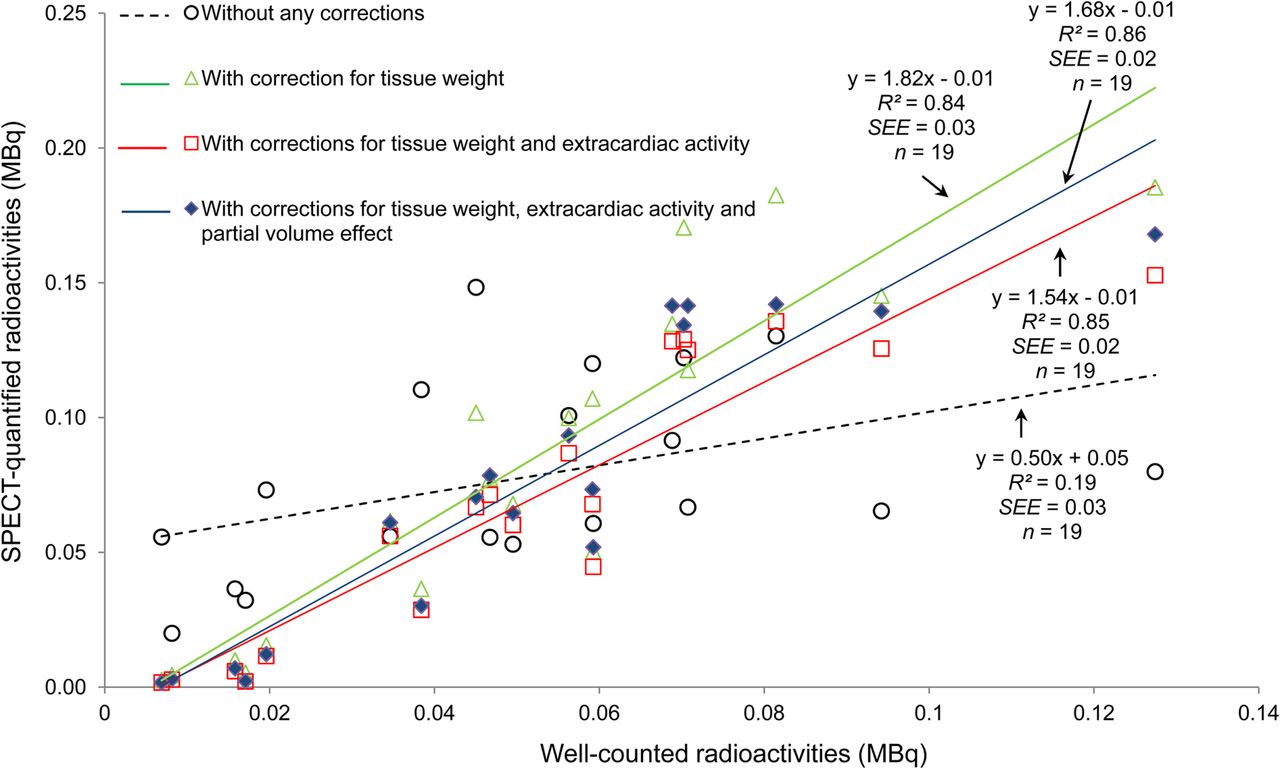
Correlations between SPECT-quantified and well-counted radioactivities with step-by-step corrections.
DISCUSSION
Molecularly targeted cardiac SPECT imaging is a rapidly emerging field with the potential for translation to patients. The development of these target radiotracers for evaluation of cardiovascular disease relies on small-animal imaging for the evaluation of the molecularly targeted processes in the heart. Quantification of these molecular processes in vivo is extremely important but challenging. To our knowledge, there are no well-established quantitative tools that exist for quantification of regional uptake of targeted SPECT tracers for application in small-animal imaging. In this paper, we have derived an image segmentation approach using the level-set scheme for identification of the LV cavity from CT and developed an integrated SPECT quantification method for the corrections of extracardiac activity and partial-volume errors to provide precise and reproducible assessments of absolute focal tracer uptake in the myocardium. The maps of the correction functions were generated by convolving the CT-defined LV surfaces and LV volumes with the composite 3D PSF. The LV myocardial volume in SPECT was corrected on a voxel-by-voxel basis using the correction maps. These methods were evaluated using an in vivo rat model and a radiotracer targeted at αvβ3 integrin activation, a biomarker of angiogenesis. Our study demonstrated that quantification of hybrid micro-SPECT/CT imaging with the corrections of extracardiac activity and partial-volume errors provided a reasonable estimate of targeted radiotracer uptake.
We believe that the study presented herein is unique, particularly in the absolute quantification of myocardial radiotracer uptake from hybrid micro-SPEC/CT imaging of a small-animal model with ischemic myocardial injury. Previous studies by others in hot spot quantification were mostly focused on oncologic PET (19–21) in which the standardized uptake value was used as an indirect relative index for glucose metabolism to quantify and provide additional information for tumor prognosis (22). In this report, however, we introduced a direct quantification of absolute myocardial tracer uptake from hybrid micro-SPECT/CT, which required the corrections for extracardiac activity and partial-volume errors.
Absolute SPECT quantification of radioactivity in the myocardium is particularly complex because of various confounding factors that were reported in the early 1980s and 1990s using a mathematic model (23) and in phantom (24) and canine models (25). Some of these early studies used a mean count sampling scheme (25) for semiabsolute (relative) SPECT quantification, which may be more susceptible to the partial-volume effect (23) than the total count sampling approach we introduced in this study. Recent studies for cardiac SPECT hot spot quantification can also be found in the literature (9,26–29). Da Silva et al. (26) proposed a variation of our method for SPECT quantification from conventional cardiac SPECT/CT using a prior background template, and their algorithms were validated using a cardiac phantom (28) and a large animal model (26,27). In contrast to their approach, we used the composite 3D PSF directly to simulate the geometric extent of the myocardium, and thus the prior background template used in their algorithm (26) was not needed in our extracardiac radioactivity correction. On the other hand, we derived the anatomic information directly from the corresponding CT image. We argue that our method may be more precise than those using the data-dependent anatomic information (28) to build a probability map for the corrections of extracardiac radioactivity and partial-volume errors.
For the partial-volume correction in particular, Rousset et al. (11) and Carson (30) also proposed methods for quantification of brain PET imaging in which the background activity (11) and region of interest (30) in the brain was assumed uniform. For cardiac SPECT hot spot quantification, however, it is difficult to simulate extracardiac activity using the anatomic information from background objects because the concentration of targeted radiotracer uptake in the background objects is not homogeneous as aforementioned. It is next to impossible to use the geometric transfer matrix method (11) to recover the true targeted radiotracer concentrations in different geometric regions. Thus, the geometric transfer matrix scheme proposed by Rousset et al. (11) and the maximum likelihood region-of-interest method by Carson (30) were not incorporated into our partial-volume correction.
Although the preliminary results presented herein are quite encouraging, several study limitations are worth mentioning. First, we did not apply photon attenuation correction to the micro-SPECT images in our method validation because the effect of photon attenuation was assumed to be minimal for small-animal imaging. Second, we did not apply respiratory and cardiac motion corrections to our in vivo micro-SPECT/CT images while the respiratory and cardiac motions may cause additional image degradation. Nonetheless, previous studies by others (27,31) reported that the effect of respiratory and cardiac motion might lead to an estimation error on the order 10% for absolution quantification (27) and was minimal for relative quantification (31) and thus should not be a dominate limitation of our methodology. Third, we extended only 1 voxel outward from the LV edges in CT for the extracardiac activity correction. This scenario might not be ideal because regions beyond the 1-voxel-wide edges could also contribute to the spill-in errors, causing residual overestimation (Fig. 6) of true radioactivity due to the undercorrected spill-in errors. Finally, the number of animals used in this study was small, and the number of samples (n = 19) used in our statistical analysis was calculated by the total number of myocardial slices from 4 rats. Multiple samples from each of the animals with the same experiment may cause a statistical bias in the data analysis. Nevertheless, the number of animals and the suboptimal statistical analysis demonstrated in this study appeared to be adequate for our preliminary validation with the focus of method developments. Despite these study limitations, we have introduced a novel and simplistic approach to the corrections of extracardiac radioactivity and partial-volume errors and developed a new SPECT quantitative analysis tool for the assessment of absolute regional radiotracer uptake in the myocardium using hybrid micro-SPECT/CT.
CONCLUSION
An approach for quantification of hybrid SPECT/CT images that incorporates the correction schemes for extracardiac activity and partial-volume errors has the potential of providing a reliable in vivo estimation of absolute radiotracer uptake in the myocardium. This method may permit serial monitoring of the subtle changes in absolute regional myocardial uptake of targeted radiotracers in preclinical models of myocardial injury with the potential translation to patients using hybrid SPECT/CT systems.
DISCLOSURE
The costs of publication of this article were defrayed in part by the payment of page charges. Therefore, and solely to indicate this fact, this article is hereby marked “advertisement” in accordance with 18 USC section 1734. This work was supported in part by the American Heart Association Grant-in-Aid 0555808T and National Institutes of Health (NIH) 5R01 HL65662-01A1. This publication was made possible also by the CTSA grant UL1 RR024139 from the National Center for Research Resources (NCRR), a component of the NIH, and NIH roadmap for Medical Research. Its contents are solely the responsibility of the authors and do not necessary represent the official view of the NCRR or NIH. No other potential conflict of interest relevant to this article was reported.
Acknowledgments
We thank Xiaoyue Hu and Christi Hawley for their assistance in the surgical preparation, animal care, and data collection for entire animal imaging experiments.
Footnotes
Published online Nov. 12, 2013.
- © 2013 by the Society of Nuclear Medicine and Molecular Imaging, Inc.
REFERENCES
- Received for publication April 1, 2013.
- Accepted for publication July 24, 2013.


Jump to section
Related Articles
Cited By...
- No citing articles found.