


Abstract
In patients with low-grade glioma (LGG) of World Health Organization (WHO) grade II, early detection of progression to WHO grade III or IV is of high clinical importance because the initiation of a specific treatment depends mainly on the WHO grade. In a significant number of patients with LGG, however, information on tumor activity and malignant progression cannot be obtained on the basis of clinical or conventional MR imaging findings only. We here investigated the potential of O-(2-18F-fluoroethyl)-l-tyrosine (18F-FET) PET to noninvasively detect malignant progression in patients with LGG. Methods: Twenty-seven patients (mean age ± SD, 44 ± 15 y) with histologically proven LGG (WHO grade II) were investigated longitudinally twice using dynamic 18F-FET PET and routine MR imaging. Initially, MR imaging and PET scans were performed, and diagnosis was confirmed on the basis of biopsy. Subsequently, PET scans were obtained when clinical findings or contrast-enhanced MR imaging suggested malignant progression. Maximum and mean tumor-to-brain ratios (20–40 min after injection) (TBRmax and TBRmean, respectively) of 18F-FET uptake as well as tracer uptake kinetics (i.e., time to peak [TTP] and patterns of the time–activity curves) were determined. The diagnostic accuracy of imaging parameters for the detection of malignant progression was evaluated by receiver-operating-characteristic analyses and by Fisher exact test for 2 × 2 contingency tables. Results: In patients with histologically proven malignant progression toward WHO grade III or IV (n = 18), TBRmax and TBRmean increased significantly, compared with baseline (TBRmax, 3.8 ± 1.0 vs. 2.4 ± 1.0; TBRmean, 2.2 ± 0.3 vs. 1.6 ± 0.6; both P < 0.001), whereas TTP decreased significantly (median TTP, 35 vs. 23 min; P < 0.001). Furthermore, time–activity curve patterns changed significantly in 10 of 18 patients (P < 0.001). The combined analysis of 18F-FET PET parameters (i.e., changes of TBRmax, TTP, or time–activity curve pattern) yielded a significantly higher diagnostic accuracy for the detection of malignant progression than changes of contrast enhancement in MR imaging (accuracy, 81% vs. 63%; P = 0.003). Conclusion: Both tumor-to-brain ratio and kinetic parameters of 18F-FET PET uptake provide valuable diagnostic information for the noninvasive detection of malignant progression of LGG. Thus, repeated 18F-FET PET may be helpful for further treatment decisions.
Low-grade gliomas (LGG) of grade II according to the classification of the World Health Organization (WHO) (1) are a heterogeneous group of diffusely infiltrating and slowly growing primary brain tumors. The 3 largest randomized trials (European Organisation for Research and Treatment of Cancer [EORTC] 22844, EORTC 22845, and the North Central Cancer Treatment Group trial) together studied more than 800 patients with LGG, and 58%–72% of patients were alive at 5 y from the time of diagnosis (2). In a significant number of patients, tumors progressing to a high-grade glioma (HGG; WHO grade III or IV) are associated with poor prognosis. A recent study demonstrated that in untreated patients with LGG (i.e., following the watch-and-wait strategy), malignant progression occurred in 56% within the follow-up period (median follow-up time, 7 y) (3). Furthermore, the time interval between diagnosis and malignant progression is unpredictable and highly variable (4). Retrospective studies show that in patients with LGG the median time to malignant progression varies considerably between 32 and 52 mo (5,6).
In many patients with LGG, information on tumor activity and malignant progression is obtained on the basis of clinical or regular contrast-enhanced MR imaging findings. Although it is the routine method of choice for follow-up of LGG patients, contrast-enhanced MR imaging appears to be insufficient in reliably detecting progression of LGG toward high-grade tumors: up to 45% of nonenhancing supratentorial gliomas are histologically corresponding to anaplastic gliomas (WHO grade III) whereas some MR-contrast-enhancing gliomas have been shown to be LGGs based on histologic criteria (7–10). Accordingly, there is a need for additional markers of malignant progression in LGG that ideally could noninvasively detect this clinically important phenomenon.
It has been reported that PET using L-[methyl-11C]methionine (11C-MET) may be helpful to detect glioma progression. An increase of the 11C-MET uptake ratio of more than 14.6% identifies progression, with a sensitivity of 90% and a specificity of 92%, respectively (11). Because of the short half-life of the 11C isotope (20 min), the use of 11C-MET, however, remains restricted to centers with an on-site cyclotron. Alternatively, amino acids labeled with 18F (half-life, 109 min) such as O-(2-18F-fluoroethyl)-l-tyrosine (18F-FET) may allow for a more widespread application (12–15).
Because several studies have indicated that 18F-FET kinetics allow for the distinction between HGG and LGG with high sensitivity and specificity (12,16,17), the evaluation of 18F-FET uptake kinetics may provide additional information for the identification of malignant progression in LGG patients. HGGs appear to be characterized by an early peak after injection, followed by a decrease of 18F-FET uptake. In contrast, steadily increasing time–activity curves without an identifiable peak of the tracer uptake seem to be typical for LGG (16). A recent study demonstrated that among patients with MR imaging–suspected LGG, especially, the kinetic analysis of 18F-FET uptake had a high sensitivity (95%) for the detection of HGG, even for lesions with low or diffuse tracer uptake (18).
Taken together, the purpose of this study was to investigate longitudinally the intraindividual changes of 18F-FET kinetics and uptake as a noninvasive indicator of malignant progression in LGG patients and to correlate changes of these 18F-FET imaging parameters with histology.
MATERIALS AND METHODS
Patients
Twenty-seven patients with histologically proven LGG (mean age [±SD] at the time of study inclusion, 44 ± 15 y; range, 11–64 y; 8 women and 19 men) who were consecutively referred to our institution from 2006 to 2011 participated in the study (Table 1). The study was approved by both the local ethics committee and the federal authorities, and all patients gave written informed consent before each 18F-FET PET investigation. Patients were investigated longitudinally twice using routine MR imaging and dynamic 18F-FET PET examinations. MR and PET imaging scans with corresponding histologic workup (resection or biopsy) were obtained at baseline (i.e., at the time of the initial diagnosis) and additionally at follow-up when contrast-enhanced MR imaging or clinical findings were suggestive of spontaneous progression to HGG. In detail, malignant progression was considered if a new contrast-enhancing lesion appeared or the lesion showed progression in size during follow-up according to the Macdonald criteria (19) (≥25% increase in sum of the products of perpendicular diameters of enhancing lesions; if nonenhancing lesions were present, a significant increase of T2/fluid-attenuated inversion recovery (FLAIR) signal, compared with baseline MR imaging scan, was considered suggestive of malignant progression) or new neurologic deficits or an exacerbation of existing neurologic symptoms occurred. Histologic workup at baseline and at follow-up was performed within 6 wk after 18F-FET PET imaging (median time, 14 d; mean time, 20 ± 13 d).
Patient Clinical Characteristics at Study Entry
PET Imaging with 18F-FET and Data Analysis
The amino acid 18F-FET was produced via nucleophilic 18F-fluorination with a specific radioactivity of greater than 200 GBq/μmol as described previously (15). The radiochemical yield of the tracer was about 60%–65% at a radiochemical purity greater than 98%. The tracer was administered in an isotonic neutral solution. According to the German guidelines for brain tumor imaging using labeled amino acid analogs, all patients remained fasting for at least 12 h before PET scanning (20). Dynamic PET studies were acquired up to 50 min after intravenous injection of approximately 200 MBq of 18F-FET on an ECAT EXACT HR+ scanner (Siemens Medical Systems, Inc.) in 3-dimensional mode (32 rings; axial field of view, 15.5 cm). The emission recording consisted of 16 time frames (time frames 1–5, 1 min; 6–10, 3 min; and 11–16, 5 min) covering the period up to 50 min after injection. For attenuation correction, transmission was measured with three 68Ge/68Ga rotating line sources. After correction for random and scattered coincidences and dead time, image data were obtained by filtered backprojection in Fourier space using the ECAT 7.2 software. The reconstructed image resolution was approximately 5.5 mm. 18F-FET uptake in the tissue was expressed as standardized uptake value (SUV) by dividing the radioactivity (kBq/mL) in the tissue by the radioactivity injected per gram of body weight.
18F-FET PET and contrast-enhanced MR imaging were coregistered using MPI tool software (MPI tool version 6.48; ATV). The fusion results were inspected and, if necessary, adapted using anatomic landmarks. The region-of-interest (ROI) analysis was based on the summed PET data from 20 to 40 min after injection (20). The transaxial slices showing the highest 18F-FET accumulation in the tumors were chosen for ROI analyses. 18F-FET uptake in the unaffected brain tissue was determined by a larger ROI placed on the contralateral hemisphere in an area of normal-appearing brain tissue including white and gray matter (20). 18F-FET uptake in the tumor was determined by a 2-dimensional autocontouring process using a tumor-to-brain ratio (TBR) of 1.6 or greater. This cutoff is based on a biopsy-controlled study in cerebral gliomas in which a lesion-to-brain ratio of 1.6 separated best tumoral from peritumoral tissue (21).
Mean and maximum TBR (TBRmean and TBRmax, respectively) were calculated by dividing the mean and maximum SUV of the tumor ROI by the mean SUV of normal brain in the 18F-FET PET scan. Time–activity curves of mean SUV in the tumor and in the brain were generated by application of these ROIs to the entire dynamic dataset. Time to peak (TTP; time in minutes from the beginning of the dynamic acquisition up to the maximum SUV of the lesion) was determined. Furthermore, as previously described (16), the time–activity curves of each lesion were assigned to one of the following curve patterns: constantly increasing 18F-FET uptake without identifiable peak uptake (pattern 1); 18F-FET uptake peaking at a midway point (>20–40 min), followed by a plateau or a small descent (pattern 2); and 18F-FET uptake peaking early (≤20 min), followed by a constant descent (pattern 3).
MR Imaging
All patients underwent routine MR imaging (1.5T Sonata or 3T Magnetom Trio MR; Siemens) with a standard head coil (T1, T2, and FLAIR sequence) at baseline (when an LGG was diagnosed) and during follow-up. Axial T1-weighted images were obtained from the second cervical vertebral body to the vertex. Additionally, after intravenous administration of contrast agent gadoteric acid (DOTAREM; Guerbet) (0.1 mmol/kg of body weight), axial T1-weighted images were obtained using standard procedures.
Statistical Analysis
Descriptive statistics are provided as mean and SD or as median and range. To compare the static and dynamic 18F-FET parameters before and after malignant progression, the Student paired t test was used. To compare 2 groups, the Student t test for independent samples was used. The Wilcoxon test was used when variables were not normally distributed.
The diagnostic performance of changes of TBRmax, TBRmean, and TTP between baseline and time point of suspected malignant progression to identify malignant progression was assessed by receiver-operating-characteristic (ROC) curve analyses using the histologic confirmation of malignant progression as reference. Decision cutoff was considered optimal when the product of paired values for sensitivity and specificity reached its maximum. In addition, the area under the ROC curve (AUC), its SE, level of significance, and both positive and negative predictive values (PPV and NPV, respectively) were determined as a measure of diagnostic quality of the test. The diagnostic performance of dichotomized variables such as the change of curve patterns and newly occurrence of contrast enhancement on MR imaging to detect malignant progression was evaluated by Fisher exact test for 2 × 2 contingency tables. The McNemar test was applied to compare the diagnostic performance of PET parameters and MR imaging to identify malignant progression. To identify influencing factors confounding the diagnostic accuracy of 18F-FET PET parameters to detect malignant progression, a multiple regression analysis was applied. P values of less than 0.05 were considered significant.
Statistical analysis was performed using SigmaPlot software (SigmaPlot version 11.0; Systat Software Inc.) and PASW Statistics software (release 21.0.0; SPSS Inc.).
RESULTS
Malignant Progression of Initial LGG
At initial diagnosis, LGG histologies were distributed as follows: WHO grade II astrocytoma (n = 18), WHO grade II oligoastrocytoma (n = 6), WHO grade II oligodendroglioma (n = 2), and WHO grade II ependymoma (n = 1) (Tables 1 and 2). At the time when clinical examination or routine MR imaging follow-up suggested spontaneous malignant progression, an HGG was confirmed histologically in 18 of 27 patients—that is, in this patient group the prevalence of malignant progression was 67% (Tables 1 and 2). After malignant progression, tumor histologies were distributed as follows: WHO grade III anaplastic astrocytoma (n = 8), WHO grade III anaplastic oligoastrocytoma (n = 4), WHO grade III anaplastic oligodendroglioma (n = 1), WHO grade III anaplastic ependymoma (n = 1), and WHO grade IV (secondary) glioblastoma (n = 4) (Tables 1 and 2). Fourteen tumors progressed from WHO grade II to WHO grade III and 4 tumors from WHO grade II to WHO grade IV. The median time to malignant progression was 21 mo (range, 4–106 mo). In 9 cases, the histologic workup did not confirm malignant transformation (i.e., revealed LGGs of WHO grade II; distribution of LGG histologies, WHO grade II astrocytoma [n = 4] and WHO grade II oligoastrocytoma [n = 5]) (Tables 1 and 2). In these patients, the median time between the 18F-FET PET scans was 19 mo (range, 4–61 mo).
Results of Static and Kinetic 18F-FET PET Parameter of Patients With and Without Malignant Progression
18F-FET Uptake and Kinetics at Baseline
18F-FET uptake was significantly lower in LGG patients with malignant progression than in those without progression (TBRmax at baseline, 2.4 ± 1.0 vs. 3.5 ± 1.2, P = 0.02; TBRmean at baseline, 1.6 ± 0.6 vs. 2.1 ± 0.5, P = 0.04) (Table 2). In contrast to the uptake indices at baseline, there were no significant differences of TTP values between patients with and without malignant progression (TTP at baseline, 32 ± 12 vs. 29 ± 10 min; P = 0.34) (Table 2). Furthermore, in both groups the kinetic patterns were not significantly different (P = 0.24).
Change of 18F-FET Uptake in LGG Patients with Malignant Progression
In patients with histologically proven malignant progression (n = 18), both TBRmax and TBRmean increased significantly, compared with baseline (TBRmax, 3.8 ± 1.0 vs. 2.4 ± 1.0; TBRmean, 2.2 ± 0.3 vs. 1.6 ± 0.6; both P < 0.001). In contrast, in patients who had no change of histologic grade at clinically or radiologically suspected malignant progression (n = 9), both TBRmax and TBRmean did not change significantly, compared with baseline (TBRmax, 3.4 ± 1.3 vs. 3.5 ± 1.2, P = 0.74; TBRmean, 2.1 ± 0.6 vs. 2.1 ± 0.5, P = 0.84). ROC analysis yielded an increase of the TBRmax of more than 33% as an optimal cutoff to identify tumors with progression to HGGs (sensitivity, 72%; specificity, 89%; accuracy, 78%; AUC, 0.87 ± 0.07; P = 0.002). The PPV was 93%, the NPV 62% (Table 3). The corresponding cutoff for the TBRmean to identify malignant progression was an increase of more than 13% (sensitivity,72%; specificity, 78%; accuracy, 74%; AUC, 0.80 ± 0.09; P = 0.014). The PPV was 87%, the NPV 58% (Table 3).
Results of Diagnostic Performance of 18F-FET PET Parameters to Identify Malignant Progression
Change of 18F-FET Kinetics in LGG Patients with Malignant Progression
In patients with histologically proven malignant progression of their initial LGGs (n = 18), the TTP decreased significantly, compared with baseline (TPP, 21 ± 8 vs. 32 ± 12 min; P < 0.001) (Table 2). In contrast, in patients who had no change of histologic grade at suspected malignant progression (n = 9), the TTP did not change significantly, compared with baseline (TTP, 29 ± 13 vs. 29 ± 10 min; P = 0.95) (Table 2). ROC analysis identified a reduction of the TTP of more than 6 min as an optimal cutoff to identify malignant progression (sensitivity, 72%; specificity, 89%; accuracy, 78%; AUC, 0.78 ± 0.10; P = 0.021). The PPV was 93%, the NPV 62% (Table 3).
Furthermore, in patients with malignant progression the time–activity curve pattern changed in 10 of 18 patients with malignant progression from curve pattern 1 to 2 or 3 (P < 0.001) (Table 2; Fig. 1) whereas in patients without malignant progression (n = 9) no significant change of the time–activity curve pattern was observed (P = 1.0) (Table 2; Fig. 2). Diagnostic performance analysis showed that any increase of the kinetic pattern identified malignant progression with a sensitivity of 72%, a specificity of 89%, and an accuracy of 78% (P = 0.004). The PPV was 93%, the NPV 62% (Table 3).
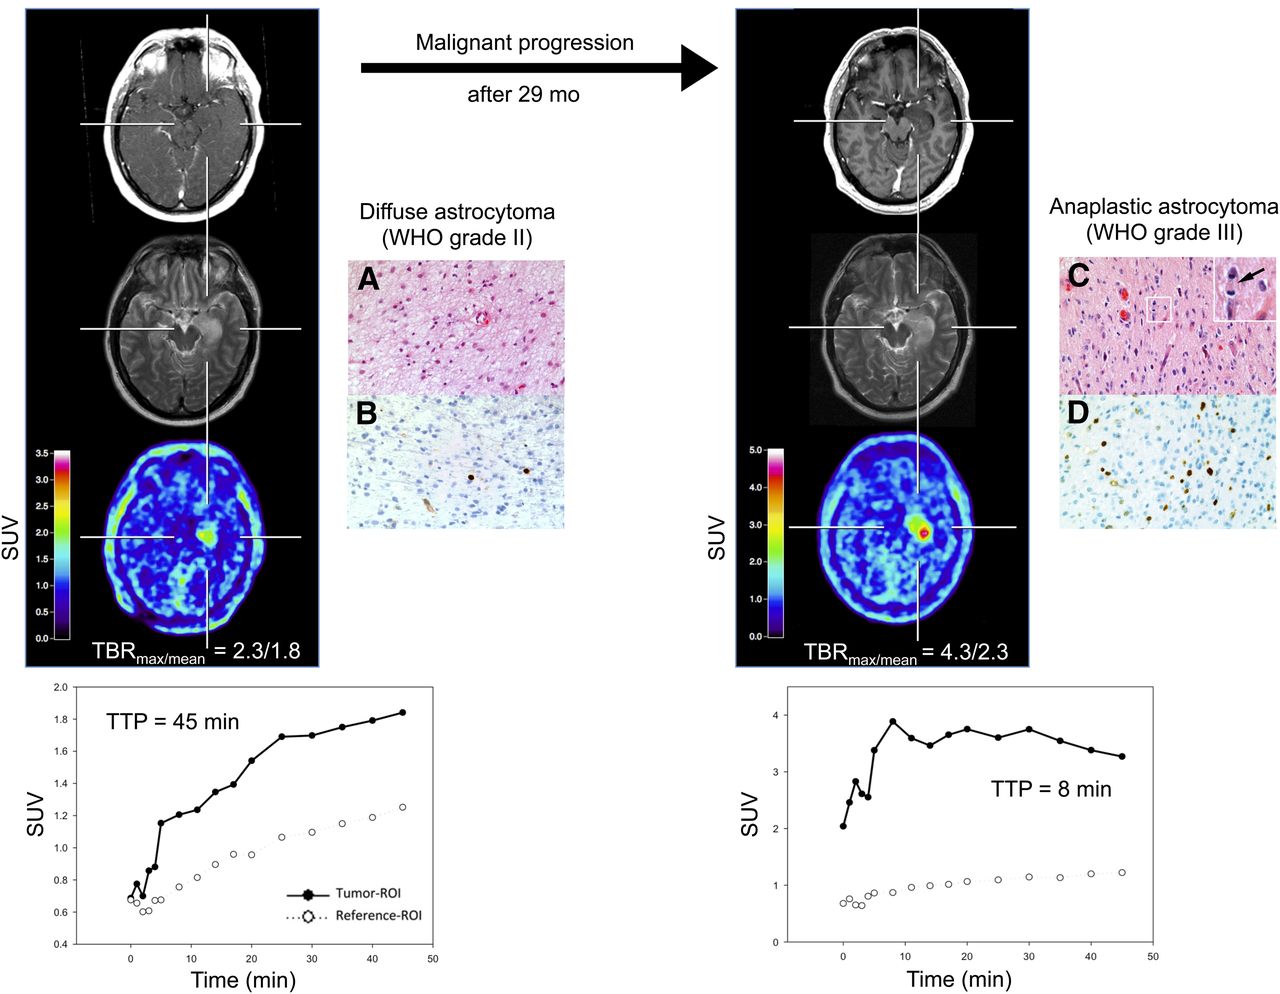
18F-FET PET and MR imaging of 47-y-old man (patient 12) with newly diagnosed WHO grade II diffuse astrocytoma with slightly increased 18F-FET uptake (TBRmax, 2.3; TBRmean, 1.8), without contrast enhancement and hyperintensity in right temporal lobe on T2-weighted image (left). Time–activity curve shows constantly increasing 18F-FET uptake until end of acquisition; TTP is 45 min (kinetic pattern 1) (bottom left). Hematoxylin and eosin staining shows moderately cellular diffuse astrocytoma of WHO grade II (A). MIB-1 immunostaining indicates low proliferative activity of only individual tumor cells (B). Twenty-nine months later, patient presented with malignant progression to WHO grade III astrocytoma associated with significant increase in 18F-FET uptake (TBRmax, 4.3; TBRmean, 2.3), with slight contrast enhancement and enlargement of hyperintensity on T2-weighted image (right). Dynamic evaluation of 18F-FET uptake shows early peak of 18F-FET uptake after 8 min, followed by constant decline of uptake until end of acquisition (kinetic pattern 3) (bottom right). Histology (hematoxylin and eosin staining) now shows diffusely infiltrating anaplastic astrocytoma of WHO grade III with increased cellularity, cellular atypia, and mitotic activity (insert in upper right corner; arrow points to metaphase) (C). MIB-1 immunostaining shows increased proliferative activity (D). Original microscopic magnifications of histologic and immunhistochemical pictures are ×400. Immunostainings are counterstained with hemalum.

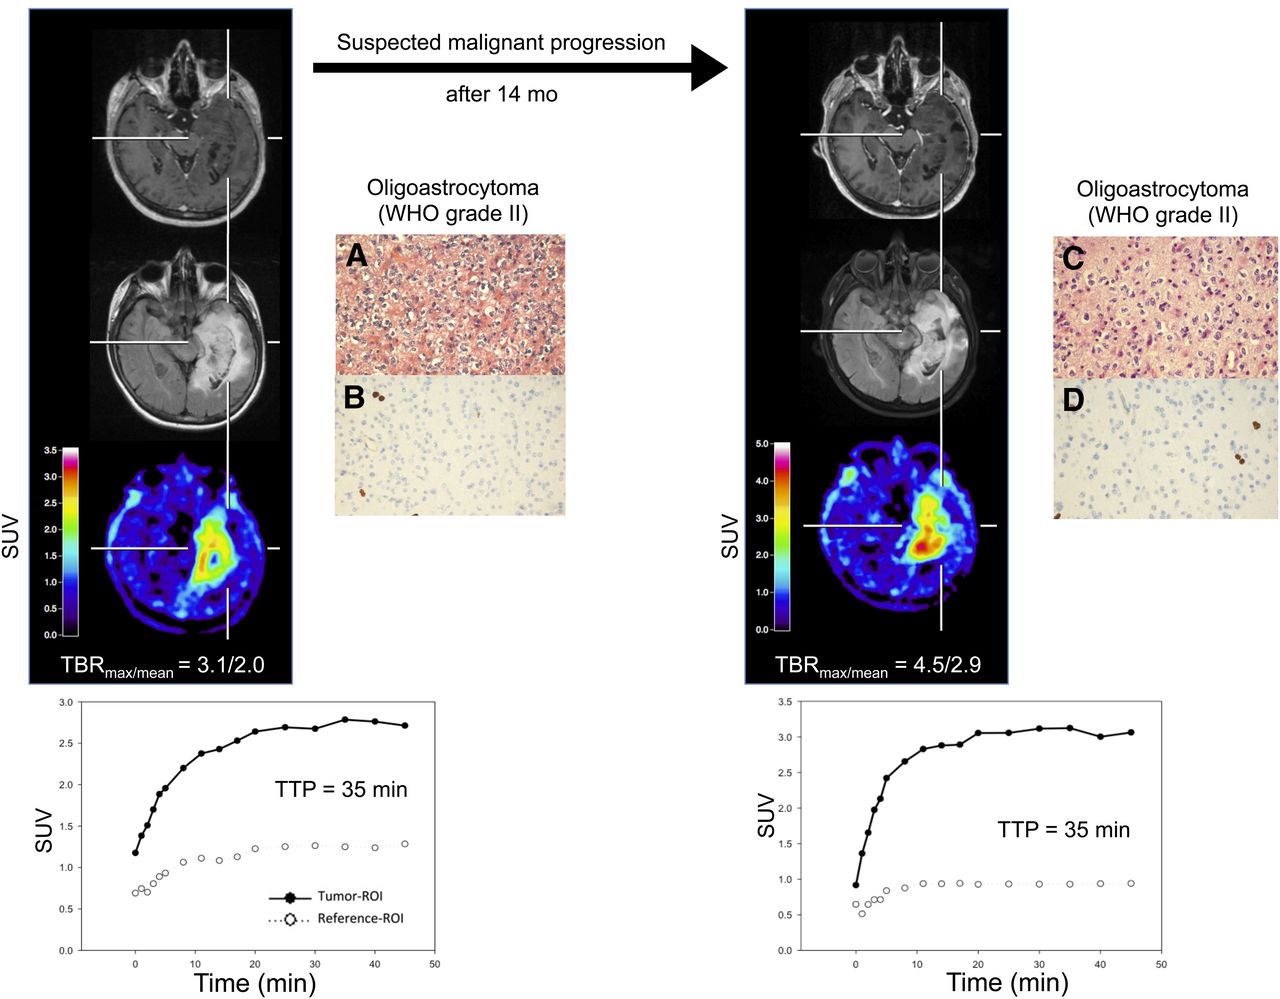
18F-FET PET and MR imaging of 62-y-old woman (patient 26) with newly diagnosed WHO grade II oligoastrocytoma with clearly increased 18F-FET uptake (TBRmax, 3.1; TBRmean, 2.0), without contrast enhancement and large hyperintensity in right temporal lobe on FLAIR-weighted image (left). Time–activity curve shows peak of 18F-FET uptake after 35 min, followed by slow descent (kinetic pattern 2) (bottom left). Histology (hematoxylin and eosin staining) reveals moderately cellular, diffusely infiltrating glioma corresponding to oligoastrocytoma of WHO grade II (A). Tumor shows low proliferative activity as determined by MIB-1 immunostaining (B). Fourteen months later, malignant progression was suspected; imaging findings are consistent with significant increase of 18F-FET uptake (TBRmax, 4.5; TBRmean, 2.9) and enlargement of hyperintensity on FLAIR-weighted image without contrast enhancement (right). Compared with baseline imaging, dynamic evaluation of 18F-FET uptake shows no relevant changes (kinetic pattern 2) (bottom right). Histologic examination after stereotactic biopsy again shows WHO grade II oligoastrocytoma (C) with only low fraction of MIB-1–positive tumor cells (D). Original microscopic magnifications of histologic and immunhistochemical pictures are ×400. Immunostainings are counterstained with hemalum.
Combined Analysis of PET Parameters
Malignant progression was assumed if any of the following PET parameters was positive: increase of TBRmax more than 33%; or decrease of TTP more than 6 min; or any increase of the rating of the kinetic pattern. The combined analysis of PET parameters identified malignant progression with a sensitivity of 83%, a specificity of 78%, and an accuracy of 81% (P = 0.004). The PPV was 88%, the NPV 70% (Table 3).
Multiple Regression Analysis
To evaluate the influence of confounding factors on the 18F-FET PET results, we performed a multiple linear regression analysis using malignant progression as the dependent variable and the presence of an oligodendroglial component, initial resection (instead of biopsy), TBRmax of 18F-FET uptake at baseline, and changes of 18F-FET PET parameters (combined analysis) as independent variables. In that analysis, changes of 18F-FET parameters turned out to be an independent factor regarding the detection of malignant progression (P = 0.013) whereas none of the other factors showed a significant influence.
MR Imaging Findings in LGG Patients with Malignant Progression
Changes of contrast enhancement in relation to the presence of a histologically proven malignant progression are shown in Table 4. New occurrence of contrast enhancement on MR imaging at the time point of suspected malignant progression identified malignant progression with a sensitivity of 44%, a specificity of 100%, and an accuracy of 63%. The PPV was 100%, the NPV 47% (Table 3). Finally, we compared the diagnostic performance of contrast-enhanced MR imaging with that of 18F-FET PET parameters to identify malignant progression using the McNemar test. In this analysis, new contrast enhancement in MR imaging in a previously nonenhancing LGG was rated as a positive result and no enhancement in a previously nonenhancing LGG as a negative result. Contrast enhancement at baseline and at follow-up was rated as equivocal. For 18F-FET PET, any change of imaging parameters (combined analysis) was rated as positive and no change as negative. The test yielded a significantly higher diagnostic accuracy of 18F-FET PET to identify malignant progression than MR imaging (P = 0.003).
Changes of Contrast Enhancement in Relation to Histologically Proven Malignant Progression
DISCUSSION
The findings of our study suggest that for the noninvasive detection of spontaneous malignant tumor progression in patients with LGG, 18F-FET PET provides valuable diagnostic information with higher diagnostic accuracy than that of conventional MR imaging. Thus, in patients with LGG the additional information that can be derived from static and dynamic 18F-FET PET parameters on tumor activity and malignant progression is of great clinical interest, especially when a conclusive answer cannot be obtained on the basis of clinical assessment or conventional MR imaging alone. In daily practice, the presence of contrast enhancement is frequently used to separate HGGs from LGGs (10). Our findings converge with this notion because we observed that the occurrence of contrast enhancement on MR imaging in a previously nonenhancing LGG predicted malignant progression with a specificity of 100%. Importantly, however, this finding occurred in only 8 of 18 patients with spontaneous malignant progression, resulting in a sensitivity of only 44%. Furthermore, in 15 of 27 patients, contrast-enhanced MR imaging was not helpful because the tumor showed already contrast enhancement at the time of the initial diagnosis (n = 12) or no change of contrast enhancement at the time of malignant progression (n = 3). Thus, our results strongly suggest that the use of conventional MR imaging has limited value to detect malignant progression.
Using 18F-FET PET, we observed a significantly higher diagnostic performance to detect malignant progression than the use of contrast-enhanced MR imaging (P = 0.003). Imaging parameters derived from 18F-FET PET, both static (e.g., TBRmax) and dynamic (TTP, curve pattern), exhibited a high diagnostic accuracy (range, 78%–81%) to identify this phenomenon. This additional information derived from 18F-FET PET may be of great value, especially when clinical or MR imaging findings are ambiguous. An early detection of malignant progression is of high clinical importance, not only in terms of prognosis but also because the decision to initiate a specific treatment depends mainly on the WHO grade.
With respect to the fact that contrast enhancement on MR imaging in a previously nonenhancing LGG predicts malignant progression with a specificity of 100%, 18F-FET PET is not necessary in every situation. Baseline 18F-FET PET is recommended in all patients with LGG. In the case of suspected progression, follow-up 18F-FET PET imaging may detect malignant progression in nonenhancing LGGs if no new contrast enhancement occurs in MR imaging and also in contrast-enhancing LGGs because MR imaging changes are frequently equivocal. A second PET scan, however, may be avoided if new contrast enhancement occurs in a previously nonenhancing LGG.
Recently, it was suggested that the change of 11C-MET uptake of more than 14.6% (as assessed with TBRs) between baseline and follow-up 11C-MET PET scanning has the highest diagnostic accuracy to detect malignant progression (sensitivity and specificity of 90% and 92%, respectively) (11). In line with this finding, in our study the changes of 18F-FET uptake as assessed using TBRs showed a similar specificity but lower sensitivity. However, the findings of the 2 studies are not directly comparable because the study by Ullrich et al. included patients with primary anaplastic gliomas of WHO grade III. Furthermore, technical differences such as, for example, ROI definition, may account for the slightly divergent findings mentioned. Additionally, the differential kinetics of tracer uptake in HGGs and LGGs appear to be a special property of 18F-FET PET because this was not observed with 11C-MET PET (22).
In addition to the high diagnostic accuracy of the TBR changes of 18F-FET uptake, we observed in the present study for the first time, to our knowledge, in patients with LGG intraindividual changes of kinetic parameters during malignant progression. Although various previous studies convene in suggesting that 18F-FET kinetics may allow for the distinction between HGGs and LGGs with high sensitivity and specificity (12,16–18,23,24), to date the issue remains controversial. In untreated patients with suspected LGG on MR imaging, the kinetic analysis reliably identified HGG from LGG with a sensitivity of 95% and a specificity of 72% (18). In contrast, in other studies with untreated and pretreated patients with LGG and HGG, dynamic 18F-FET PET studies yielded both similar high sensitivities but clearly higher specificities of even more than 90% for the differentiation between LGGs and HGGs (16,17,23). Despite these discrepancies regarding diagnostic accuracy, dynamic 18F-FET imaging appears to be a sensitive tool to evaluate the metabolic properties of an individual tumor in the course of the disease and to detect malignant progression with higher sensitivity than contrast-enhanced MR imaging.
Interestingly, in our study the typical kinetic pattern in patients with LGG—that is, constantly increasing 18F-FET uptake without identifiable peak uptake (kinetic pattern 1)—was not observed in each and every case. Especially in the patient with an ependymoma of WHO grade II and predominantly in patients with LGGs with an oligodendroglial component (i.e., oligoastrocytoma, oligodendroglioma), both a kinetic pattern 2 or 3 and an earlier TTP were observed. These findings are consistent with previous results for LGG patients with oligodendroglial tumors (18). Furthermore, the comparison of patients with and without malignant progression of these tumors revealed that at baseline patients without malignant progression had significantly higher uptake values than patients who experienced malignant progression during the course of the disease. This finding may be related to the fact that tumors with an oligodendroglial component exhibit higher uptake values than astrocytomas (25). We observed a significant correlation between baseline TBRmax of 18F-FET uptake and the occurrence of a tumor with an oligodendroglial component, but multiple linear regression analysis demonstrated that the diagnostic value of 18F-FET PET to diagnose malignant progression in LGG was not influenced by these factors.
A putative weakness of our study is the relatively low number of investigated patients, especially in the group of LGG patients whose tumors did not show malignant progression. Therefore, our results need to be treated with caution and would benefit from confirmation in a larger series of patients. On the other hand, LGGs are rare tumors (26) and the results of this study are promising, thus we recommend the use 18F-FET PET as a routine tool in monitoring of patients with LGG, especially when the diagnostic information derived from standard MR imaging is equivocal.
CONCLUSION
Data suggest that both standard and kinetic imaging parameters derived from 18F-FET PET detect noninvasively malignant progression of gliomas in LGG patients with high diagnostic accuracy. Thus, repeated 18F-FET PET may provide valuable diagnostic information and be helpful for further treatment decisions.
DISCLOSURE
The costs of publication of this article were defrayed in part by the payment of page charges. Therefore, and solely to indicate this fact, this article is hereby marked “advertisement” in accordance with 18 USC section 1734. The Brain Imaging Center West supported this work. This work was also supported by grants from the Deutsche Krebshilfe (grant no. 108960) and the German Federal Ministry of Education and Research (grant no. 01GS0884). No other potential conflict of interest relevant to this article was reported.
Acknowledgments
The authors thank Suzanne Schaden, Elisabeth Theelen, and Kornelia Frey for assistance in the patient studies as well as Johannes Ermert, Silke Grafmüller, Erika Wabbals, and Sascha Rehbein for radiosynthesis of 18F-FET.
Footnotes
Published online Oct. 24, 2013.
- © 2013 by the Society of Nuclear Medicine and Molecular Imaging, Inc.
REFERENCES
- Received for publication March 27, 2013.
- Accepted for publication July 1, 2013.


Jump to section
Related Articles
Cited By...
- Serial 18F-FET PET Imaging of Primarily 18F-FET-Negative Glioma: Does It Make Sense?
- Late Pseudoprogression in Glioblastoma: Diagnostic Value of Dynamic O-(2-[18F]fluoroethyl)-L-Tyrosine PET
- Urokinase-Type Plasminogen Activator Receptor as a Potential PET Biomarker in Glioblastoma
- Biological tumor volume in 18FET-PET before radiochemotherapy correlates with survival in GBM
- The Usefulness of Dynamic O-(2-18F-Fluoroethyl)-L-Tyrosine PET in the Clinical Evaluation of Brain Tumors in Children and Adolescents
- Prognostic Significance of Dynamic 18F-FET PET in Newly Diagnosed Astrocytic High-Grade Glioma
- Prediction of Glioma Recurrence Using Dynamic 18F-Fluoroethyltyrosine PET
- Clinical Impact of Amino Acid PET in Gliomas
- PET/MR Imaging: A Critical Appraisal