


Abstract
In vivo imaging of adenosine 2A receptors (A2A) in the brain has attracted significant interest from the scientific community, because studies have shown that dysregulation of these receptors is implicated in a variety of neurodegenerative and psychiatric disorders, including Parkinson and Huntington diseases. This work aimed to describe the kinetic properties, test–retest results, and dosimetry estimates of 123I-MNI-420, a SPECT radiotracer for the in vivo imaging of A2A in the brain. Methods: Nine healthy human subjects were enrolled in this study; 7 completed 123I-MNI-420 brain SPECT studies, and 2 participated in whole-body planar imaging evaluating 123I-MNI-420 biodistribution and dosimetry. For 3 of the brain SPECT studies, arterial blood was collected for invasive modeling. Noninvasive models were also explored, including Logan graphical analysis and simplified reference tissue models. Test–retest reliability was assessed in 4 subjects. To evaluate radiotracer biodistribution and dosimetry, serial whole-body images were acquired immediately after injection and at selected time points after injection. Urine samples were collected over a period of 21 h to calculate urinary excretion. Results: 123I-MNI-420 rapidly entered the human brain and displayed uptake consistent with known A2A densities. At pseudoequilibrium (reached at 90 min after radiotracer injection), stable target-to-cerebellum ratios of around 1.4–2.0 were determined. Binding potentials around 0.8–1.2 were estimated using different kinetic models and the cerebellum as the reference region. Average test–retest variability in the striatum was 4.8%, 3.5%, and 6.5% for the simplified reference tissue model, Logan graphical analysis, and standardized uptake value ratio methods, respectively. The estimated radiation effective dose determined from whole-body studies was 0.036 mSv/MBq. Conclusion: The data indicate that 123I-MNI-420 is a useful SPECT radiotracer for imaging A2A in the brain and has radiation doses that would allow for multiple scans in the same research subject each year. The availability of 123I-MNI-420 offers the possibility of investigating A2A activity in specific conditions and evaluating drug occupancy for A2A candidate therapeutics.
The physiologic action of extracellular adenosine, a neuromodulator synthesized via conversion of extracellular adenine nucleotides, occurs by interaction with 4 different G-protein–coupled receptors: A1, A2A, A2B, and A3 (1–4). The pharmacology and brain distribution of A1 and A2A have been extensively investigated. A1 is widely distributed in the human brain, including the hippocampus, cortex, thalamus, globus pallidus, and cerebellum (3,5); conversely, A2A is more selectively distributed in the striatum, nucleus accumbens, and olfactory tubercule. Lower levels of A2A are present in the hippocampus and cortex (1–5).
A2A has attracted significant interest from the scientific community, in particular as a novel therapeutic target in neurodegenerative disorders including Parkinson and Huntington diseases. Multiple studies have demonstrated the coexpression of A2A and D2 dopaminergic receptors in basal ganglia neurons that are important in movement control (1,6). Furthermore, adenosine has also been implicated in neurodegeneration, and A2A antagonists have been shown to be neuroprotective agents in experimental models of Parkinson disease (7). Dysregulation of A2A function is also associated with psychiatric diseases, including mood disorders, panic disorders, schizophrenia, attention deficit hyperactivity disorder, depression, and addiction (4,6,8–9). Thus, in vivo imaging of A2A using SPECT or PET would enable studies investigating disease progression and treatment response in different psychiatric and neurodegenerative disorders. Furthermore, an A2A selective radiotracer would also be valuable in imaging studies evaluating therapeutics targeting A2A, such as drug occupancy studies, thereby providing a useful tool for the drug discovery process.
A variety of PET radiotracers have been developed over the years for imaging A2A in the brain (1–4,10–11), and recently our group has reported the development of a new SPECT radiotracer, 123I-MNI-420, to image brain A2A. Preliminary evaluation of 123I-MNI-420 in nonhuman primates showed binding in brain regions with an expected high density of A2A, and tracer uptake was blocked by the selective A2A antagonist preladenant in a dose-dependent manner (12), stimulating the development of this radiotracer for human use. This report describes the pharmacokinetic properties of 123I-MNI-420 in the human brain, including kinetic modeling analyses and test–retest results. In addition, it also reports the whole-body dosimetry results obtained in healthy human volunteers after intravenous injection of 123I-MNI-420.
MATERIALS AND METHODS
Radiotracer Preparation and Injection
123I-MNI-420 was prepared as described previously (12). The radiotracer’s specific activity was greater than 7.4 TBq/μmol (200 Ci/μmol), the injected mass dose was lower than 1 μg, and the radiochemical purity was greater than 90%. The mean administered activity was 175.2 ± 7.1 MBq (range, 161–187 MBq). There were no adverse or clinically detectable pharmacologic effects in any of the 9 subjects. No significant changes in vital signs, laboratory results, or electrocardiograms were observed.
Subjects and Study Design
The study protocol was reviewed and approved by the New England Institutional Review Board. All subjects gave their written informed consent before participation in this study.
Nine healthy volunteers (based on medical history and physical examination) (4 men and 5 women, mean age of 43.4 y [range, 20–63 y]) participated in the present study. None of them had a known clinical history that could have affected the biodistribution or elimination of the radiotracer. Seven of those healthy volunteers (3 men and 4 women; mean age ± SD, 41.43 ± 18.8 y; range, 20–63 y) completed 123I-MNI-420 brain SPECT. Arterial blood was collected for 3 of those 7 subjects for kinetic modeling. Test–retest SPECT scans were obtained in 4 subjects, with an interval of 2–4 wk between imaging sessions. Two subjects (1 man, age 57 y, and 1 woman, age 44 y) participated in the whole-body imaging study of 123I-MNI-420. Thyroid uptake was blocked with Lugol solution for all volunteers (5% iodine and 10% potassium iodide, 10 drops ≈30 min before radiotracer injection). All subjects were required to refrain from drinking caffeinated beverages, such as coffee, tea, and chocolate, for up to 12 h before the imaging session, because caffeine is a known nonselective A2A antagonist.
Brain Studies
SPECT Acquisition and Image Reconstruction
SPECT studies were performed using a 3-head camera (Picker PRISM 3000 XP; Philips Healthcare) equipped with low-energy high-resolution fanbeam collimators. Data acquisition started immediately after radiotracer injection as consecutive dynamic SPECT scans. Total scan time was 4 h, with 3 dynamic phases: phase 1, sequential images every 10 min for 60 min, followed by a 30-min break; phase 2, sequential images every 20 min for 60 min, followed by a 30-min break; and phase 3, sequential images every 20 min for 60 min. An energy window of 15% centered at 159 keV and continuous acquisition mode were used on all 3 phases. Acquisitions were obtained using a 128 × 128 matrix and a zoom of 1. Raw SPECT data were reconstructed using the ordered-subset maximum-likelihood expectation maximization method and a low-pass postprocessing filter (order, 5; cutoff, 0.24).
Blood Analysis
Arterial blood samples (1 mL) were obtained from the ulnar or radial arteries at selected time points after radiotracer injection (15 s, 30 s, 45 s, 60 s, 75 s, 90 s, 105 s, 120 s, 135 s, 150 s, 4 min, 8 min, 15 min, 20 min, and 50 min). Additional samples (5 mL) at 3, 6, 10, 30, 80, 120, 150, and 200 min after injection were also collected for metabolite analysis. All samples were collected into ethylenediaminetetraacetic acid–coated tubes and radioactivity in whole blood and plasma assessed using a well-type γ-counter with a 22- to 190-keV window (2480; Perkin Elmer Wallac). Plasma samples were processed by acetonitrile denaturation and analyzed by high-performance liquid chromatography on a Waters Nova-Pak C18 column with a mobile phase consisting of MeOH/H2O-Et3N (0.8%) 80/20 at a flow rate of 1.0 mL/min to estimate the parent fraction. The free protein binding fraction was determined using ultrafiltration units (Amicon Centrifree 30; Millipore). Arterial plasma curves were corrected for metabolites.
Image Processing
Reconstructed scans were imported into PMOD 3.203 software (PMOD Technologies), merged into a single file for image processing, and decay-corrected. Motion correction was performed by creating an average image of consecutive scans with absence of motion, which was then used as a reference for rigid matching of all scans in the study. Attenuation correction was performed by applying the Chang algorithm (attenuation coefficient, 0.011 mm−1) to a semiautomatically drawn ellipse around the brain (13). The images were subsequently scaled using the SPECT camera cross-calibration factor (details on the cross-calibration procedure are presented in the supplemental data file available at http://jnm.snmjournals.org).
Average images of 123I-MNI-420 SPECT data, generated by averaging the scans presenting the highest uptake in cortical and subcortical brain structures, were normalized to an Montreal Neurological Institute SPECT template. The transformation matrix was saved and subsequently applied to the merged 123I-MNI-420 dynamic scans. Finally, a modified anatomic automatic labeling volume-of-interest template, as described elsewhere (14), was applied to normalized 123I-MNI-420 SPECT images. The following brain regions were included in the analysis: caudate, putamen, striatum, frontal cortex, parietal cortex, temporal cortex, occipital cortex, and cerebellum.
Data Analysis
Time–activity curves were generated, where radioactivity concentration was expressed as kilobecquerels per unit of tissue volume. Standardized uptake values (SUVs) were calculated as radioactivity concentration in the volume of interest divided by injected dose (ID) divided by the subject weight. Subsequently, striatal and cortical SUVs were divided by SUVs determined in the cerebellum to yield SUV ratios (SUVr), with the cerebellum being the brain region with the lowest concentration of A2A.
Kinetic analysis was performed in PMOD using an invasive 1- or 2-tissue-compartment (2T) model. Noninvasive reference tissue methods, such as the simplified reference tissue model (SRTM) and Logan noninvasive graphical model, were also investigated (15–17). The cerebellum was used as the reference region for data quantification. Model fitting performance was evaluated using the Akaike information criterion (AIC) and model selection criterion (MSC), where the preferred model had the lowest Akaike information criterion and highest MSC. The selected identifiability criterion was the percentage SE of VT (total volume of distribution) estimates.
The binding potential, BPND, defined at equilibrium as the ratio of specifically bound to nondisplaceable radiotracer uptake in tissue (15), was calculated indirectly as (VT – VND)/VND, where VND (the nondisplaceable volume of distribution) was derived from the VT of the reference region. BPND values were also determined directly from SUVr curves at pseudoequilibrium as BPND = SUVr − 1 (averaged between 90 and 150 min after injection) and from kinetic modeling using noninvasive methods.
Study results are expressed as mean ± SD. Test–retest variability in the striatum was calculated as the absolute values of the difference between test and retest, divided by the mean of test and retest values, expressed as a percentage.
Dosimetry Studies
Whole-Body Planar Imaging
The subjects lay supine in a dual-head large field-of-view γ-camera (Picker AXIS; Philips Healthcare) for sequential anterior and posterior whole-body scans. A low-energy high-resolution collimator and an energy window of 15% centered at 159 keV were used on all images acquired. Acquisitions were obtained using a 256 × 1,024 matrix and a zoom of 1. Images were acquired immediately after radiotracer injection and at 1, 2, 3, 4, 5, 6, 7, and 21 h after injection, with a scan speed of 11 cm/min. The percentage ID (%ID) for each time point was calculated by cross-calibration between the radioactive source placed alongside the subject’s distal portion of the leg and the dose calibrator value.
Urine was collected for up to 21 h to measure the fraction of activity voided by the renal system. Activity not excreted in urine was assumed to be eliminated in feces. Radioactivity in urine was measured using a well-type γ-counter (2480; Perkin Elmer Wallac) and a 22- to 190-keV window.
Data Analysis and OLINDA Estimations
For each subject, regions of interest (ROIs) were drawn in organs that displayed higher radioactivity concentration than background—that is, source organs. The set of ROIs delineated in the anterior projection was applied to all images and, if needed, corrected for differences in subject position at different acquisition time points. Finally, ROIs were mirrored on their long axis for the posterior projection images. ROI shapes and sizes were kept constant for each emission image. The following organs were identified as source organs: brain, heart, liver, gallbladder, intestine, urinary bladder, lungs, and spleen. Whole-body ROIs were drawn around the subject’s body and were used for quantification of whole-body remainder activity as whole-body activity minus source organ activity.
The residence time τ, defined as the ratio of accumulated activity in the target organ (Ā) and injected activity (A0), τ = Ā/A0, was calculated as the area under the curve of the tissue time–activity curve normalized to %ID from time zero to infinity. The trapezoidal method was used for estimating τ, and after the last measured time point it was assumed that the radiotracer underwent only physical decay with no biologic elimination from the source organ. The calculated τ was entered into OLINDA/EXM 1.0 software (18), which was used to estimate organ doses and effective doses according to the male or female model implemented in OLINDA/EXM 1.0. Residence times for the small intestine and the upper and lower large intestines were estimated using the gastrointestinal model of the International Commission on Radiological Protection, publication 30 (19), as incorporated in OLINDA/EXM 1.0 (18). This model assumes that a fraction of injected activity enters the small intestine with no reabsorption. The fraction of injected activity entering the small intestine was estimated as the highest fraction encountered in the intestinal area within the whole-body scans.
RESULTS
Brain Studies
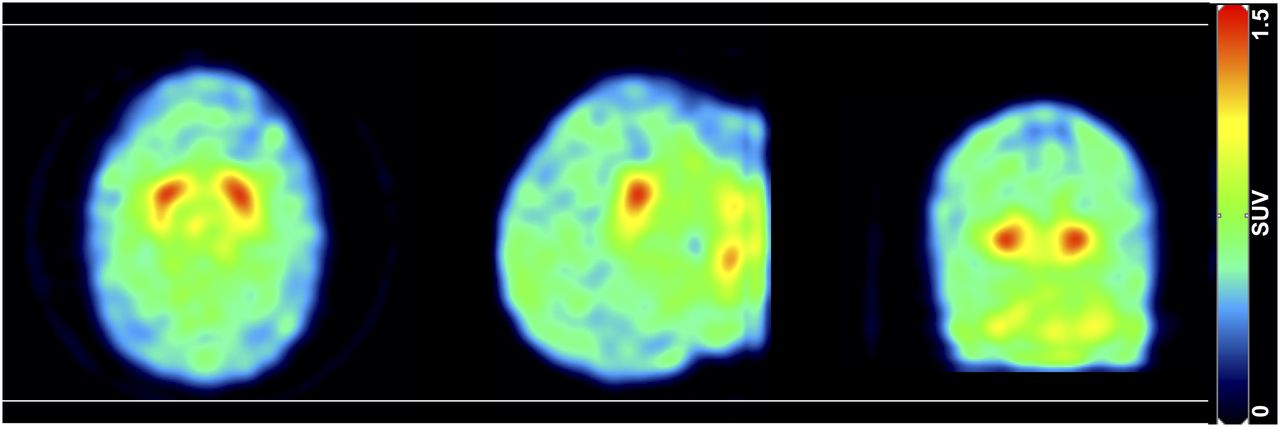
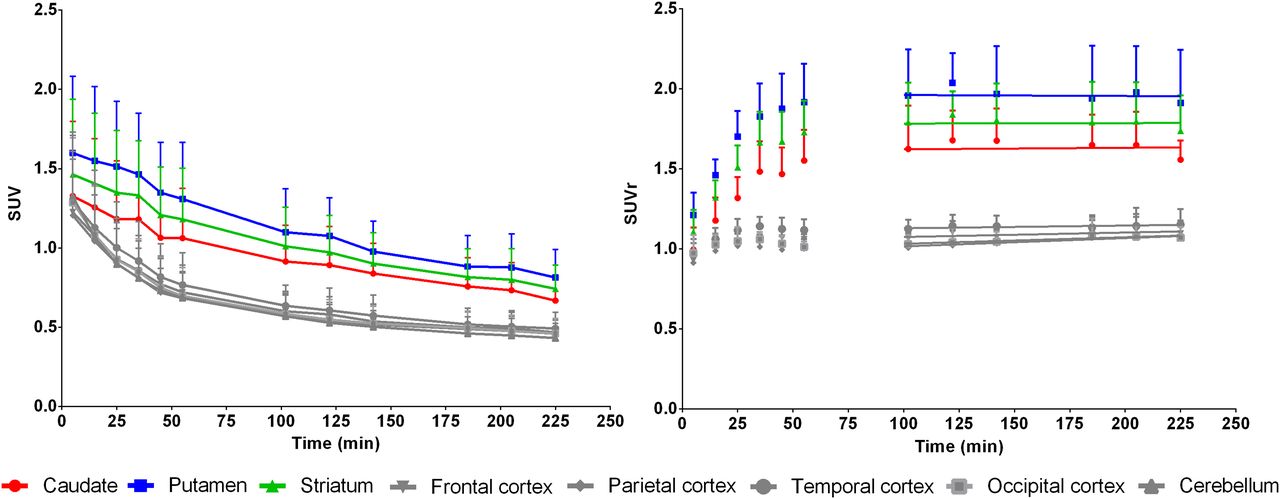
123I-MNI-420 rapidly entered the human brain, where the whole brain uptake peaked at 10 min after injection. Marked accumulation was found in the caudate and putamen, regions known to have high densities of A2A. Conversely, low levels of radioactivity were found in the cortical areas and cerebellum (Figs. 1 and 2). Caudate, putamen, and striatum SUVr time curves progressively increased until around 90 min after injection and then stabilized until the end of the imaging session. The pseudoequilibrium, demonstrated by curve slope values close to zero (average slope of −0.03 ± 0.09, 0.01 ± 0.09, and −0.03 ± 0.11 h−1 for the caudate, putamen and striatum, respectively, values reported as mean ± SD, n = 7), was reached 90 min after radiotracer injection.

Representative SPECT SUV sum image (0–240 min) of 123I-MNI-420 distribution in human brain. Transverse, sagittal, and coronal planes (left to right).

(Left) Decay-corrected mean SUV time–activity curves in different brain regions. (Right) Mean SUVrs over time in selected brain regions. Cerebellum was used as reference region. Results plotted as mean ± SD (n = 7). SUVrs reached pseudoequilibrium around 90 min after radiotracer injection.
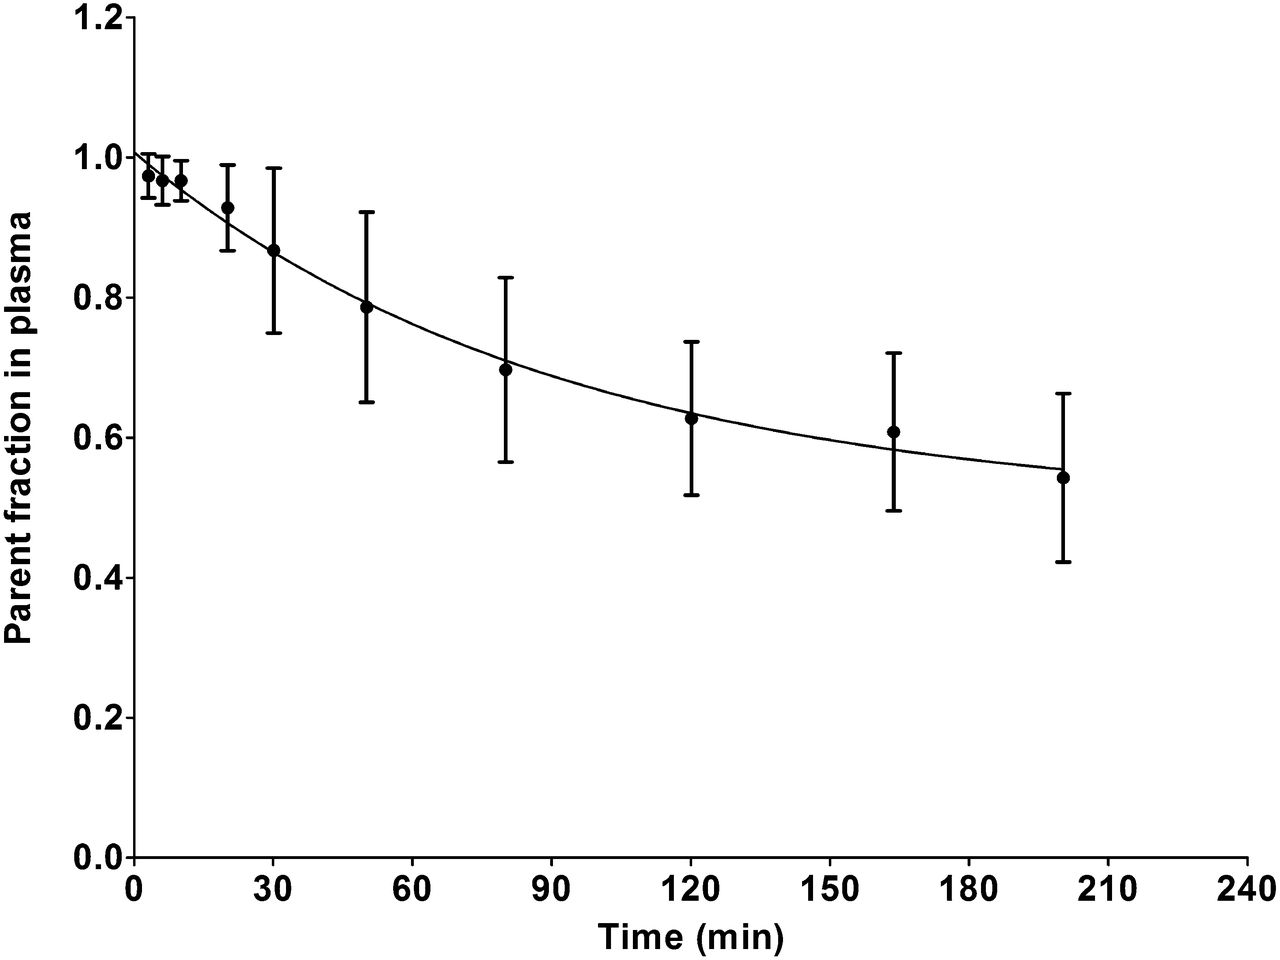
The analysis of the metabolites in arterial plasma using high-performance liquid chromatography showed decomposition of the original radiotracer into polar metabolites. Thirty minutes and 2 h after radiotracer injection, the parent fraction in arterial plasma was 86.7% ± 11.8% and 62.7% ± 11.0% (mean ± SD, n = 3), respectively, reaching a value of around 50% at the end of the scanning session (Fig. 3).

Mean parent fraction profile in plasma over time after intravenous bolus injection of 123I-MNI-420 (results plotted as mean ± SD, n = 3).
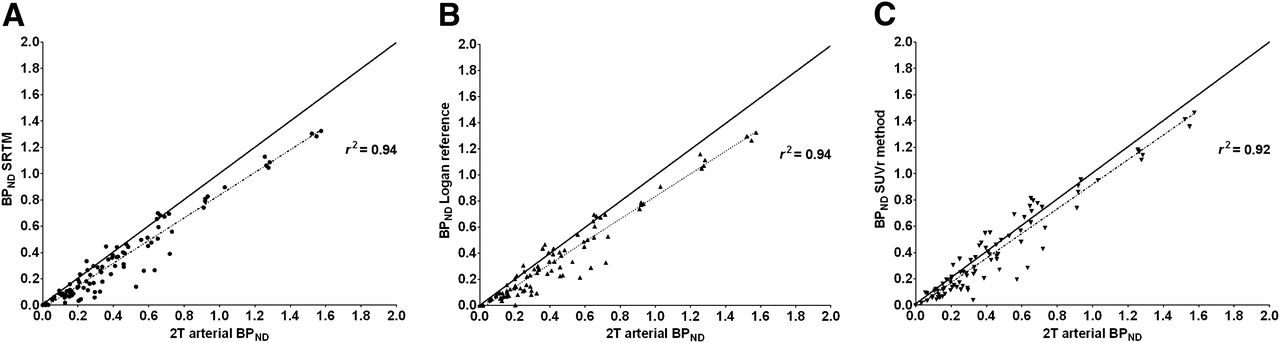
Kinetic modeling using the preferred invasive method, the 2T model (Supplemental Table 1), showed that the highest VT and BPND values were determined in the A2A-rich regions—that is, the caudate, putamen, and striatum. The use of noninvasive models, such as SRTM, Logan plot (t* = 10 min), and pseudoequilibrium SUVr methods, also demonstrated that the BPND values were higher in the striatal region than in cortical regions (Table 1). A good correlation was found between the gold standard 2T invasive modeling and several noninvasive methods (r2 > 0.90) (Fig. 4); however, the use of reference tissue methods underestimates the BPND values in comparison to the 2T modeling by about 14% when using the Logan plot or SRTM method (slope Logan plot and SRTM = 0.86, y intercept of −0.03) and 6% when using the SUVr method (slope SUVr method = 0.94, y intercept of −0.02).
123I-MNI-420 Kinetic Analysis Using 2T Model with Arterial Input Function, SRTM, Logan Reference, and SUVr Methods

Comparative analysis between BPND values obtained from 2T model using arterial input function and SRTM (A), Logan reference (B), and SUVr method (C) (r2 > 0.90 for all graphs). Note close proximity of correlation to line of identity (shown as dark bold line).
The measured test–retest BPND values in the striatum showed an agreement between measurements, where the percentage variability was equal or below 10%, except for subject 4 (Table 2). This subject was subsequently found to have inadvertently ingested a single caffeinated beverage before radiotracer injection on the retest scan (Supplemental Fig. 1).
Test–Retest Results for Each Individual Healthy Human Subject Striatum
Dosimetry Studies
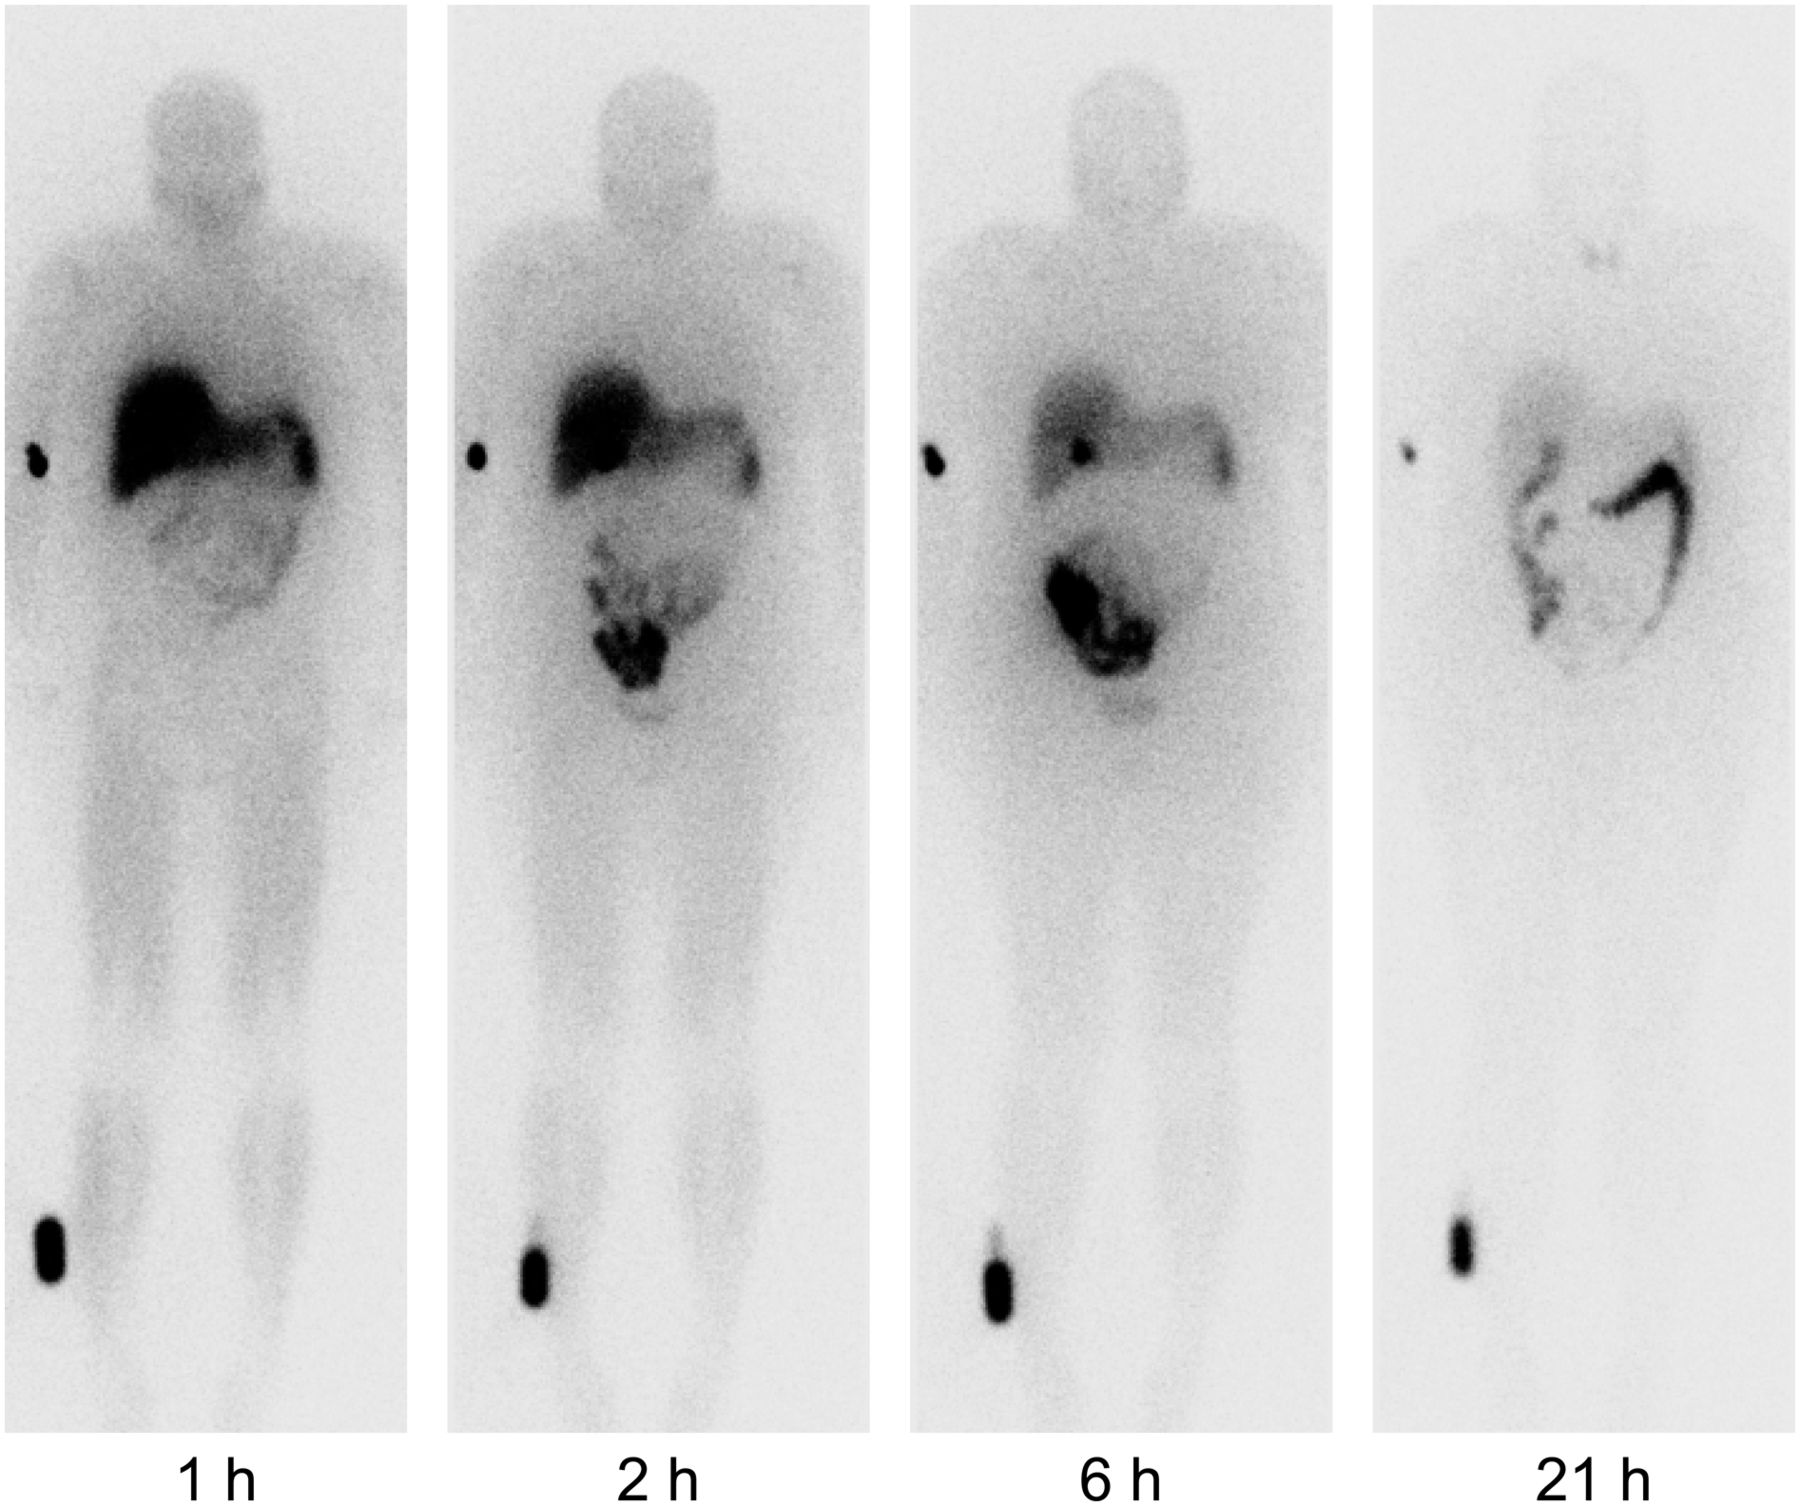
Serial anterior whole-body images demonstrated rapid and avid liver uptake of the radiotracer (uptake at 1 h after injection of 18.1% and 10.6% for subjects 1 and 2, respectively) (Fig. 5). This observation, together with the noted radioactivity in the gallbladder (peak uptake of 2.5% and 1.1% for subjects 1 and 2, respectively) and intestines, provided evidence that the excretion route is mainly hepatobiliary. A small amount of radioactivity was observed in the urinary bladder (uptake < 0.7%), and the mean measured urinary excretion was 5.89% ± 0.16% (6.00% and 5.78% for subjects 1 and 2, respectively) of the administered activity over a period of 21 h after injection. Radioactivity was also found in the brain (peak uptake of 1.3% and 1.5% for subjects 1 and 2, respectively), heart (peak uptake of 2.1% and 1.9% for subjects 1 and 2, respectively), and lungs (peak uptake of 8.0% and 6.9% for subjects 1 and 2, respectively). The spleen radioactivity peaked shortly after injection at 2.3% and 3.8% for subjects 1 and 2, respectively, and cleared more slowly than in the heart, lungs, and brain. Figure 6 displays the mean time–activity curves for all source organs identified.

Serial anterior whole-body images at 1, 2, 6, and 21 h after 123I-MNI-420 injection. Intense liver activity is observed on 1- and 2-h images, and significant gallbladder activity is seen on 6-h image along with activity in liver and bowel system. Radioactive source was placed alongside subject’s distal portion of right leg (lower left corner of each image).
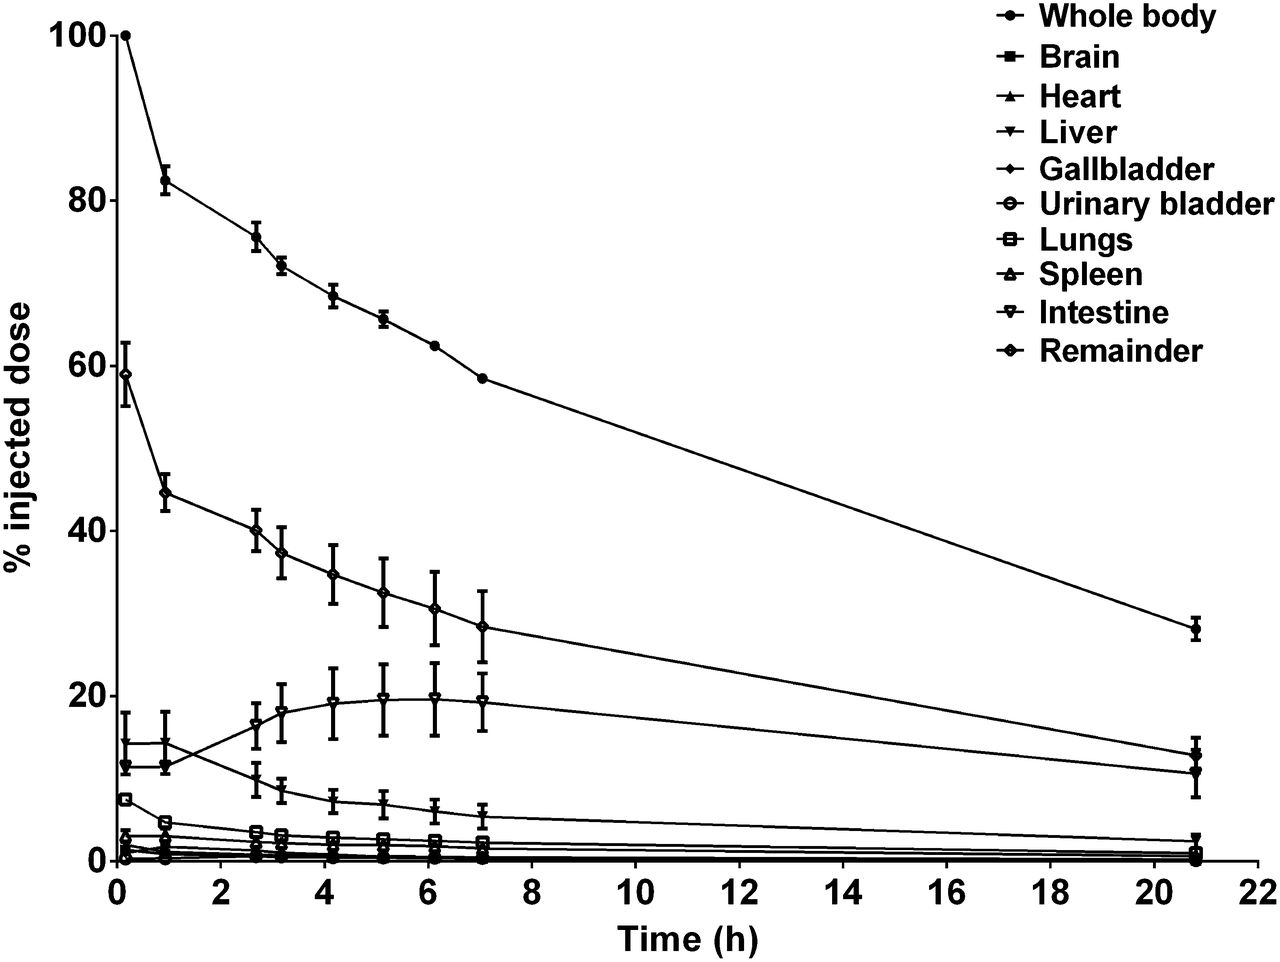
Mean time–activity curves in source organs obtained after bolus intravenous injection of 123I-MNI-420 (results plotted as mean ± SD, n = 2).
Excluding the remainder compartment, the τ values were highest for the gastrointestinal organs, namely, the liver and intestines in both subjects (Table 3). Table 4 lists the absorbed dose and effective dose estimates for 123I-MNI-420 for the 2 subjects. The intestinal walls received the largest radiation burden, with average doses of 0.137 and 0.125 mGy/MBq for the lower large intestine and the upper large intestine, respectively. The gallbladder, small intestine, liver, and spleen received average doses of 0.0535, 0.0566, 0.0436, and 0.0808 mGy/MBq, respectively. All remaining organs received doses of 0.0352 mGy/MBq or less. The mean effective dose for a human subject was found to be 0.0363 mSv/MBq.
Residency Times (h) for Each Organ in Subject 1 and Subject 2
Radiation-Absorbed Dose Estimates for 123I-MNI-420 (mGy/MBq)
DISCUSSION
The present study evaluated 123I-MNI-420 pharmacokinetic properties in the brain and dosimetry estimations in human subjects. Similarly to our previous report in the nonhuman primate brain (12), the results obtained herein show that 123I-MNI-420 accumulation in vivo was consistent with known A2A distribution in the brain (1–3,5). The present study shows that the optimal time for scan acquisition and SUVr quantification after a single bolus injection of 123I-MNI-420 occurs at 90 min after injection. Stable SUVrs of around 1.6, 2.0, and 1.8 in the caudate, putamen, and striatum, respectively, were determined in humans. Previous human studies using [7-methyl-11C]-(E)-8-(3,4,5-trimethoxystyryl)-1,3,7-trimethylxanthine (11C-TMSX)—a successful PET radiotracer for imaging A2A in the brain—reported distribution volume ratios of around 1.4 and 1.5 in the caudate and putamen, respectively, where the frontal, temporal, and occipital lobes were used as reference regions (20). Results obtained here using 123I-MNI-420 SPECT imaging compare favorably with previously developed successful radiotracers for imaging A2A in the brain.
In addition to SUVr estimations, the present study investigated the use of the 2T model with arterial input function for quantification of radiotracer pharmacokinetic properties in the brain. Results demonstrated that the highest VT and BPND values were observed in the caudate and putamen, as anticipated on the basis of known A2A density in the brain. The BPND values estimated using 2T modeling and the cerebellum as the reference region were around 0.8, 1.2, and 1.0 for the caudate, putamen, and striatum, respectively. Similar BPND values were obtained when using noninvasive quantification methods. Previous human studies with successful A2A PET imaging agents, namely 11C-SCH442416 and 11C-TMSX, have reported BPND values in the caudate and putamen of around 0.5 to 1.1 and 1.0 to 1.3, respectively (21–22). Our BPND results obtained using 123I-MNI-420 SPECT are in line with the results previously reported using these PET agents, demonstrating that the new radiotracer 123I-MNI-420 holds promise as an A2A imaging probe.
The comparison between invasive and noninvasive methods of quantification demonstrated that noninvasive methods tended to underestimate the BPND values by about 14% when using SRTM and Logan reference and 6% when using the SUVr method. Our results indicate that a 2T arrangement is needed to accurately describe 123I-MNI-420 regional time–activity curves. Therefore, the use of SRTM modeling, which assumes that radiotracer kinetics follow a 1-tissue-compartment model, results in underestimation of BPND values. This is in agreement with previous observations by Slifstein et al. in 2000 (23). A potential limitation of 123I-MNI-420 might be the inherent image noise, as a consequence of moderate brain uptake (%ID = 1.4% and ≈1.6 SUV measured in the putamen). This image noise could contribute to the BPND underestimation determined when modeling the data using the Logan reference or even when modeling the data using the multilinear reference-tissue models (Supplemental Table 2 and Fig. 2). Imaging at 90 min after injection (SUVr method) appears to be the most suitable noninvasive quantification method and provides BPND values that reflect receptor distribution with the least bias of all investigated methods. The cerebellum was used as the reference region for estimation of tissue ratios and BPND, because it had the lowest uptake and VT values of all brain regions. High-resolution autoradiography experiments have shown that the cerebellum was a region with low to negligible A2A density in multiple species (5,24), further supporting the use of the cerebellum as a reference region. In addition, our preclinical investigations using nonhuman primates demonstrated that displacement or preblocking of 123I-MNI-420 binding in the brain using high doses of caffeine or preladenant, respectively, did not reduce the radioactivity in the cerebellum (12), indicating that this region would be suitable as a reference region. Results presented here indicate that reference tissue methods, rather than more invasive arterial input function–based methods, may be successfully used to quantify BPND values in the brain after bolus injection of 123I-MNI-420, even though an underestimation of ≈10% occurs when applying these methods of analysis. A trade-off between accuracy and simplicity of image analysis is typically necessary when exploring simplified methods in comparison to invasive more accurate methods. Therefore, given the good agreement between noninvasive methods of quantification and 2T modeling (r2 > 0.90) and the small bias between those 2 measurements, the test–retest results were derived using the noninvasive methods.
The test–retest variability in the striatum determined using 123I-MNI-420 SPECT (excluding subject 4 due to caffeine exposure) was found to be, on average, 4.8% when using the SRTM method, 3.5% when using the Logan reference, and 6.5% when using the SUVr methods. These values compare favorably with previously reported test–retest variability determined in humans with other 123I-labeled SPECT radiotracers developed for brain receptor imaging. For example, a 10%–17% variability has been reported for SPECT measurement of benzodiazepine receptors using 123I-iomazenil (25). Around 13% test–retest variability was determined when using SPECT with 123I-epidepride (26), whereas around 11% and 12% test–retest variability was determined using 123I-FPCIT (123I-2β-carbomethoxy-3β-(4-iodophenyl)-N-(3-fluoropropyl)nortropane) and 123I-β-CIT (123I-2β-carboxymethyl-3-β-(4-iodophenyl)tropane), respectively (27–28). A test–retest variability ranging between 13% and 22% was reported when using SPECT with 123I-ADAM (123I-2-((2-((dimethylamino)methyl) phenyl)thio)-5-iodophenylamine) (29).
During the test–retest study, subject 4 inadvertently ingested a caffeinated beverage shortly before the retest scanning session, resulting in BPND values about 60% lower than the test values. This finding demonstrates the significant effect of caffeine on A2A, as in fact it has been shown in previous animal and human studies (1,30–32). In nonhuman primates, we have found a 98% reduction in 123I-MNI-420 binding when acutely injecting 20 mg of caffeine per kilogram (~300 mg per baboon study) and around 54% reduction when injecting 5 mg of caffeine per kilogram (~75 mg per baboon study) (12). Given that a cup of coffee (170 mL) contains around 100 mg of caffeine (32), the observed decrease in subject 4’s retest values in comparison with the test data is not surprising and speaks to the need for rigorous caffeine restriction and perhaps caffeine monitoring when conducting these studies.
Whole-body imaging sessions after administration of 123I-MNI-420 in healthy male and female volunteers showed that the main route of elimination was hepatobiliary. Furthermore, it was found that the radiotracer was minimally excreted via the urinary system. The mean effective dose was determined to be around 0.036 mSv/MBq, suggesting only modest radiation exposure associated with 123I-MNI-420 imaging in human subjects and allowing multiple scans to be performed in the same research subjects per year. The determined mean effective dose is within the typical range of doses for 123I-labeled radiotracers. For example, the effective dose determined after intravenous injection of 123I-βCIT was found to be around 0.036 mSv/MBq, whereas for 123I-ADAM the effective dose was around 0.021 mSv/MBq (33). Intravenous administration of 123I-5IA, another radiotracer currently used for neuroreceptor SPECT imaging, resulted in an effective dose of around 0.03 mSv/MBq (34), whereas 123I-iomazenil presented an effective dose of around 0.033 mSv/MBq (35). Although obtained results show that intravenous injection of 123I-MNI-420 resulted in effective doses similar to the average effective dose per patient from common nuclear medicine studies, given that only 2 subjects were enrolled in the present study, data should be interpreted as preliminary and future studies are necessary to better characterize this radiotracer’s dosimetry.
The highest specific binding detected in the brain was found to be in the striatum. 123I-MNI-420 demonstrated an initial brain uptake of around 1.4% of the ID, and the average radiation dose estimated in the whole brain was around 0.005 mGy/MBq. This estimated dose is based on the assumption that activity is homogenously distributed in the brain; however, because this radiotracer concentrates in the striatum, the exposure in that brain region might be underestimated in comparison with the whole-brain dose. Studies using different brain models are required to estimate the absorbed doses in different brain regions.
CONCLUSION
The data reported here demonstrate that 123I-MNI-420 is a useful SPECT radiotracer for imaging A2A in the brain. Kinetic modeling analysis suggests that the cerebellum may be used as a reference region for estimation of BPND with noninvasive quantification methods. The preliminary estimates of radiation dosimetry showed that 123I-MNI-420 had an effective dose of around 0.036 mSv/MBq, consistent with values reported for other SPECT radiotracers currently used for human neuroreceptor imaging.
DISCLOSURE
The costs of publication of this article were defrayed in part by the payment of page charges. Therefore, and solely to indicate this fact, this article is hereby marked “advertisement” in accordance with 18 USC section 1734. No potential conflict of interest relevant to this article was reported.
Acknowledgments
We thank Greg Kudej for technical assistance with radiotracer preparation; Yun Zhang for assistance with metabolite analysis; and Pamela Becker, Andrea Perez, and Gina Nicolleti for technical assistance with data acquisition.
Footnotes
Published online Aug. 22, 2013.
- © 2013 by the Society of Nuclear Medicine and Molecular Imaging, Inc.
REFERENCES
- Received for publication January 14, 2013.
- Accepted for publication April 25, 2013.


