


Abstract
It is well accepted that drug transporters play a pivotal role in hepatobiliary excretion of anionic drugs, in which drug–drug interactions and genetic polymorphisms are known to cause variations. However, PET probes for in vivo functional characterization of these transporters have not been established yet. We used PET to investigate hepatic uptake and subsequent canalicular efflux of 11C-labeled (15R)-16-m-tolyl-17,18,19,20-tetranorisocarbacyclin methyl ester [(15R)-11C-TIC-Me)] in healthy subjects. Methods: Serial PET scans of the abdominal region in healthy male subjects were obtained with or without the organic anion–transporting polypeptide (OATP) inhibitor rifampicin after intravenous injection of (15R)-11C-TIC-Me as a radiotracer. Venous blood samples and PET images were obtained at frequent intervals up to 30 min after administration of the PET tracer. Dynamic imaging data were evaluated by integration plots of data collected for 2–10 min and for 10–30 min after tracer administration for the determination of tissue uptake clearance and biliary efflux clearance, respectively. Results: After rapid hydrolysis in blood, the acid form—11C-labeled (15R)-16-m-tolyl-17,18,19,20-tetranorisocarbacyclin [(15R)-11C-TIC]—accumulated in the liver (37% of the dose by 17 min), and the radioactivity was then excreted into the bile (6.2% by 30 min). Rifampicin (600 mg by mouth), a potent OATP inhibitor, significantly reduced the radioactivity excreted into the bile (by 44%) by inhibiting both uptake (by 45%) and subsequent canalicular efflux (by 62%). (15R)-11C-TIC is an in vitro substrate of OATP1B1 and OATP1B3, and clinically relevant concentrations of rifampicin inhibited uptake by OATP1B1 and OATP1B3. These results demonstrated that in humans, (15R)-11C-TIC–associated radioactivity is excreted into the bile by organic anion transport systems. Conclusion: We demonstrated that PET image analysis with (15R)-11C-TIC-Me is useful for investigating variations in OATP function in the human hepatobiliary transport system.
- PET
- hepatobiliary transport
- organic anion–transporting polypeptide
- (15R)-16-m-tolyl-17
- 18
- 19
- 20-tetranorisocarbacyclin methyl ester
- drug–drug interaction
The liver, which is the primary detoxification organ, limits the bioavailability of and systemic exposure to orally administered drugs. Hepatocytes are liver parenchymal cells that remove drugs from the blood circulation through active uptake in the sinusoidal side. Biotransformation by metabolizing enzymes or efflux into the bile then completes the removal of drugs (1,2). Multispecific transporters, such as organic anion–transporting polypeptide (OATP)/SLCO and multidrug resistance–associated protein 2 (MRP2)/ABCC2, are involved in the hepatic uptake and canalicular efflux, respectively, of a wide variety of organic anions (3–7). Drug–drug interactions and genetic polymorphisms involving these transporters alter the pharmacokinetics of their substrate drugs, leading to differences in drug pharmacologic or toxicologic effects (4,8–11). Despite considerable clinical data, there have been no quantitative evaluations of the effects of single nucleotide polymorphisms and in vivo inhibitors on the activity of OATP and MRP2 because conventional clinical studies with nonradiolabeled ligands evaluate overall hepatobiliary transport but do not take into account either uptake or efflux processes.
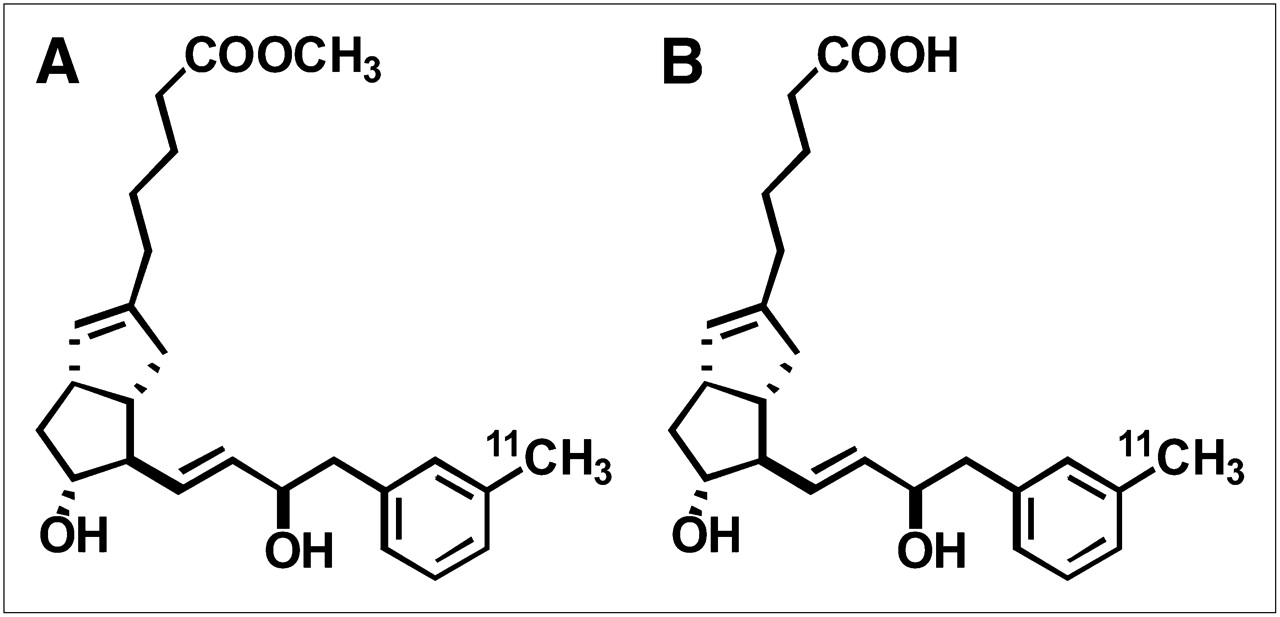
To overcome this difficulty, we developed a PET method to discretely investigate variations in both uptake and efflux processes of human drug transporters. The noninvasive nature, high sensitivity, and good spatiotemporal resolution of PET make it a powerful tool for determining the in vivo distribution of drugs labeled with a positron-emitting radionuclide (12–14). Recently, we demonstrated the utility of PET with 11C-labeled (15R)-16-m-tolyl-17,18,19,20-tetranorisocarbacyclin methyl ester [(15R)-11C-TIC-Me] (Fig. 1A) for the evaluation of hepatobiliary excretion in rats (15) and suggested the feasibility of PET image analysis for investigating transport functions in hepatobiliary excretion in humans. (15R)-11C-TIC-Me was originally developed for PET of prostacyclin receptors in the central nervous system as a prodrug (16), which produced its active acid form—11C-labeled (15R)-16-m-tolyl-17,18,19,20-tetranorisocarbacyclin [(15R)-11C-TIC)] (Fig. 1B)—for neuroprotection in the brain. We also found that (15R)-11C-TIC-Me is rapidly converted to (15R)-11C-TIC in blood and then predominantly excreted into the bile.

Chemical structures of (15R)-11C-TIC-Me (A) and (15R)-11C-TIC (B).
Here we report the development of a PET method for determining the tissue uptake and canalicular efflux of (15R)-11C-TIC in humans. The method allows for the simultaneous measurement of time profiles of radioactivity in the liver and bile in a single subject. In addition, to show the importance of the transporter responsible for the hepatobiliary transport of (15R)-11C-TIC, we conducted a pharmacokinetic interaction study in healthy subjects to examine the effect of rifampicin on the hepatic uptake and canalicular efflux of (15R)-11C-TIC–associated radioactivity. Rifampicin, a potent inhibitor of OATP, has been reported to increase systemic exposure to atorvastatin, an OATP substrate drug, with a single dose (6).
MATERIALS AND METHODS
(15R)-11C-TIC-Me (Fig. 1A) was synthesized at Osaka City University Hospital by use of palladium-mediated rapid coupling of 11C-methyl iodide with its demethylated derivative as described previously (16,17). The identity and concentration of (15R)-11C-TIC-Me were assessed by high-performance liquid chromatography. The purified fraction was evaporated and reconstituted with approximately 4 mL of saline containing 7.5% propylene glycol and 1.3% poly(oxyethylene) sorbitan monooleate. The radiochemical purity was more than 99%, and the specific radioactivity was 11–23 GBq/μmol. 3H-labeled (15R)-TIC [(15R)-3H-TIC] was synthesized at the RIKEN Center for Molecular Imaging Science. The radiochemical purity of purified (15R)-3H-TIC was greater than 98%, and the specific radioactivity was 481 GBq/mmol.
Subjects and Study Design
The study was a single-center (Osaka City University Hospital), single-dose (microdose) clinical study. The study protocol was approved by the Ethics Committee at Osaka City University. All subjects provided written informed consent before the study. Three healthy male Japanese subjects were enrolled in the study. Their age (mean ± SD) was 31 ± 8 y, and their body weight and height were 65 ± 2 kg and 172 ± 3 cm, respectively. The subjects were allowed water but refrained from food intake for one-half day before the study. Each subject was enrolled for 2 study periods. In 1 study period, a single intravenous bolus of (15R)-11C-TIC-Me was administered. In the other study period, a single intravenous bolus of (15R)-11C-TIC-Me was administered 1 h after the oral administration of rifampicin (Rifadin; Daiichi-Sankyo) at the therapeutic dose of 600 mg (four 150-mg capsules). The dose of (15R)-11C-TIC-Me administered per body was 39 ± 10 MBq (chemical amount per body: 0.79 ± 0.13 μg). The 2 study periods were separated by a washout period of at least 1 mo.
PET
Dynamic scanning was performed with an Eminence-B/L PET scanner (Shimadzu). Before emission scanning, each subject was positioned supine on the scanner bed with bandages to minimize body movement during scanning, and then the right and left median cubital veins were cannulated for radiotracer injection and blood sampling, respectively. Next, transmission scanning with a rotating 137Cs point source was performed for abdomen positioning and attenuation correction. At the start of emission scanning, (15R)-11C-TIC-Me was intravenously administered for 30–60 s, and then the catheter line was flushed with 10–25 mL of saline to prevent radiotracer retention. Serial PET scanning of the abdominal region was performed over 30 min in the 3-dimensional dynamic mode according to the following sequence: 12 × 5 s, 8 × 15 s, 4 × 30 s, 5 × 60 s, 5 × 120 s, and 2 × 300 s. Blood (<1.0 mL) was drawn a maximum of 10 times (1, 2, 3, 4, 5, 6, 8, 10, 20, and 30 min after radiotracer administration). The volume of the blood sample at each time point was within 1.0 mL. The amount of radioactivity in each sample was determined with a well-type γ-counting system (well stand type FS-3-A; Shimadzu), and the data were corrected for time decay from the point of radiotracer administration.
Analysis of PET Data
Acquired PET image data were normalized, and all appropriate corrections were applied for dead time, attenuation, and scanner calibration. Emission images were reconstructed by Fourier rebinning and 2-dimensional filtered backprojection with a ramp filter that had a cutoff at the Nyquist frequency (0.0 mm). Regions of interest were delineated for the liver, kidneys, bile duct, and gallbladder, which were visually identifiable, with the program PMOD 3.0 (PMOD Technologies Inc.). For liver and kidney images, regions of interest were defined for calculating the radioactivity concentration and the total amount of radioactivity in the tissues. For gallbladder and bile duct images, regions of interest that were slightly larger than the images but not overlapping the images of the other tissues, such as the liver and kidneys, were defined for calculating the total amount of radioactivity in the tissues. In this analysis, the radioactivity in the gallbladder and bile duct corresponded to that excreted into the bile. Time–radioactivity curves for each tissue were constructed by normalizing decay-corrected time–radioactivity measurements to the injected dose of (15R)-11C-TIC-Me.
The initial radioactivity uptake clearance (CLuptake, tissue) was calculated for the liver and kidneys by use of the integration plot method (15,18) and the portion of the time–radioactivity curves encompassing the period from 2 to 10 min after (15R)-11C-TIC-Me administration. The radioactivity uptake clearance was determined with the following equation:
Integration plot analysis was used to estimate the canalicular efflux clearance (CLint, bile) of radioactivity in the liver and bile during the period from 10 to 30 min after radiotracer administration. The canalicular efflux clearance of radioactivity was determined with the following equation:
Radiometabolite Analysis
Radiometabolite analyses of human blood were performed separately from the PET study to confirm the production of the radiometabolites. Blood was collected at 2, 5, 10, and 20 min after the administration of (15R)-11C-TIC-Me. The amount of radioactivity injected (313 MBq/subject) was approximately 10-fold higher than that administered in the PET study to increase detection sensitivity. Radiometabolite analysis of cultured human hepatocytes was performed to confirm the production of (15R)-11C-TIC-Me radiometabolites in the hepatocytes. Cryopreserved human hepatocytes (Celsis In Vitro Technologies) were thawed and prepared as described previously (19). A suspension of hepatocytes (2.5 × 10⁶ cells/mL in William E medium [Life Technologies Corporation]) or medium without hepatocytes was incubated with (15R)-11C-TIC-Me (1 MBq) at 37°C in a humidified carbon dioxide (5%) chamber for a maximum of 90 min. Sample preparation and chromatographic separation were performed as described previously (15).
Uptake of (15R)-3H-TIC into Transporter-Expressing Cells
The uptake of (15R)-3H-TIC into transporter-expressing cells was assayed as described previously (20–23). Transporter-specific uptake was obtained by subtracting the uptake into vector-transfected cells from the uptake into complementary DNA–transfected cells. Inhibition constants (Ki values) for a series of compounds were calculated with the following equation, provided that the substrate concentration was low enough compared with Michaelis constant Km value:
The relative contributions of OATP1B1 and OATP1B3 to the hepatic uptake of (15R)-3H-TIC in human hepatocytes were calculated as described previously (23). In brief, the relative activity factor for OATP1B1 (ROATP1B1) or OATP1B3 (ROATP1B3) was calculated as the ratio of the uptake clearance of estrone-3-sulfate (a reference compound for OATP1B1) or cholecystokinin octapeptide (a reference compound for OATP1B3), respectively, in human hepatocytes (CLhepatocyte) to that in transporter-expressing cells (CLOATP1B1 or CLOATP1B3). Next, the contribution of OATP1B1 or OATP1B3 to the hepatic uptake of the test compound in human hepatocytes was calculated with the following equations:
Statistical Analysis
Data were calculated as the mean ± SD for 3 or 4 determinations. A Student 2-tailed paired t test was used to identify significant differences between the control group and the rifampicin-treated group. A 2-way ANOVA with the Bonferroni multiple-comparisons procedure was used to test for the effect of rifampicin on time profiles of tissue radioactivity. Statistical significance was set at P < 0.05.
RESULTS
Distribution of Radioactivity in Human Abdominal Region and Blood After Administration of (15R)-11C-TIC-Me
Representative PET images of the distribution of radioactivity in abdominal tissues after the administration of (15R)-11C-TIC-Me with and without rifampicin are shown in Figure 2. Time profiles of mean total tissue and blood radioactivity, as determined by PET image analysis, are shown in Figure 3. Radioactivity reached maximum levels of 37% ± 6% and 31% ± 11% of the dose in the liver in control and rifampicin-treated subjects, respectively, at 17 min after administration and kept increasing in the gallbladder and bile duct (Fig. 3). Rifampicin treatment significantly reduced the amount of radioactivity excreted into the bile (2.8% ± 1.4% of the dose in rifampicin-treated subjects vs. 6.3% ± 1.6% of the dose in control subjects) at 30 min and delayed the elimination of radioactivity from the systemic circulation (Fig. 3). The AUC0–30 min, blood values in rifampicin-treated subjects were 1.5-fold higher than those in control subjects (0.124% ± 0.018% vs. 0.083% ± 0.038% of the dose × min/mL).

Color-coded PET images of abdominal region of healthy male subject after administration of (15R)-11C-TIC-Me with and without rifampicin. Coronal maximum-intensity-projection PET images of radioactivity in abdominal region were captured at 5, 10, 15, 20, and 30 min after administration of (15R)-11C-TIC-Me (39 ± 10 MBq/body, 0.79 ± 0.13 μg/body) in absence (A) or presence (B) of 600 mg of rifampicin.
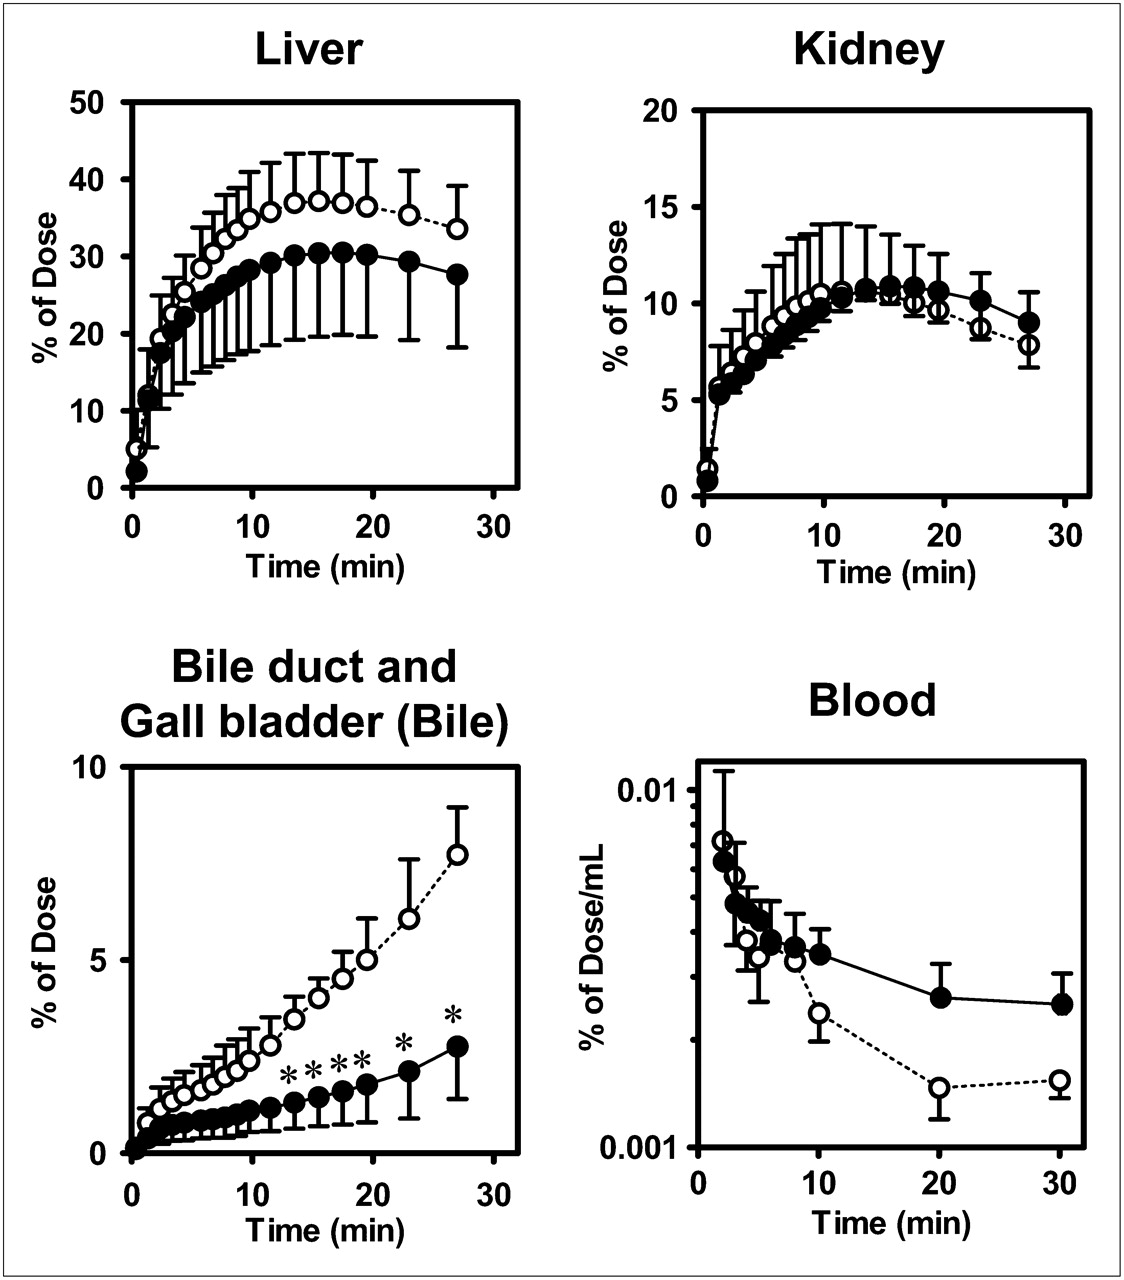
Effect of rifampicin on time profiles of radioactivity in tissues and blood from healthy male subjects after administration of (15R)-11C-TIC-Me. Time profiles of mean (SD) (n = 3) radioactivity in liver, kidney, bile, and blood were determined. PET of abdominal region and blood sampling were performed over 30-min period after administration of (15R)-11C-TIC-Me to subjects who received (closed circles) or did not receive (open circles) rifampicin pretreatment. *P < 0.05 (2-way ANOVA, Bonferroni multiple-comparisons procedure).
Radiometabolite Analysis of Human Blood and Cultured Hepatocytes
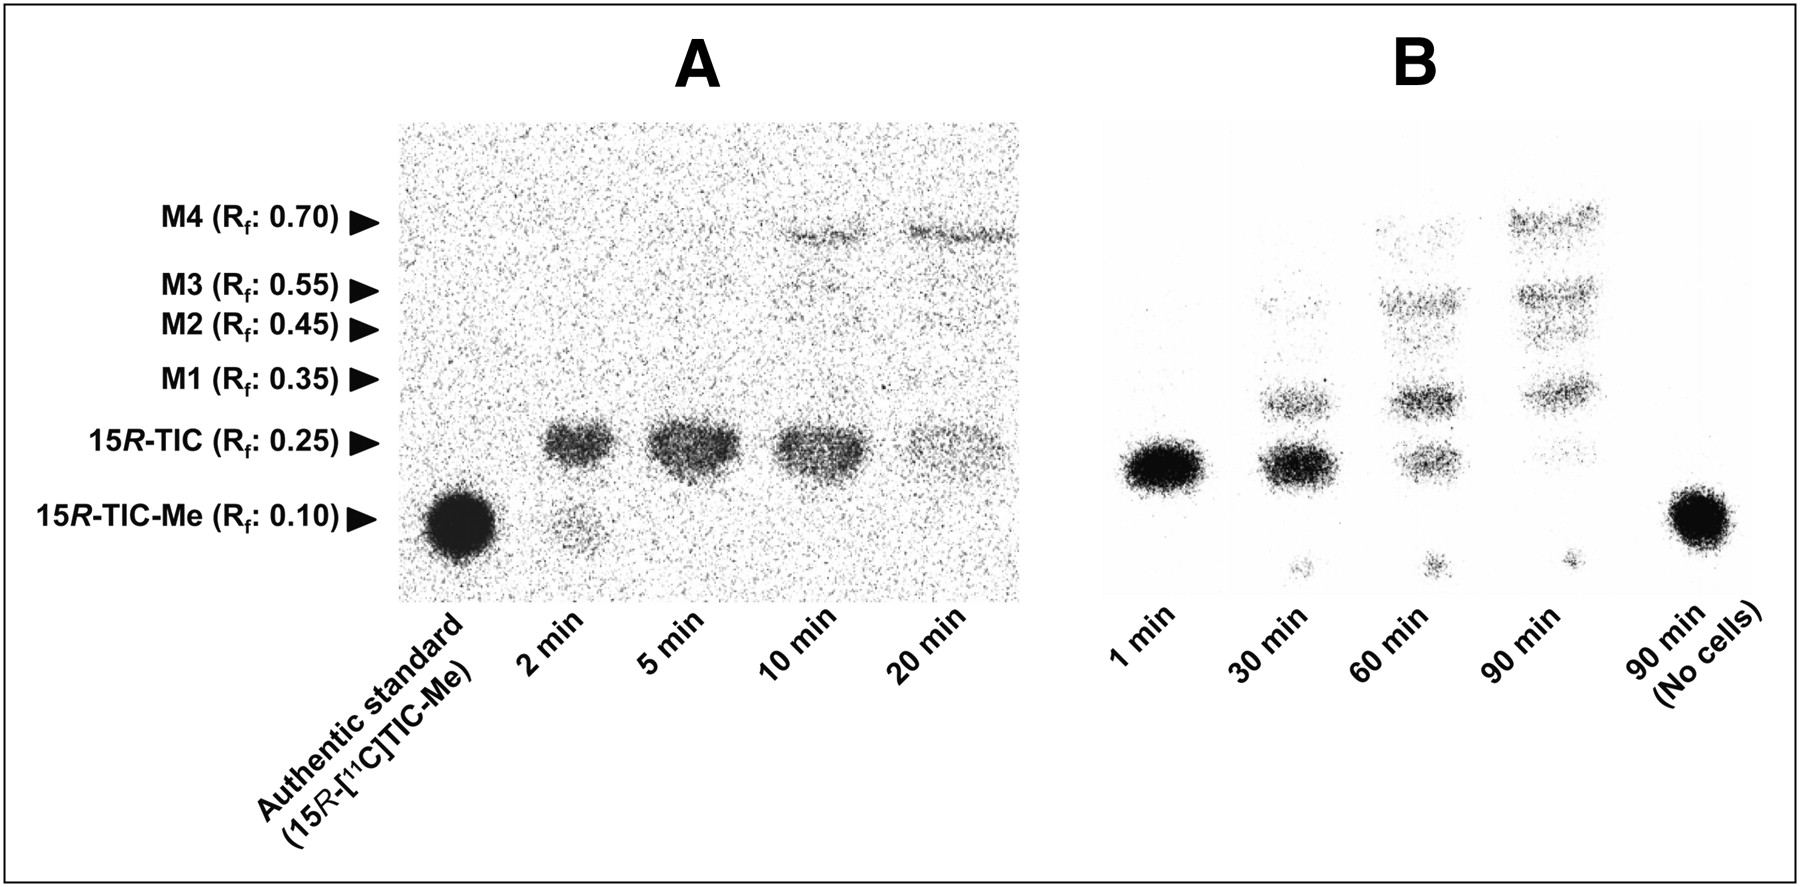
(15R)-11C-TIC-Me and its metabolites in human blood and cultured hepatocytes were separated by thin-layer chromatography and then analyzed by autoradiography (Fig. 4). In blood, (15R)-11C-TIC predominated up to 10 min, and metabolite M4 was predominant by 20 min after administration (Fig. 4A). In human hepatocytes incubated with (15R)-11C-TIC-Me, (15R)-11C-TIC was the predominant component at 30 min, whereas metabolites M1, M3, and M4 were more abundant than (15R)-11C-TIC by 90 min (Fig. 4B). M1, M3, and M4 were identical to the metabolites found in a rat study (M1, M2, and M3, respectively) (15); the presence of M2 in human hepatocytes is a new finding, according to the retention factor determined by thin-layer chromatography analysis and the spectrum of each metabolite determined by liquid chromatography with tandem mass spectrometry (LC/MS/MS) analysis (Supplemental Fig. 1) (supplemental materials are available online only at http://jnm.snmjournals.org)).

Representative radiochromatograms of (15R)-11C-TIC-Me and its metabolites in blood (A) and cultured human hepatocytes (B). (A) Blood specimens collected from control subjects at 2, 5, 10, and 20 min were subjected to thin-layer chromatography and then analyzed by autoradiography. (B) Human hepatocytes sampled at 1, 30, 60, and 90 min after application of (15R)-11C-TIC-Me (1 MBq) to cell suspension. Culture medium lacking hepatocytes and sampled at 90 min (No cells) was also analyzed.
Uptake Clearance of (15R)-11C-TIC in Liver and Kidneys of Healthy Male Subjects
Integration plots were drawn to calculate the tissue uptake clearance of radioactivity (Fig. 5A). The slopes of the plots were determined across the linear range (2–10 min after radiotracer administration). Hepatic uptake clearance (CLuptake, liver) in control subjects ranged from 46% to 79% of the hepatic blood flow rate (21 mL/min/kg) (25). Rifampicin treatment significantly decreased CLuptake, liver (by 45% ± 4%; P < 0.05) compared with that in control subjects but had no effect on renal uptake clearance (CLuptake, kidney) values, which were 3.0 ± 0.4 and 3.6 ± 0.3 mL/min/kg in rifampicin-treated and control subjects, respectively (Fig. 5C).
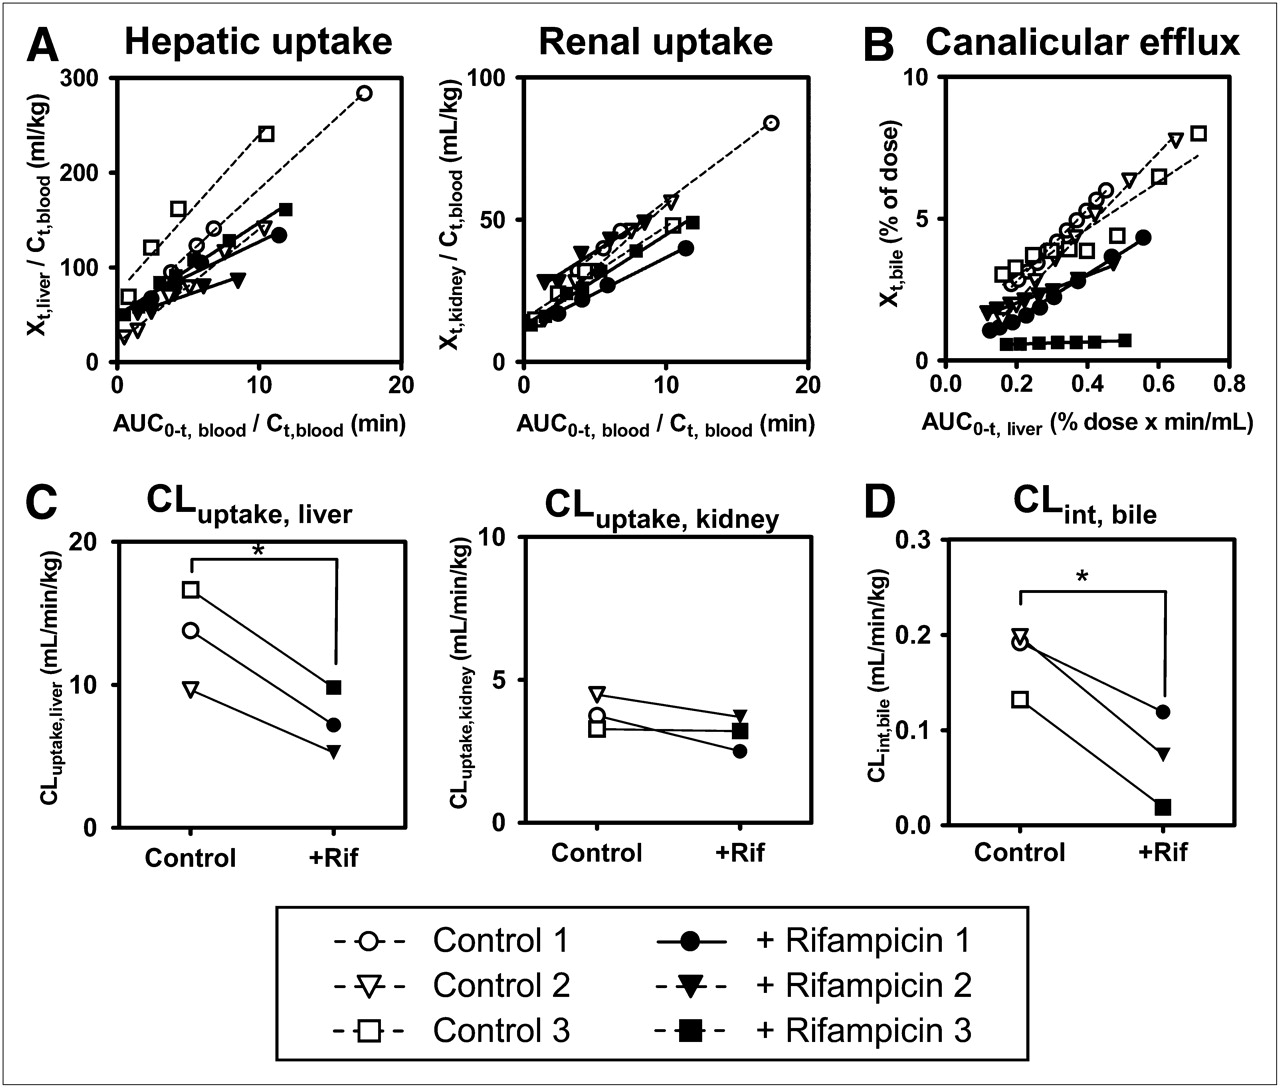
Effect of rifampicin on tissue uptake and canalicular efflux of radioactivity associated with (15R)-11C-TIC-Me in healthy male subjects. (A) Integration plots were drawn for calculation of CLuptake, liver and CLuptake, kidney after administration of (15R)-11C-TIC-Me to subjects who received (+ Rifampicin [+Rif]) or did not receive (Control) rifampicin treatment. (B) Integration plots were drawn for calculation of CLint, bile. (C) Tissue uptake clearances of radioactivity were compared in control and rifampicin-treated groups. CLuptake, liver in control subjects ranged from 46% to 79% of hepatic blood flow rate (21 mL/min/kg) (25). (D) CLint, bile values were compared in control and rifampicin-treated groups. Data points with identical symbols are from same subject. Each line in integration plot represents initial slope of plot for each subject. Calculation of each type of clearance is described in Materials and Methods. *Significant difference (P < 0.05) between control and rifampicin-treated subjects.
Canalicular Efflux of Radioactivity into Bile in Healthy Subjects
Integration plots were constructed to determine CLint, bile of radioactivity (Fig. 5B) across the linear range (10–30 min after radiotracer administration). Rifampicin treatment significantly decreased CLint, bile (by 62% ± 24%; P < 0.05) (Fig. 5D). However, the effect of rifampicin on canalicular efflux was variable, being moderate in 2 subjects and potent only in 1 subject.
Uptake of (15R)-3H-TIC into Transporter-Expressing Cells
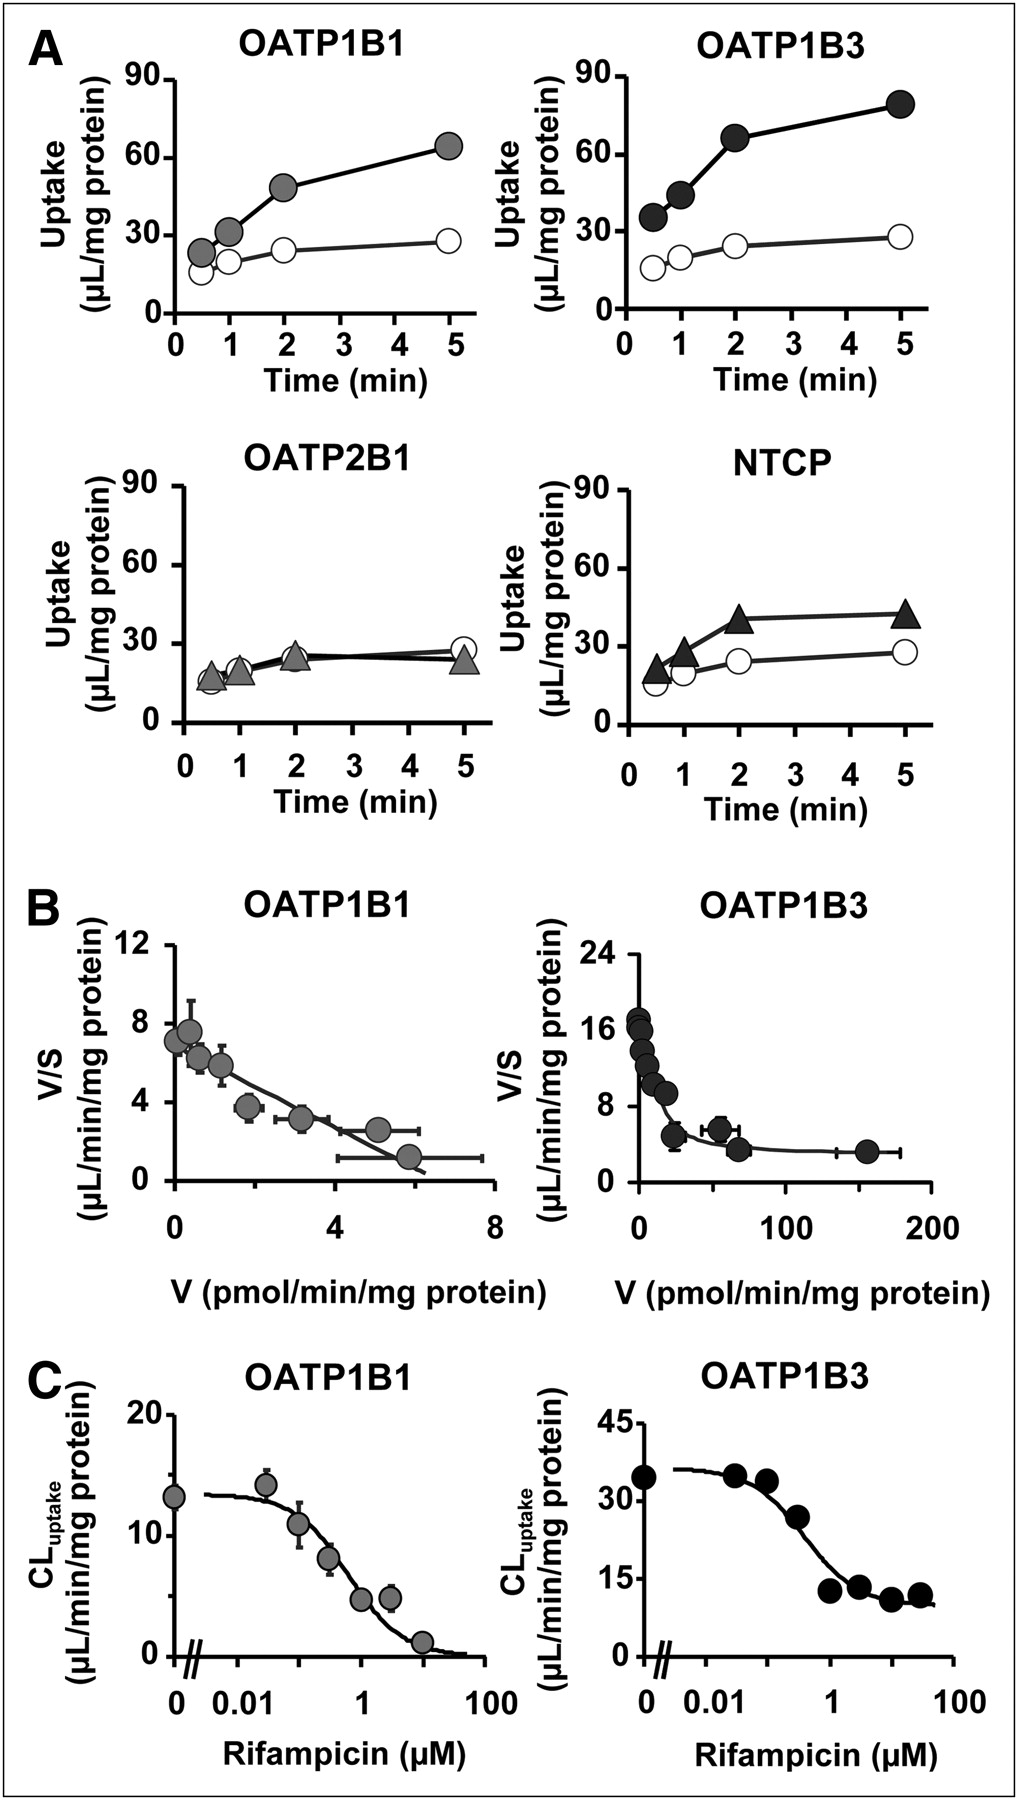
The uptake of (15R)-3H-TIC (0.1 μM) by cells expressing OATP1B1, OATP1B3, OATP2B1, and Na(+)-taurocholate–cotransporting polypeptide (NTCP) and vector-transfected HEK293 cells (control) was also investigated. A significant increase in the accumulation of (15R)-3H-TIC was observed in OATP1B1-, OATP1B3-, and NTCP-expressing cells (Fig. 6A). This uptake was saturable (Fig. 6B), with (15R)-3H-TIC Km values of 0.96 ± 0.16 and 1.3 ± 0.4 μM for OATP1B1 and OATP1B3, respectively. The contribution of OATP1B1 and OATP1B3 to hepatic uptake was evaluated by use of the relative activity factor method (Table 1). The average relative activity factor defined in hepatocytes suggested that OATP1B1 and OATP1B3 contributed significantly (69.3% ± 16.3% and 30.7% ± 16.3%, respectively) to hepatic uptake. Rifampicin inhibited OATP1B1- and OATP1B3-mediated (15R)-3H-TIC uptake, with Ki values of 0.62 ± 0.19 and 0.39 ± 0.17 μM, respectively (Fig. 6C). Depletion of Na+ in the incubation medium did not affect the uptake of (15R)-3H-TIC into human hepatocytes (data not shown).

Time profiles of (15R)-3H-TIC uptake, its concentration dependence, and inhibition by rifampicin of (15R)-3H-TIC uptake by key hepatic transporters. (A) Uptake of (15R)-3H-TIC (0.1 μM) by human OATP1B1-, OATP1B3-, OATP2B1-, and NTCP-expressing HEK293 cells (closed symbols) and control cells (open symbols) was determined at designated times. (B) Concentration dependence of OATP1B1- and OATP1B3-mediated uptake of (15R)-3H-TIC is shown as Eadie–Hofstee plots. OATP1B1- and OATP1B3-mediated transport was calculated by subtracting uptake in vector-transfected control cells from that in transporter-expressing cells. Lines represent fitted curves obtained by nonlinear regression analysis. (C) Effect of rifampicin on uptake of (15R)-TIC (0.1 μM) by OATP1B1- and OATP1B3-expressing cells. Ki values of rifampicin for OATP1B1- and OATP1B3-mediated uptake of (15R)-TIC were obtained by nonlinear regression analysis, and solid lines represent resulting fitted curves. Vertical bars represent SEs (n = 3 or 4). Where vertical or horizontal bars are not shown, SEs are within range encompassed by symbols. V = uptake velocity of (15R)-3H-TIC; V/S = calculated by dividing uptake velocity of (15R)-3H-TIC by (15R)-3H-TIC concentration in the media.
Contributions of OATP1B1 and OATP1B3 to Hepatic Uptake of (15R)-TIC in Humans*
DISCUSSION
We demonstrated that PET enables the simultaneous determination of tissue uptake and canalicular efflux in humans. In addition, we showed that PET with (15R)-11C-TIC-Me enables functional characterization of the OATPs responsible for hepatic uptake in humans and that (15R)-11C-TIC-Me can be used for the elucidation of drug–transporter interactions in clinical PET studies in vivo and transport studies in vitro.
The pharmacokinetic parameters of human hepatic (CLuptake, liver) and renal (CLuptake, kidney) uptake were determined by constructing integration plots after PET image analysis. Because radiometabolite analysis indicated that (15R)-11C-TIC was the predominant form in blood from 2 to 10 min after the administration of (15R)-11C-TIC-Me (Fig. 4), the period for which integration plots were drawn, the uptake clearance of the radioactivity corresponded to that of (15R)-11C-TIC. The fact that CLuptake, kidney was approximately 3.5-fold lower than CLuptake, liver indicated that the tissue uptake capability was the determining factor for the pathway of elimination of radioactivity from the body.
Rifampicin is a known inhibitor of OATP1B1 and OATP1B3 (26). Inhibition of hepatic uptake has been considered to be the drug–drug interaction mechanism for rifampicin and atorvastatin (6). PET image analysis revealed that rifampicin significantly decreased CLuptake, liver in subjects pretreated with 600 mg of rifampicin compared with control subjects. (15R)-11C-TIC is an in vitro substrate of both OATP1B1 and OATP1B3, and rifampicin inhibited OATP-mediated (15R)-3H-TIC uptake, with Ki values of 0.62 μM (OATP1B1) and 0.39 μM (OATP1B3) (Fig. 6). Our in vitro experiments with the relative activity factor method (20) indicated that both OATP1B1 and OATP1B3 were involved in hepatic uptake of (15R)-11C-TIC and that the contribution of OATP1B1 was larger than that of OATP1B3, although there was large variability between hepatocyte lots. Additionally, the uptake of (15R)-3H-TIC into human hepatocytes was saturable and decreased significantly (by 59%–83%) in the presence of 100 μM estrone-3-sulfate, which selectively inhibits OATP1B1-mediated uptake (data not shown); this result further confirmed the significant contribution of OATP1B1 to hepatic uptake. Although significant uptake of (15R)-3H-TIC by NTCP was observed (Fig. 6A), the absence of sodium dependence in the uptake of (15R)-3H-TIC by human hepatocytes suggested a small contribution of NTCP.
It is most likely that OATP1B1 and OATP1B3 account for the majority of hepatic uptake of (15R)-11C-TIC therefore, (15R)-11C-TIC-Me is useful for the functional analysis of OATP transporters, but discriminating OATP1B1 and OATP1B3 functions is considered to be difficult. Assuming a reported maximum plasma rifampicin concentration in Japanese subjects 2 h after the oral administration of a 450-mg dose of 9.7 μM (27) and an unbound fraction of rifampicin of 20% (26), the estimated free concentration of rifampicin in plasma 1 h after the oral administration of a 600-mg dose would be 1.3 μM. Because the unbound concentration of rifampicin is greater than the Ki values of OATPs, rifampicin could produce significant inhibition of OATP1B1 and OATP1B3 at its clinical dose. Because rifampicin is taken up into the liver via OATPs (28) and effectively blocks OATP-mediated hepatic uptake in a competitive manner, a comparison of its unbound concentration in plasma with the Ki values of OATPs suggests significant inhibition. This suggestion is in good agreement with the significant reduction in CLuptake, liver by rifampicin treatment. On the other hand, the radioactivity (AUC0–30 min, blood) in subjects pretreated with rifampicin was 1.5-fold greater than that in control subjects, and liver exposure appeared to be lower. Because the radiometabolites are included in radioactivity at later time points, rifampicin may affect not only hepatic uptake but also backward flux of metabolites into the blood.
CLint, bile of total radioactivity could be evaluated by use of integration plots with PET. However, unlike the uptake process data, the canalicular efflux data must be interpreted cautiously because the effect of rifampicin on canalicular efflux was highly variable and (15R)-11C-TIC likely was subjected to biotransformation in the liver. Radiometabolite analysis of human hepatocytes indicated that at least 4 metabolites (M1–M4) were produced from the breakdown of (15R)-11C-TIC (Fig. 4). An LC/MS/MS analysis of human hepatocyte extracts incubated with (15R)-11C-TIC suggested that M1 was produced by deethylation of (15R)-11C-TIC and that M3 and M4 were glucuronide conjugates of (15R)-11C-TIC and M1, respectively (Supplemental Fig. 1). This metabolic pattern is similar to that in rats (15). Previously, we demonstrated that at least the glucuronide conjugates of (15R)-TIC are substrates of MRP2. Furthermore, the glucuronide conjugates of (15R)-TIC are the major forms found in bile, and the canalicular efflux of these forms was impaired in MRP2-deficient mutant rats. An in vitro study with human hepatocytes showed that most of the radioactivity was associated with (15R)-11C-TIC by 30 min; thereafter, metabolites including glucuronide conjugates (M3 and M4) were formed. Therefore, intersubject differences in metabolite formation may account for the variations in the effect of rifampicin on canalicular efflux. Hepatocyte-to-medium distribution ratios of rifampicin of 13.7–19.4 and an unbound fraction in rat hepatocytes of 0.153 have been reported (29). With these values, the unbound rifampicin concentration in the liver was calculated to be approximately 10–14 μM; this concentration is comparable to the 50% inhibitory concentration of 20 μM reported for MRP2 in MRP2-expressing membrane vesicle uptake (29). It is possible that rifampicin can inhibit MRP2-mediated efflux into bile. This speculation should be confirmed with a nonmetabolizable MRP2-specific PET probe.
The results of the present study highlight the usefulness of PET clinical studies for independently investigating both quantitative hepatobiliary transport and the uptake and efflux of anionic drugs in individual subjects with (15R)-11C-TIC-Me as a test probe. Functional characterization of drug transporters involved in uptake and efflux with PET sheds light on the mechanisms that cause pharmacokinetic variations (i.e., drug–drug interactions, genetic polymorphisms, and disease states). Using PET, we demonstrated that at clinical doses, rifampicin inhibits hepatic uptake via OATP1B1 and OATP1B3, confirming that rifampicin is an in vivo inhibitor of OATP1B1 and OATP1B3. On the basis of tissue uptake clearance per unit of tissue weight, CLuptake, kidney was somewhat higher than CLuptake, liver. Considering the overlapping substrate specificity of OAT3 with OATP1B1 and OATP1B3, our data suggest that OAT3 is the responsible transporter. In vivo experiments confirmed that rifampicin has no effect on the renal uptake of (15R)-11C-TIC. Rifampicin also does not inhibit the uptake of typical OAT3 substrates (30). Future studies should evaluate whether (15R)-11C-TIC-Me can serve as an in vivo probe substrate for OAT3 in humans.
Molecular imaging probes are currently being developed for defined transporters. Ghibellini et al. (31) reported the usefulness of 99mTc-mebrofenin as a clinical probe for assessing altered hepatobiliary transport of OATPs and MRP2 in multiple in vitro transport studies, in vivo studies in animals, and healthy male volunteers with γ-scintigraphy; however, the application of these probes to clinical studies for evaluating altered hepatobiliary transport has not been directly demonstrated yet. Further studies are needed, particularly to establish molecular imaging probes for specific transporters, such as (15R)-11C-TIC-Me and 99mTc-mebrofenin. Enrichment of these probes will contribute to an increase in the predictability and reliability of in vitro–in vivo extrapolations of the membrane transport of drugs.
CONCLUSION
Our results indicated that (15R)-11C-TIC is taken up by hepatocytes via OATP1B1 and OATP1B3 and is then subjected to biotransformation and canalicular efflux into bile. Our results therefore demonstrate that noninvasive PET with (15R)-11C-TIC-Me is a useful tool for the kinetic analysis of hepatobiliary transport in humans.
DISCLOSURE STATEMENT
The costs of publication of this article were defrayed in part by the payment of page charges. Therefore, and solely to indicate this fact, this article is hereby marked “advertisement” in accordance with 18 USC section 1734.
Acknowledgments
We are indebted to Kiyoshi Kyono, Yumiko Katayama, and Yukiko Hirao of the RIKEN Center for Molecular Imaging Science and to Suzuka Ataka, Joji Kawabe, Yoshihiro Shimonishi, Masashi Okamoto, Takashi Yamanaga, and Hisako Kobata of Osaka City University Hospital for their expert technical assistance and supervision of this study. This work was supported in part by a consignment expense for the Molecular Imaging Program on “Research Base for Exploring New Drugs” from the Japanese Government Ministry of Education, Culture, Sports, Science, and Technology. No other potential conflict of interest relevant to this article was reported.
Footnotes
Published online Apr. 12, 2012.
- © 2012 by the Society of Nuclear Medicine, Inc.
REFERENCES
- Received for publication October 10, 2011.
- Accepted for publication January 3, 2012.


Jump to section
Related Articles
Cited By...
- Evaluation of the Selectivity of Several Organic Anion Transporting Polypeptide 1B Biomarkers Using Relative Activity Factor Method
- Prediction of Transporter-Mediated Drug-Drug Interactions and Phenotyping of Hepatobiliary Transporters Involved in the Clearance of E7766, a Novel Macrocycle-Bridged Dinucleotide
- Hepatocyte Concentrations of Imaging Compounds Associated with Transporter Inhibition: Evidence in Perfused Rat Livers
- Emerging Models of Drug Metabolism, Transporters, and Toxicity
- A Clinical Quantitative Evaluation of Hepatobiliary Transport of [11C]Dehydropravastatin in Humans Using Positron Emission Tomography
- Successful Prediction of In Vivo Hepatobiliary Clearances and Hepatic Concentrations of Rosuvastatin Using Sandwich-Cultured Rat Hepatocytes, Transporter-Expressing Cell Lines, and Quantitative Proteomics
- Hepatobiliary Secretion Kinetics of Conjugated Bile Acids Measured in Pigs by 11C-Cholylsarcosine PET
- Investigation of the Impact of Substrate Selection on In Vitro Organic Anion Transporting Polypeptide 1B1 Inhibition Profiles for the Prediction of Drug-Drug Interactions
- Evaluation of Oatp and Mrp2 Activities in Hepatobiliary Excretion Using Newly Developed Positron Emission Tomography Tracer [11C]Dehydropravastatin in Rats
- Evidence of Drug-Drug Interactions through Uptake and Efflux Transport Systems in Rat Hepatocytes: Implications for Cellular Concentrations of Competing Drugs
- Evaluation of Breast Cancer Resistance Protein Function in Hepatobiliary and Renal Excretion Using PET with 11C-SC-62807