


Abstract
Cerenkov luminescence imaging (CLI) has emerged as a less expensive, easier-to-use, and higher-throughput alternative to other nuclear imaging modalities such as PET. It is expected that CLI will find many applications in biomedical research such as cancer detection, probe development, drug screening, and therapy monitoring. In this study, we explored the possibility of using CLI to monitor drug efficacy by comparisons against PET. To assess the performance of both modalities in therapy monitoring, 2 murine tumor models (large cell lung cancer cell line H460 and prostate cancer cell line PC3) were given bevacizumab versus vehicle treatments. Two common radiotracers, 3′-deoxy-3′-18F-fluorothymidine (18F-FLT) and 18F-FDG, were used to monitor bevacizumab treatment efficacy. Methods: One group of mice (n = 6) was implanted with H460 xenografts bilaterally in the shoulder region, divided into treatment and control groups (n = 3 each), injected with 18F-FLT, and imaged with PET immediately followed by CLI. The other group of mice (n = 6) was implanted with PC3 xenografts in the same locations, divided into treatment and control groups (n = 3 each), injected with 18F-FDG, and imaged by the same modalities. Bevacizumab treatment was performed by 2 injections of 20 mg/kg at days 0 and 2. Results: On 18F-FLT scans, both CLI and PET revealed significantly decreased signals from H460 xenografts in treated mice from pretreatment to day 3. Moderately increased to unchanged signals were observed in untreated mice. On 18F-FDG scans, both CLI and PET showed relatively unchanged signals from PC3 tumors in both treated and control groups. Quantifications of tumor signals of Cerenkov luminescence and PET images showed that the 2 modalities had excellent correlations (R2 > 0.88 across all study groups). Conclusion: CLI and PET exhibit excellent correlations across different tumor xenografts and radiotracers. This is the first study, to our knowledge, demonstrating the use of CLI for monitoring cancer treatment. The findings warrant further exploration and optimization of CLI as an alternative to PET in preclinical therapeutic monitoring and drug screening.
The emerging field of molecular imaging has yielded promising applications in both preclinical and clinical research in recent years (1). It has witnessed important advances in medical diagnosis of diseases including cancer, cardiovascular diseases, and neurologic diseases; novel treatment modalities; and therapy monitoring. A wide variety of modalities in molecular imaging are now available to researchers and physicians alike. These include PET, optical imaging (OI), MRI, SPECT, and ultrasound. Among these options, the nuclear imaging modality PET is notable for its high sensitivity and excellent quantification potential yet suffers from poor spatial resolution, high cost, and low availability to basic researchers. On the other hand, OI features high sensitivity, short scanning time, and high throughput. However, OI is limited mostly to preclinical applications because of limited penetration and significant scattering of optical signals in vivo.
In recent years, potential applications of Cerenkov radiation (CR) in molecular imaging have gained credence because several groups of researchers have independently showed that luminescence resulting from CR can be used to image radionuclides, an application that once was solely in the domain of nuclear imaging modalities such as PET and SPECT (2–8). Originally discovered in 1934 by Russian physicist Pavel Alekseyevich Cerenkov and his colleagues, CR is a form of electromagnetic radiation emitted when a charged particle such as a positron or an electron travels at a speed beyond the speed of light in a dielectric medium (9,10). The charged particle disrupts the electromagnetic field of the medium, temporarily displaces the electrons in the atoms of the medium, and subsequently causes the emission of photons when displaced electrons return to the ground state. For example, the initial speed of an 18F positron with the maximum relativistic kinetic energy of 635 keV can be calculated to be 0.90c (c represents the speed of light in a vacuum), which is significantly higher than the speed of light in water (0.75c). As the charged positron travels in water, it gradually loses its kinetic energy and speed, but as long as its speed remains superluminal, CR will be continuously emitted in the form of photons. Ilya Frank and Igor Tamm, colleagues of Cerenkov, were the first to calculate the number of photons produced by CR, and Ross later derived a table of numerically integrated solutions that was based on their formula (11). It was estimated that one 18F decay would produce an average of 3 photons in water using this table (3).
Several groups have demonstrated that Cerenkov luminescence imaging (CLI) can be used for in vivo tumor imaging, imaging probe development, and reporter gene imaging among other applications (2,3,5,12,13). One of the reasons why CLI has enjoyed some success in molecular imaging is that it takes advantage of luminescence signals generated from radioactive probes, a good number of which have already been approved for clinical uses in nuclear medicine and have found many important applications in both preclinical and clinical research. Combined with the significantly reduced cost and greater availability of detectors when compared with nuclear imaging modalities such as PET, CLI is being considered as a new and alternative molecular imaging modality.
One important application of CLI that has not been explored thus far is cancer drug therapy monitoring. Such monitoring would be essential for preclinical drug development and screening and potentially significant for clinical uses as well. PET and SPECT have long been approved and used for cancer diagnosis and therapy monitoring. These modalities have also been widely used for preclinical research, drug screening, and other related fields. In theory, CLI visualizes the same radionuclides as PET and SPECT, albeit with a quite different mechanism; thus, a good correlation could exist between the 2 techniques. If a good correlation does exist in cancer therapy monitoring, then CLI could become an attractive alternative to the nuclear imaging modalities. Our group previously showed that an excellent correlation between CLI and PET did exist in 18F-FDG imaging of C6-FLuc subcutaneous tumors (2). Thus, we hypothesized that this correlation persists in long-term imaging of mouse xenografts being treated by anticancer agents. Accordingly, this report represents a proof-of-concept study to show the capabilities of CLI for cancer therapy monitoring. We selected bevacizumab (Avastin; Genentech/Roche) as our drug of choice because it is a well-known angiogenesis inhibitor that has been approved for the treatment of various cancers, including lung, colorectal, and kidney (14–17).
MATERIALS AND METHODS
General
All chemicals obtained commercially were of analytic grade and used without further purification. 18F-FDG and 3′-deoxy-3′-18F-fluorothymidine (18F-FLT) were produced by the Radiochemistry Facility at Stanford University. The human large cell lung cancer cell line H460 and prostate cancer cell line PC3 were obtained from American Type Culture Collection. Female athymic nude mice (nu/nu), obtained from Charles River Laboratories, Inc., were 4–6 wk old. All instruments, including reversed-phase high-performance liquid chromatography, PET dose calibrator, and tumor cell lines, are the same as described in our previous publication (18).
Tumor Models
All animal studies were performed in compliance with federal and local institutional rules for the conduct of animal experimentation. H460 cells were cultured in RPMI 1640 medium supplemented with 10% fetal bovine serum and 1% penicillin/streptomycin (Invitrogen Life Technologies). PC3 cells were cultured in F-12K (Kaighan) medium with 2 mM l-glutamine supplemented with 10% fetal bovine serum and 1% penicillin-streptomycin. Both cell lines were maintained in a humidified atmosphere of 5% CO2 at 37°C, with the medium changed every other day. A 75% confluent monolayer was detached with trypsin and dissociated into a single-cell suspension for further cell culture. Approximately 1 × 10⁶ H460 or PC3 cells suspended in phosphate-buffered saline (Invitrogen) were implanted subcutaneously in both left and right shoulders of nude mice. Tumors were allowed to grow to 150–200 mm3 (2–4 wk; 2 wk for H460, 4 wk for PC3, measured by standard caliper measurement), and the tumor-bearing mice were subjected to in vivo imaging via PET and CLI.
PET
Small-animal PET of tumor-bearing mice was performed on an R4 rodent model scanner (Siemens Medical Solutions USA, Inc.). The mice were anesthetized with 2% isoflurane (Aerrane; Baxter) and placed prone and near the center of the field of view of the small-animal PET scanner. Three-minute static scans were obtained, and the images were reconstructed by a 2-dimensional ordered-subsets expectation maximum algorithm. No background correction was performed. The method for quantification analysis of the images was the same as reported previously (18). The PET studies were performed according to the same schedule as those of CLI studies, with CLI performed immediately after the corresponding PET (Fig. 1).
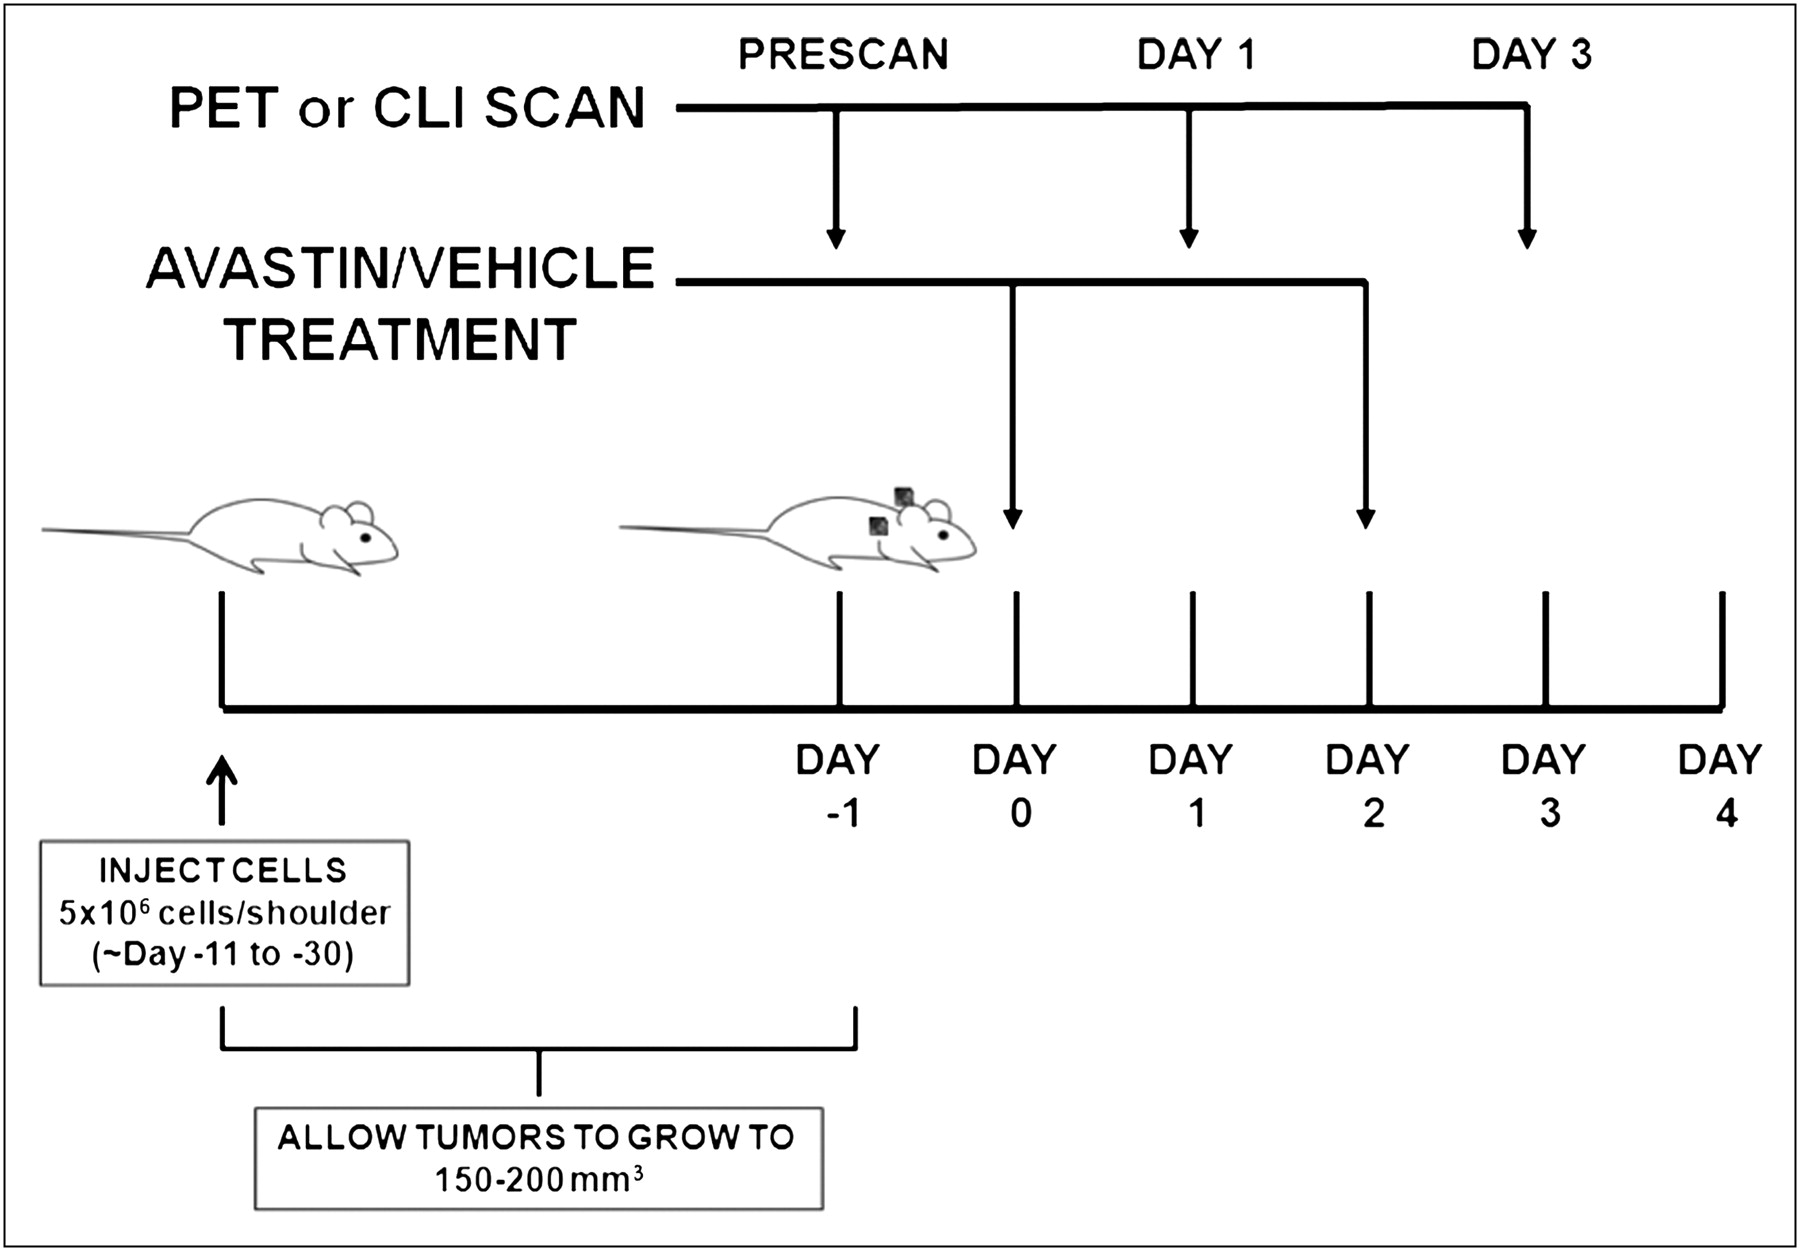
Schematic of experimental design. Tumors were implanted bilaterally in shoulder region and allowed to grow to 150–200 mm3, and tumor-bearing mice were subjected to in vivo imaging via PET and CLI at day −1, 1, and 3. Bevacizumab treatment was performed by 2 injections of 20 mg/kg at days 0 and 2. For 18F-FDG imaging study, mice were kept fasting overnight before experiment.
CLI
CLI was performed with an IVIS Spectrum system (Caliper Life Science). For all in vivo studies, radionuclides were diluted in phosphate-buffered saline. Wavelength-resolved spectral imaging was performed using an 18-set narrow-band emission filter (490–850 nm). Animals were placed in a light-tight chamber under isoflurane anesthesia. Each acquisition, with or without filters, took 1–5 min for all studies. Images were acquired and analyzed using Living Image 3.0 software (Caliper Life Sciences). The dorsal skin area was used to calculate the signal intensity of background tissue. The optical signal was normalized to photons per second per square centimeter per steradian (p/s/cm2/sr). One group of mice (n = 6) was implanted with H460 xenografts bilaterally in the shoulder region, divided into treatment and control groups (n = 3 each), injected with 18F-FLT (7.3–8.0 MBq [198–215 μCi]) via the tail vein, and imaged with PET immediately followed by CLI. Imaging studies were always done at days −1, 1, and 3 with respect to day 0, defined by the first dose of bevacizumab (Fig. 1A). Another group of mice (n = 6) was implanted with PC3 xenografts in the same locations, divided into treatment and control groups (n = 3 each), injected with 18F-FDG (6.4–7.5 MBq [174–202 μCi]) via the tail vein, and imaged by the same modalities. Bevacizumab treatment was performed by 2 injections of 20 mg/kg at days 0 and 2. For the 18F-FDG imaging study, the mice were kept fasting overnight before the experiment.
Statistical Methods
Quantitative data were expressed as mean ± SD. Means were compared using the Student t test. A 95% confidence level was chosen to determine the significance between groups, with P values of less than 0.05 indicating significant differences.
RESULTS
Tumor Growth Kinetics
The 2 tumor models, H460 and PC3, exhibited different tumor growth kinetics (Fig. 2). Measurements of the 3 dimensions of the H460 xenografts were done at days −5, −3, −1, 1, 2, 3, 4, and 5 with respect to day 0, the day of the first injection of bevacizumab. The growth kinetics plots showed that bevacizumab-treated xenografts had significantly retarded growth rates (P < 0.01, n = 6) when compared with the vehicle-administered controls (Fig. 2A). Measurements of the PC3 xenografts were performed at days −8, −4, −2, 0, 1, 2, 3, 4, and 5 with respect to day 0, and the growth kinetics plot also showed a significantly impeded (P < 0.01, n = 6) growth in the treatment group. Interestingly, the effect was more subtle than in the H460 counterpart (Fig. 2B).

(A) Tumor growth kinetics for H460 xenografts. Measurements were made at days −5, −3, −1, 1, 2, 3, 4, and 5. (B) Tumor growth kinetics for PC3 xenografts. Measurements were made at days −8, −4, −2, 0, 1, 2, 3, 4, and 5. For both figures, day 0 indicates first dose of bevacizumab.
Cancer Therapy Monitoring with CLI and PET
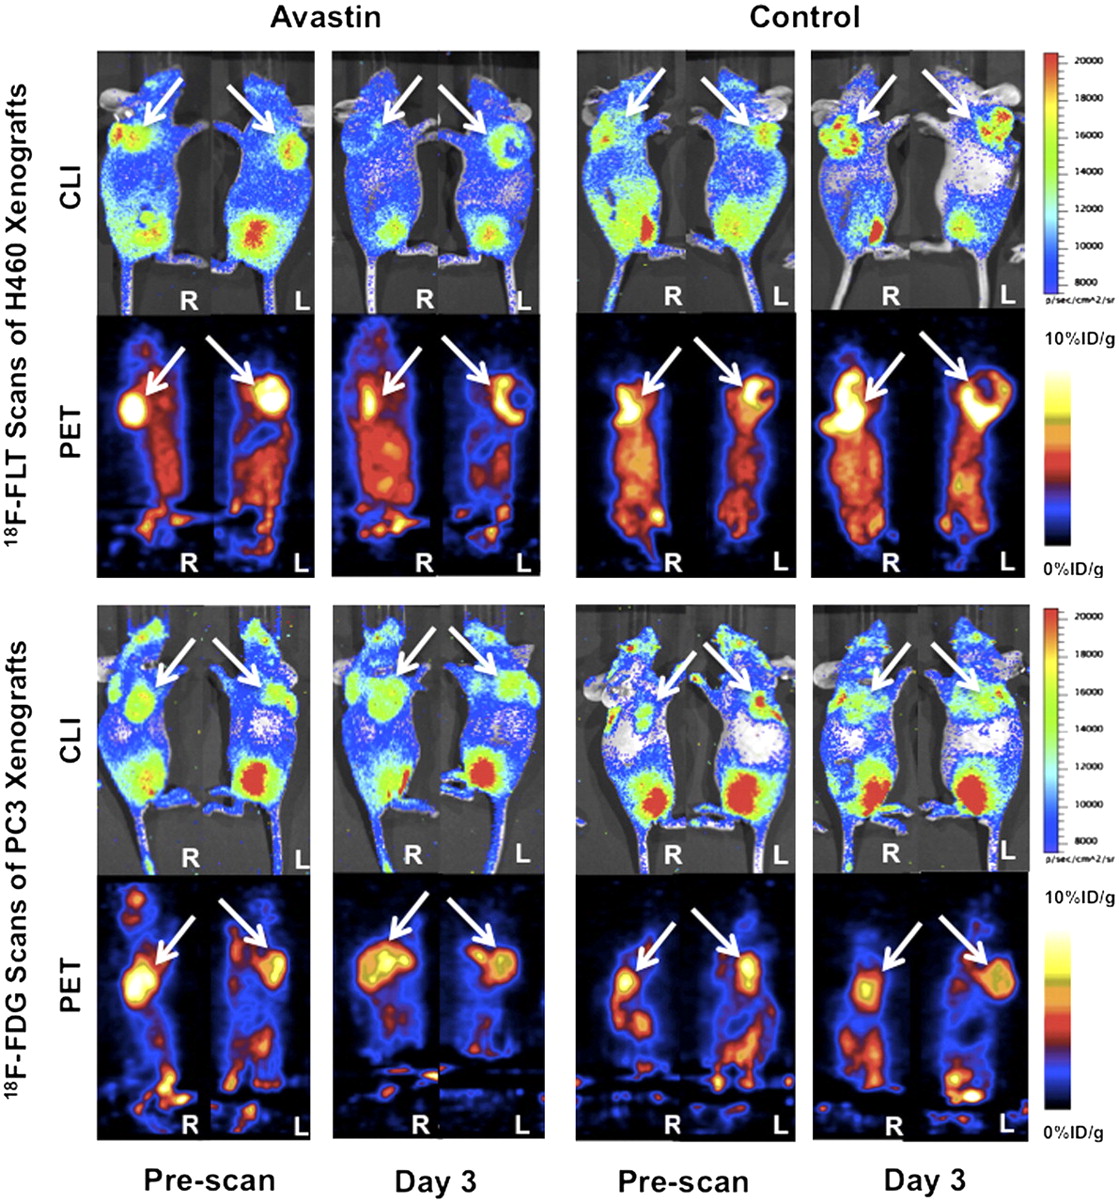
In vivo cancer therapy monitoring via CLI and PET was demonstrated using 2 well-known PET probes, 18F-FLT and 18F-FDG (Fig. 3). 18F-FLT has been widely used for imaging of tumor proliferation (19–21). On the other hand, 18F-FDG has been mostly used for imaging of tumor metabolism (22–24). H460 tumor–bearing mice were divided into treatment and control groups (n = 3 each), injected with 18F-FLT (7.3–8.0 MBq [198–215 μCi]) via the tail vein, and imaged with PET immediately followed by CLI. Bevacizumab treatment was performed by 2 injections of 20 mg/kg at days 0 and 2 for the treatment group. For 18F-FLT scans, as observed by visual inspection, a good correlation in signal exists between CLI and PET. The data revealed significantly decreased signals from H460 xenografts in treated mice up to day 3 after treatment (Fig. 3, top left). Moderately increased to unchanged signals were observed in vehicle-treated mice during the same period (Fig. 3, top right). PC3 tumor–bearing mice were also divided into treatment and vehicle control groups (n = 3 each), injected with 18F-FDG (6.4–7.5 MBq [174–202 μCi]) via the tail vein, and imaged by the same modalities. Slightly different from 18F-FLT scans of H460 xenografts, 18F-FDG scans of PC3 xenografts via both modalities showed relatively unchanged signals in both drug-treated and vehicle-administered groups (Fig. 3, bottom left and bottom right, respectively). However, good correlations according to visual inspection were observed in this group of scans. Of note, the heart, which has high signal intensity on PET scans because of its high metabolic rate, is barely visible when scanned by the IVIS Spectrum because of its deep location inside the murine body.

Comparison between Cerenkov luminescence and PET images. White arrows point to tumors in all panels. (Top left) 18F-FLT scans of representative H460 tumor–bearing mouse during bevacizumab treatment. (Top right) 18F-FLT scans of representative H460 tumor–bearing mouse of control group. (Bottom left) 18F-FDG scans of representative PC3 tumor–bearing mouse during bevacizumab treatment. (Bottom right) 18F-FDG scans of representative PC3 tumor–bearing mouse of control group. In each panel, upper row contains Cerenkov luminescence images, and bottom row contains PET images; for each row, left half contains prescans at day −3, and right half contains scans at day 3.
Quantitative analysis of both Cerenkov luminescence images and PET images was performed, and correlation analysis was also performed by fitting with linear regression (Fig. 4). R2 values were 0.9309, 0.9488, 0.9294, and 0.8880 for the H460 treatment group, H460 control group, PC3 treatment group, and PC3 control group, respectively (Fig. 4A, 4B, , and 4D, respectively). Notably, the slopes of the fits are also numerically close (1575, 1587, 1584, and 1552 for the H460 treatment group, H460 control group, PC3 treatment group, and PC3 control group, respectively), suggesting an excellent fit via linear regression, even if data of all 4 groups are conglomerated.
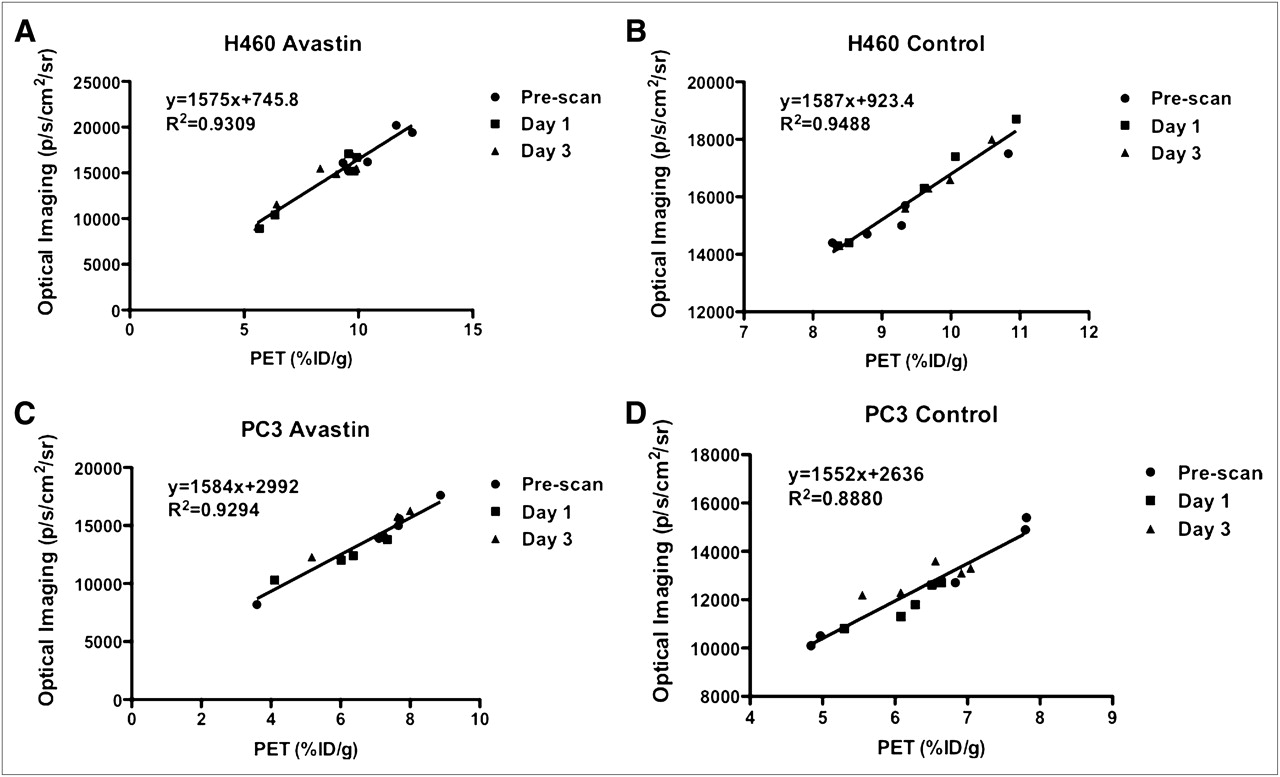
Quantitative analysis of Cerenkov luminescence and PET images and their correlation calculated through fitting by linear regression. P < 0.0001 for all 4 linear regressions. (A) H460 xenografts with bevacizumab treatment. (B) H460 xenografts of control group. (C) PC3 xenografts with bevacizumab treatment. (D) PC3 xenografts of control group.
DISCUSSION
CLI is an emergent molecular imaging technique that has many possibilities in both biomedical research and clinical applications (2,3,7,25,26). The principle of this imaging methodology is to take advantage of the intrinsic CR from certain radionuclides (including, but not limited to, both β+ and β−-emitters) to image radioactive molecular probes that are traditionally captured by PET or SPECT and use OI techniques to harvest imaging signals. CLI technology has several distinctive advantages: it is inexpensive (compared with nuclear imaging techniques), it is easier to use, it has high throughput, and, finally, it has widely available long-established optical imaging instruments. Since its inception, CLI has been quickly studied for a variety of applications including traditional molecular imaging applications such as in vivo tumor imaging (2,3), reporter gene imaging (12), and source-depth measurement/tomography (26,27). More novel applications include use of Cerenkov photons to excite fluorescent materials such as quantum dots (25,28), high-resolution imaging (29), PET/MRI/OI triple-modality imaging probe development (13), and many others. Nevertheless, there are still important potential applications of CLI that have not been explored, and preclinical cancer therapy monitoring is among the most promising possibilities of CLI.
18F-FLT and 18F-FDG are 2 well-known PET probes that have been extensively used for both preclinical and clinical applications. One prominent example is cancer therapy monitoring. We hypothesized that CLI could be an important bridge linking clinically approved radioactive probes to OI modalities for monitoring therapeutic effects of anticancer agents. Yet the effectiveness of CLI for therapy monitoring lies essentially with its quantification capability in subcutaneous tumor models; even more important is whether a good correlation exists between CLI and the gold standard nuclear imaging counterparts. Our results showed that at least for the β+-emitter 18F-based probes such as 18F-FLT and 18F-FDG, there is an excellent correlation between the quantifications of the 2 modalities, regardless of the xenografts studied or of the treatment. It is also foreseeable that other radionuclides that have been shown to emit significant CR photons can be used to monitor cancer therapies because the fundamental mechanism of CLI remains the same regardless of the radionuclides.
In the previous sections, we outlined the advantages of using CLI to monitor therapeutic effects. Intrinsic features such as low cost, high sensitivity, short acquisition time, high throughput, and a relatively flat learning curve can benefit the labors of researchers and clinicians alike. Especially in time-consuming, large-scale projects such as drug screening, the efficiency that OI brings can be paramount. There is also an abundance of radioactive probes that are currently approved by the Food and Drug Administration and available for therapy monitoring. By way of contrast, there are only a limited number of approved OI agents. One can foresee that not only β+-emitters but also clinically important β−-emitters such as 32P, 90Y, and 131I can be imaged via CLI, either for therapy monitoring or for several other potential applications. Yet another advantage of CLI lies in its versatility when compared with traditional imaging modalities such as bioluminescence imaging. CLI not only allows for concurrent PET but also eliminates the need for reporter delivery, which is essential in bioluminescence imaging. This difference becomes particularly important in potential clinical applications for which reporter gene imaging can be cumbersome whereas CLI simply requires an injection of radioactive probes. In general, however, bioluminescence imaging is more sensitive than CLI (2).
Although CLI therapy monitoring enjoys many advantages over traditional nuclear imaging modalities, the requirement of OI also poses some inevitable limitations that are intrinsic to optical imaging as well. Optical signal attenuation and scattering in living animals along with the particular spectrum of CR always result in reduced signal intensity—the deeper the source of the signal, the lower the sensitivity and the poorer the quantification of CLI. Yet in typical preclinical drug-screening applications, one can largely avoid these shortcomings using subcutaneous xenografts in small animals, much like the models used in this study. In clinical situations, superficial disease processes such as dermatologic neoplasms and inflammations can also be imaged by CLI during treatment if deemed necessary by clinicians. More importantly, deep disease processes accessible by techniques based on charge-coupled device or fiber optic cameras, such as endoscopies and colonoscopies, can be potentially monitored with high sensitivity and quantification capability by CLI as well. Furthermore, intraoperative CLI has also been envisioned and is currently being actively explored. Holland et al. recently published an interesting piece of research demonstrating image-guided intraoperative resection of tumors from murine models (30). It is thus foreseeable that in the near future intraoperative CLI can benefit surgeons by providing real-time anatomic and functional information about tumors and metastases.
CONCLUSION
CLI and PET exhibit excellent correlations across different tumor xenografts and radiotracers in both treated and untreated mice by bevacizumab. To the best of our knowledge, this is the first study to demonstrate the use of CLI for monitoring cancer treatment. The findings warrant further exploration and optimization of CLI as a less expensive, easier-to-use, and high-throughput alternative to PET in preclinical therapeutic monitoring studies and drug-screening processes.
DISCLOSURE STATEMENT
The costs of publication of this article were defrayed in part by the payment of page charges. Therefore, and solely to indicate this fact, this article is hereby marked “advertisement” in accordance with 18 USC section 1734.
Acknowledgments
We acknowledge support from the National Cancer Institute (NCI) R01 CA128908 and Stanford Medical Scholar Research Fellowship. No other potential conflict of interest relevant to this article was reported.
Footnotes
↵* Contributed equally to this work.
Published online Jan. 12, 2012.
- © 2012 by the Society of Nuclear Medicine, Inc.
REFERENCES
- Received for publication June 20, 2011.
- Accepted for publication September 7, 2011.


Jump to section
Related Articles
Cited By...
- Detection of Shortwave-Infrared Cerenkov Luminescence from Medical Isotopes
- Optimal Scheduling of Bevacizumab and Pemetrexed/cisplatin Dosing in Non-Small Cell Lung Cancer
- {beta}-Radioluminescence Imaging: A Comparative Evaluation with Cerenkov Luminescence Imaging
- Intratherapeutic Biokinetic Measurements, Dosimetry Parameter Estimates, and Monitoring of Treatment Efficacy Using Cerenkov Luminescence Imaging in Preclinical Radionuclide Therapy
- Relaxin receptor antagonist AT-001 synergizes with docetaxel in androgen-independent prostate xenografts
- Clinical Cerenkov Luminescence Imaging of 18F-FDG
- Intraoperative Imaging of Tumors Using Cerenkov Luminescence Endoscopy: A Feasibility Experimental Study