


Abstract
The dedicated murine PET (MuPET) scanner is a high-resolution, high-sensitivity, and low-cost preclinical PET camera designed and manufactured at our laboratory. In this article, we report its performance according to the NU 4-2008 standards of the National Electrical Manufacturers Association (NEMA). We also report the results of additional phantom and mouse studies. Methods: The MuPET scanner, which is integrated with a CT camera, is based on the photomultiplier-quadrant-sharing concept and comprises 180 blocks of 13 × 13 lutetium yttrium oxyorthosilicate crystals (1.24 × 1.4 × 9.5 mm3) and 210 low-cost 19-mm photomultipliers. The camera has 78 detector rings, with an 11.6-cm axial field of view and a ring diameter of 16.6 cm. We measured the energy resolution, scatter fraction, sensitivity, spatial resolution, and counting rate performance of the scanner. In addition, we scanned the NEMA image-quality phantom, Micro Deluxe and Ultra-Micro Hot Spot phantoms, and 2 healthy mice. Results: The system average energy resolution was 14% at 511 keV. The average spatial resolution at the center of the field of view was about 1.2 mm, improving to 0.8 mm and remaining below 1.2 mm in the central 6-cm field of view when a resolution-recovery method was used. The absolute sensitivity of the camera was 6.38% for an energy window of 350–650 keV and a coincidence timing window of 3.4 ns. The system scatter fraction was 11.9% for the NEMA mouselike phantom and 28% for the ratlike phantom. The maximum noise-equivalent counting rate was 1,100 at 57 MBq for the mouselike phantom and 352 kcps at 65 MBq for the ratlike phantom. The 1-mm fillable rod was clearly observable using the NEMA image-quality phantom. The images of the Ultra-Micro Hot Spot phantom also showed the 1-mm hot rods. In the mouse studies, both the left and right ventricle walls were clearly observable, as were the Harderian glands. Conclusion: The MuPET camera has excellent resolution, sensitivity, counting rate, and imaging performance. The data show it is a powerful scanner for preclinical animal study and pharmaceutical development.
Small-animal PET has been widely used in a broad range of applications in the field of biology and pharmaceutical development (1). Because of the small physical dimensions of rodents, achieving spatial resolution and detection sensitivity adequate to study small structures and the low concentration of receptors is challenging. In addition, to make the in vivo molecular imaging capability of PET accessible to more biology and genetics laboratories, thus facilitating the integration of biologic research and clinical medicine, lower camera-production costs are also needed.
A preclinical dedicated murine PET (MuPET) camera has been designed and constructed at the University of Texas M.D. Anderson Cancer Center (2). It has been integrated with a CT camera into a compact gantry. The MuPET camera combines the advantages of a lower production cost with high resolution and high sensitivity. In this work, we report on the scanner’s performance based on the NU 4-2008 standards of the National Electrical Manufacturers Association (NEMA) (3) and on the imaging of additional phantoms and mice.
MATERIALS AND METHODS
PET Camera Description
The PET component of the MuPET/CT system uses small cerium-doped lutetium yttrium oxyorthosilicate (LYSO) crystals (Crystal Photonics, Inc.) and is based on the low-cost photomultiplier-quadrant-sharing (PQS) method that we have developed and refined over several years (4–8). MuPET comprises 180 blocks of 13 × 13 LYSO crystals and 210 photomultipliers.
For the production of the detector blocks, we have invented a high-precision and low-labor detector-block production method we named the slab-sandwich-slice (SSS) method (6,9). Figure 1A shows a drawing of the SSS technique for the production of blocks. For the MuPET camera, 13 LYSO slabs were glued together to form 1 sandwich. Enhanced Specular Reflector mirror-film (3M Optical Systems Division) was used as a reflector between crystals. The mirror-film size and shape depended on the location and orientation of the crystals in the block. In this method, because the light-reflecting region can be cut into any size and shape, very fine light control is possible. Several types of sandwich were made, and each had a unique reflective pattern. Those sandwiches were then cut into 1.4-mm-thick slices with a crystal-slicing machine. Thirteen slices of different types were then selected and glued together with another set of reflective mirror-film, with a specific pattern placed between them. Because the SSS method creates internal light-guides within a PQS block, no external light-guide is required, thus eliminating the external light-guide expense, increasing the light yield, and improving the energy resolution and timing of the system.
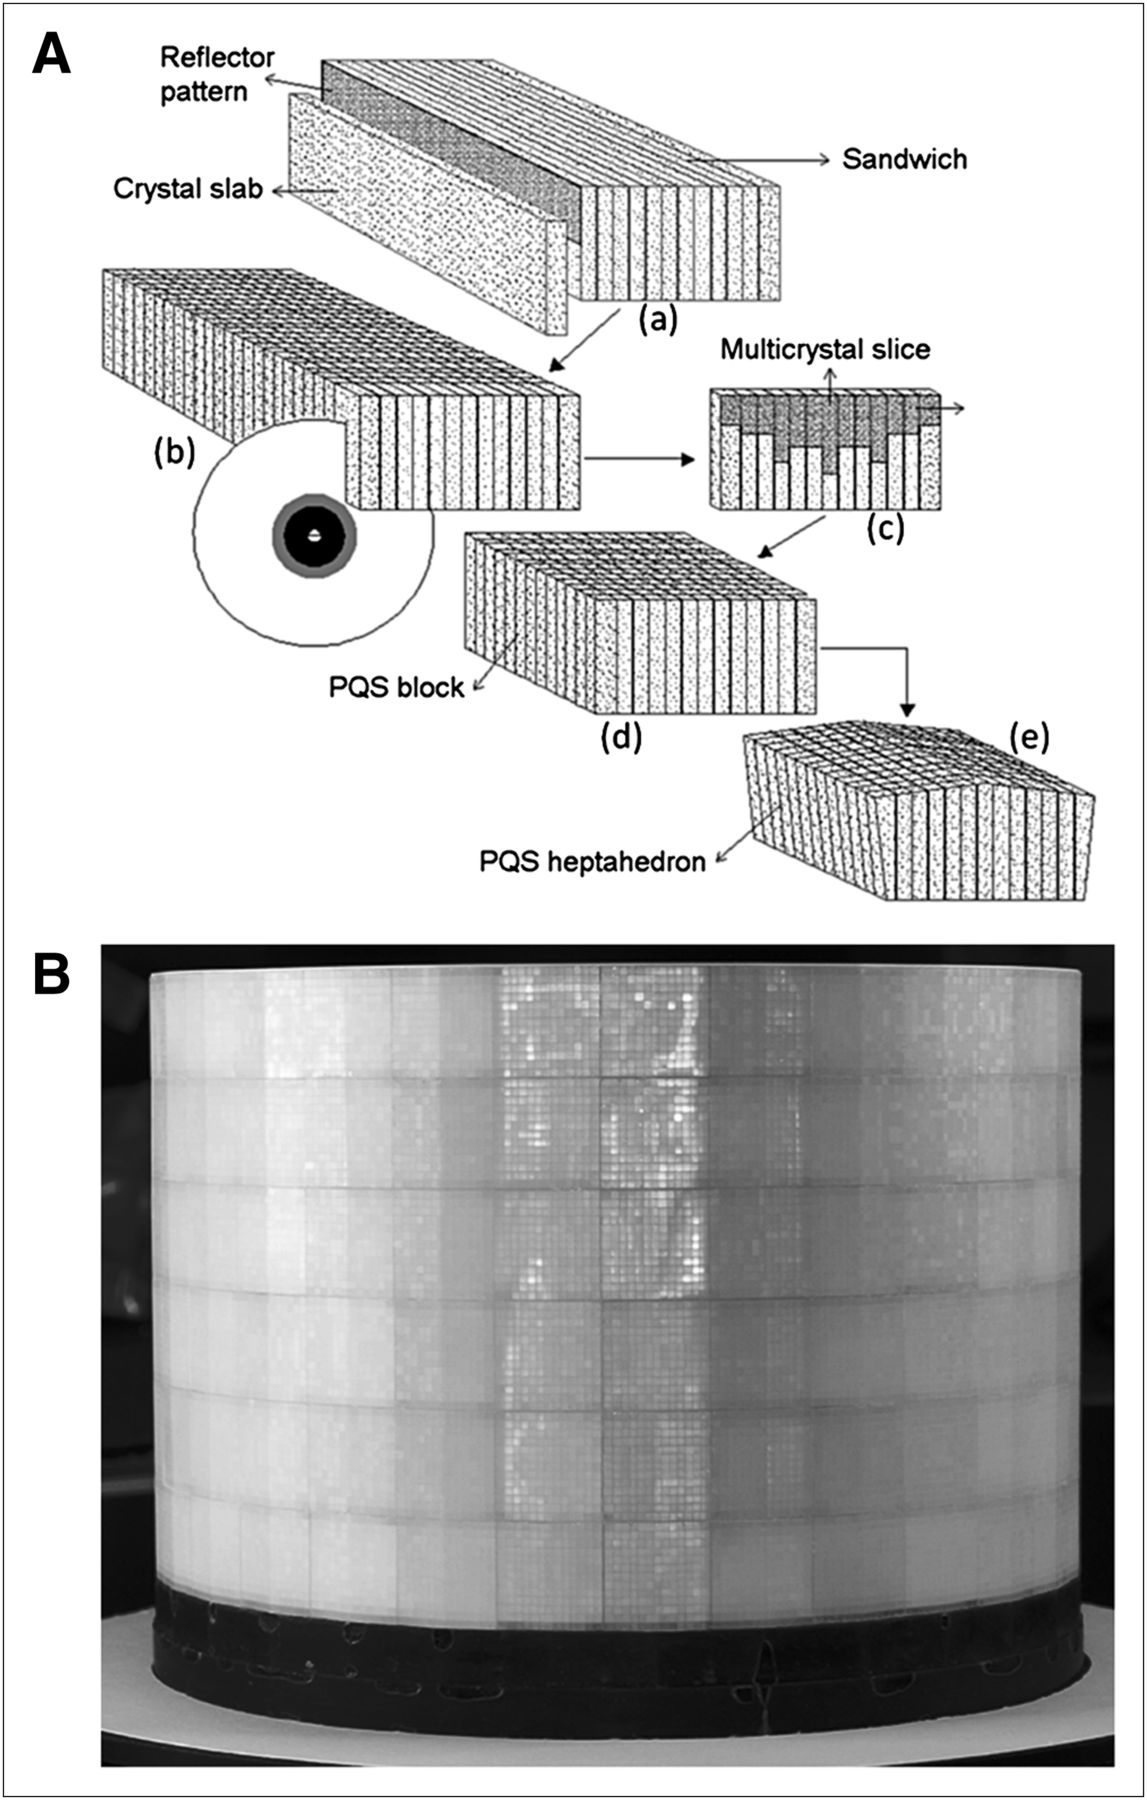
(A) Drawing of SSS technique for production of blocks: 13 crystal slabs and 12 film reflectors are sandwiched together using optical glue (a); sandwich is cut (b) into multicrystal slices (c); square block is made by gluing together 13 multicrystal slices and 12 film reflector patterns (d); and square block is ground on 4 sides with taper angle of 6° to produce heptahedron block (e). (B) Image of solid MuPET detector ring with 30,420 small LYSO crystals.
The MuPET system is a solid no-gap multiring detector in which photomultiplier tubes (PMTs) are directly coupled to blocks. Figure 1B shows a photo of the solid detector ring. To circularize the PQS design, which requires that 2 adjacent blocks share the same PMT, each detector block is ground to a heptahedron (9). On the circular dimension, the last 2 rows of crystals are also ground to a slight taper. With tapered-end crystals in each block, all the adjacent blocks are glued together to form the solid cylindric ring, thus providing 95% packing with a high detection sensitivity. The average dimensions of the crystals in a heptahedron block are 1.24 mm transaxially, 1.4 mm axially, and 9.5 mm radially. The PET camera has a ring diameter of 16.6 cm and consists of 78 detector rings with an axial field of view (FOV) of 11.6 cm. Table 1 summarizes some of the basic geometric parameters of the MuPET camera in comparison with 3 of the latest generation of commercially available small-animal PET cameras (10–12).
Comparison of Specifications of MuPET with 3 Other Preclinical PET Cameras
We have also developed special low-noise and low-dead-time electronics for the MuPET camera. Our homemade electronics include 210 gain-programmable PMT dividers, 1 analog preprocessing board, and 3 field-programmable gate array (FPGA)–based event-position decoding boards. The FPGA-based decoding boards consist of 72 digital high-yield-pileup-event-recovery channels (13), 72 fast analog-to-digital converters (ADC) (125 Msps, 10-bit), 72 statistics-based baseline restorers, 30 ultra-fast time-to-digital converter (TDC) and local analog triggers for dynamic block decoding, and on-board downloadable flash memory for crystal identification and crystal-based timing correction (14).
Energy and Time Resolutions
The energy resolution was measured for each crystal in the PET camera using a 68Ga radiation source (511 keV). The resolution was calculated as the full width at half maximum (FWHM) of the 511-keV energy peak divided by the value of the photopeak center. The energy resolution of the MuPET system was calculated as the mean value of the energy resolutions of all crystals in the camera. For this and all other measurements, the energy window was set to 350–650 keV, and the coincidence timing window was set to 3.4 ns.
The MuPET camera has time-of-flight capability (15); thus, we measured the system time resolution by placing a point source at the center of the camera and measuring the FWHM of the time-of-flight histogram, even though we did not use the time-of-flight information for this work.
Spatial Resolution
The spatial resolution was measured using a 22Na point source (Isotope Products Laboratories–Eckert & Ziegler Co.). The 22Na source, which was embedded in an acrylic cylinder, had a nominal diameter of 0.25 mm and an activity of 0.52 MBq. Spatial resolution was measured at the center of the FOV and at one fourth of the axial FOV for several different radial distances (0, 2, 5, 10, 15, 20, 30, and 40 mm) from the center. The list-mode data acquired for each source location were first sorted into 3-dimensional (3D) sinograms, with random coincidence events subtracted. The radial bin size was 0.27 mm, and the angular bin size was 0.88 degrees. The 3D sinograms were then rebinned into 2-dimensional (2D) sinograms using the single-slice-rebinning method (16) and then reconstructed by the 2D filtered backprojection method using a ramp filter with cutoff set at the Nyquist frequency. One-dimensional response functions parallel to the radial, tangential, and axial directions were formed to calculate the resolutions. The response functions were formed by summing all 1-dimensional profiles that were parallel to the direction of measurement and within 2 times the FWHM of the orthogonal directions according to the NU 4-2008 standards of the NEMA. The reported spatial resolutions were not corrected for the source size.
We also used a resolution-recovery method to improve the spatial resolution of the system. The resolution-recovery method used for this work is based on a sinogram-restoration technique using an iterative algorithm (17,18). In this method, the assumption is that the measured sinogram (g) is the result of the convolution of a true sinogram (p) with a point-spread function (h). Sinogram restoration was achieved using the following iterative equation (17):
In our implementation, data were first normalized before using the sinogram-restoration method. Because resolution recovery is applied to sinograms before image reconstruction, restored sinograms could be used by any reconstruction technique. The spatially variant point-spread function used in the calculation was generated by a Monte Carlo simulation modeling the geometry of the MuPET scanner.
Sensitivity
The absolute sensitivity of the camera was measured with the same 22Na point source as that used in the spatial-resolution measurements. The source was positioned at the center of the camera and scanned for 1 min. The sensitivity profile was also measured by stepping the point source axially through the scanner in 0.74-mm steps and collecting data for 1 min in each position. The average absolute sensitivities for mouse- and rat-sized objects were calculated from the sensitivity profile data by calculating the average sensitivity for all slices that encompassed the central 7 cm and the whole axial length (11.6 cm) of the camera, respectively. Because LYSO scintillator crystals have intrinsic radioactivity, background was measured (without any source) and subtracted from the data acquired with the 22Na source.
Scatter Fraction (SF) and Counting Rate Performance
The system SF and the noise-equivalent counting rate (NECR) were measured for 2 cylindric polyethylene phantoms recommended by the NU 4-2008 standards of the NEMA to simulate the geometries of a mouse and rat. The mouselike phantom was a 70-mm-long solid cylinder with a 25-mm diameter and a cylindric hole with a diameter of 3.2 mm that was drilled parallel to the central axis at a radial distance of 10 mm. The ratlike phantom had a geometry similar to the mouselike phantom but with a diameter of 50 mm, length of 150 mm, and the 3.2-mm-diameter hole drilled at a radial offset of 17.5 mm.
For these measurements, the initial 18F-FDG activity in the tube was about 76 MBq for the mouselike phantom and 78 MBq for the ratlike phantom. For each measurement, the phantom was positioned at the center of the FOV, and data were collected for 5-min frames as the activity decayed. For each 5-min acquisition, the list-mode collected data were first sorted into 3D sinograms, with no corrections applied, and then rebinned into 2D sinograms by the single-slice-rebinning method. The intrinsic (background) counts due to activity of LYSO crystals were measured and subtracted from the data.
The NECR for each of the 5-min-frame acquisitions was determined using the following equation:
For SF calculation, the last acquisition—for which the count-loss rate and the random rate were negligible (<1% of the true events)—was used for each phantom. The SF was calculated using the following equation:
Imaging Studies
NEMA Phantom Study
The scanner image quality was evaluated by imaging the NEMA NU 4-2008 image-quality phantom (3). This phantom has the following 3 regions: a fillable uniform cylinder chamber (diameter, 30 mm; length, 30 mm); a region containing 2 cold-region chambers (each chamber is a 15-mm-long hollow cylinder with an inner diameter of 8 mm), one filled with nonradioactive water and the other filled with air; and a solid acrylic region (diameter, 30 mm; length, 20 mm) with 5 fillable rods drilled through (at a radius of 7 mm) with diameters of 1, 2, 3, 4, and 5 mm. The image-quality phantom was filled with 3.8 MBq of 18F-FDG solution, and data were acquired for 20 min.
The percentage SD was measured for a 10-mm-long cylindric volume of interest with a 22.5-mm diameter drawn over the center of the image-quality phantom.
To measure the recovery coefficient, the image slices covering the 10-mm central portion of the length of the rods were averaged to reduce the noise. Regions of interest were drawn around the rods with diameters twice the physical diameters of the rod to find the maximum values. The locations with maximum region-of-interest values were used to create the line profiles along the rods in the axial direction. The recovery coefficient for each rod was defined as the average pixel value of the linear profile divided by the average pixel value of the uniform region.
To calculate the spillover ratio, a cylindric volume of interest with a diameter of 4 mm and length of 7.5 mm was drawn over the center of each of the air- and water-filled chambers. The ratio of the mean in each cold region to the mean of the hot uniform area was reported as the spillover ratio.
Micro Deluxe and Ultra-Micro Hot Spot Phantom Studies
In addition to the NEMA image-quality phantom, we also scanned a Micro Deluxe phantom and an Ultra-Micro Hot Spot phantom (both from Data Spectrum Corp.). The Micro Deluxe phantom is a cylinder with an inside diameter of 4.5 cm that can accommodate hot or cold rod inserts. We used the hot rods, which are grouped into sectors with diameters of 4.8, 4.0, 3.2, 2.4, 1.6, and 1.2 mm and lengths of 34 mm each. The Ultra-Micro Hot Spot phantom is a cylinder (inner diameter, 2.8 cm), with a hot-rod (hollow channels) insert. The rods are grouped into sectors with diameters of 2.0, 1.7, 1.35, 1.0, and 0.75 mm and lengths all 9.9 mm. For both phantoms, the center-to-center distance between rods in each sector is twice that of the rod diameters in that sector.
For all 3 phantoms, images were reconstructed with the 3D reprojection method (19,20) using a ramp filter. Data were corrected for normalization, random coincidences, and attenuation but not for scatter coincidences. For normalization correction we used a self-normalization method (21,22), for random we used a delayed window to measure the random contribution, and attenuation was calculated assuming a uniform attenuation with an attenuation coefficient equivalent to that of water.
Mouse Studies
We extended the study to include scans of 2 healthy athymic nude mice injected with 18F-FDG. The first mouse (weight, 25 g; female) was injected with 29 MBq of 18F-FDG and scanned 2 h later for 20 min. This mouse was anesthetized with a ketamine–xylazine–atropine cocktail (100 mg/kg, 25 mg/kg, and 2.5 mg/kg, intraperitoneally), was kept fasting after injection, and was kept warm during the scan. The second mouse (weight, 28 g) was injected with 17.4 MBq of 18F-FDG and scanned 1 h later for 20 min. The second mouse was not kept fasting, was anesthetized using isoflurane (2% delivered using a vaporizer), and was kept warm during the scan. For each study, the mouse was scanned first with the PET camera and then with the CT scanner. For these studies, all experimental procedures were approved by the Animal Care and Use Committee of M.D. Anderson Cancer Center and were conducted in adherence with the Animal Welfare Act and Public Health Service policy. The PET data were reconstructed using the 3D ordered-subset expectation maximization algorithm (23,24).
RESULTS
Energy and Time Resolutions
The energy resolution of the 511-keV photopeak for the whole system, based on the average of every crystal detector in the scanner, was 14%, with the best and worst energy resolutions of 12% and 18%, respectively. The system timing resolution was about 600 ps.
Spatial Resolution
The radial, tangential, and axial resolutions (FWHM) of the reconstructed point source images, using the single-slice-rebinning and 2D filtered backprojection methods, at the center of the FOV were 1.25, 1.14, and 0.94 mm, respectively. The spatial resolutions in terms of FWHM and full width at tenth maximum are presented in Table 2 for several different radial distances from the center. The radial and tangential resolutions improved to 0.86 and 0.75 mm, respectively, when the resolution-recovery method with the point-spread function information was used (17). Results for the resolution-recovery method are presented in Table 3. The recovery resolutions in the transverse plane were below 1 mm near the center of the FOV and remained under 1.25 mm within the central 6-cm transaxial FOV.
Radial, Tangential, and Axial Spatial Resolutions as Function of Radial Offset
Radial and Tangential Spatial Resolutions for Resolution Recovery Method as Function of Radial Offset
Sensitivity
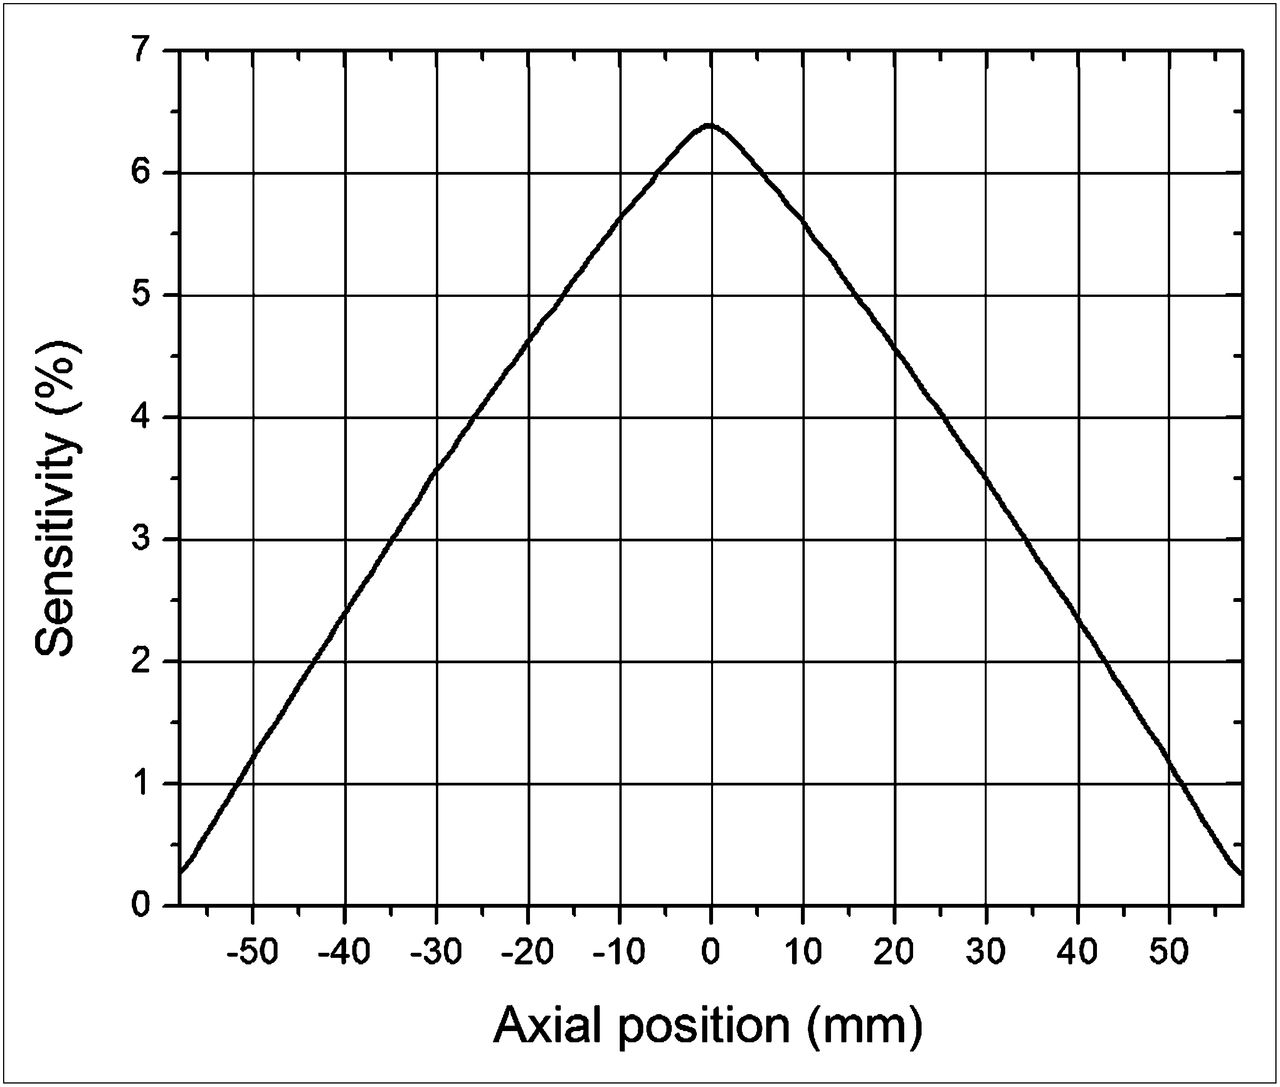
The absolute sensitivity measured with the 22Na point source in the center of the FOV was 6.38% for the energy window of 350–650 keV and coincidence timing window of 3.4 ns. No correction for sensitivity loss due to photon attenuation in the source itself was done. The axial sensitivity profile, measured with the 22Na point source, is shown in Figure 2. The average absolute sensitivities for the central mouse-sized and rat-sized regions were 4.79% and 3.56%, respectively.

Axial sensitivity profile measured with 22Na point source moving along central axis of scanner.
SF and Counting Rate Measurements
The SF was 11.9% for the mouselike phantom and 28% for the ratlike phantom. The counting rate performance plots for total, true, random, and scatter coincidences for both mouse- and ratlike phantoms are shown in Figure 3. The measured NECR as a function of the total activity is plotted in Figure 4 for the 2 phantoms. The maximum (peak) value of the NECR was 354 kcps at an activity of 63 MBq for the ratlike phantom. For the mouselike phantom, the peak value was 1,100 kcps at a total activity of 57 MBq.

Counting rate performance plots as function of total activity for mouselike (A) and ratlike (B) phantoms.

NECR as function of total activity for mouse- and ratlike phantoms.
Imaging Studies
NEMA Phantom Study
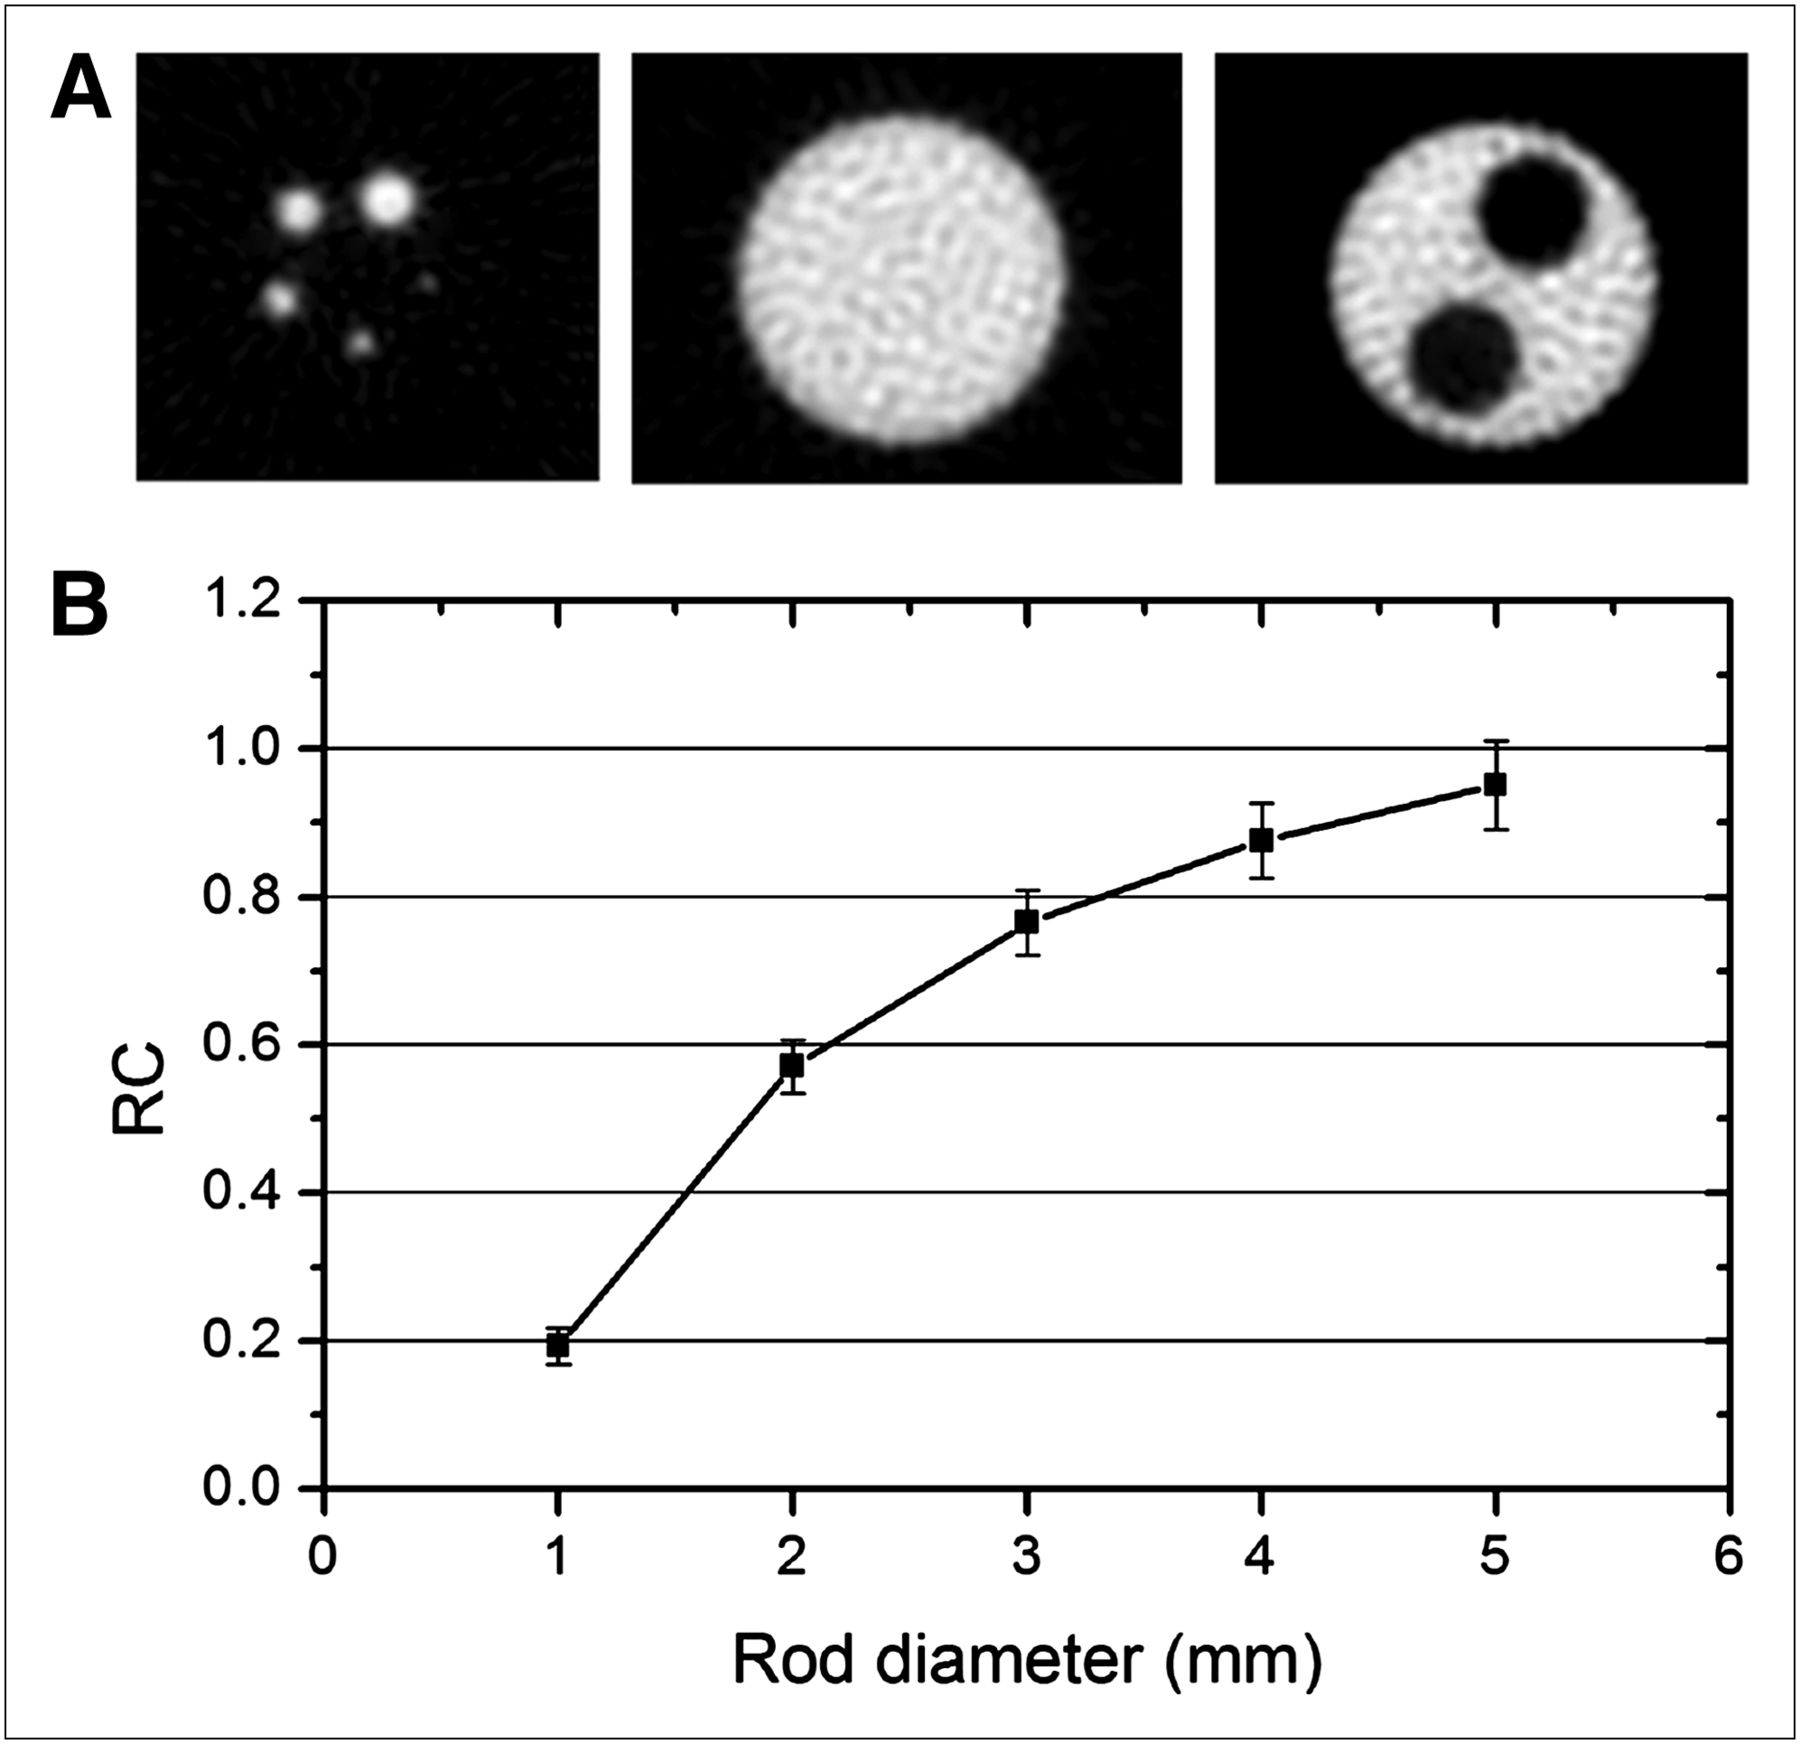
Figure 5A shows the NEMA image-quality phantom images for 3 transverse planes in the 5-rod region, the uniform region, and the 2-chamber region. All 5 rods, including the 1-mm rod, were observable. The uniform region had a 6.5% SD. The maximum and minimum pixel values in the uniform region of the reconstructed image were 0.56 and 0.30, respectively. The recovery coefficients for the 5 different rods are shown in Figure 5B. The recovery coefficient for the smallest 1-mm rod was 0.19, and for the largest 5-mm rod it was 0.95. The spillover ratio was 0.05 for the air-filled chamber and 0.09 for the water-filled chamber. These values represent the contribution from spillover and scattered events in the reconstructed image of the phantom.

(A) Transverse images of NEMA NU 4-2008 image-quality phantom in 5-rod region (left), uniform region (middle), and 2-chamber region (right). (B) Recovery coefficients of 5 rods as function of rod diameter. RC = recovery coefficient.
Micro Deluxe and Ultra-Micro Hot Spot Phantom Studies
A transaxial image of the Micro Deluxe phantom is shown in Figure 6A, and an image of the Ultra-Micro Hot Spot phantom is shown in Figure 6B. In the Micro Deluxe images, all hot rods, including the smallest 1.2-mm rods, were visually separated. For the Ultra-Micro phantom, the rods (diameter, ≥1.0 mm) were clearly distinguishable.
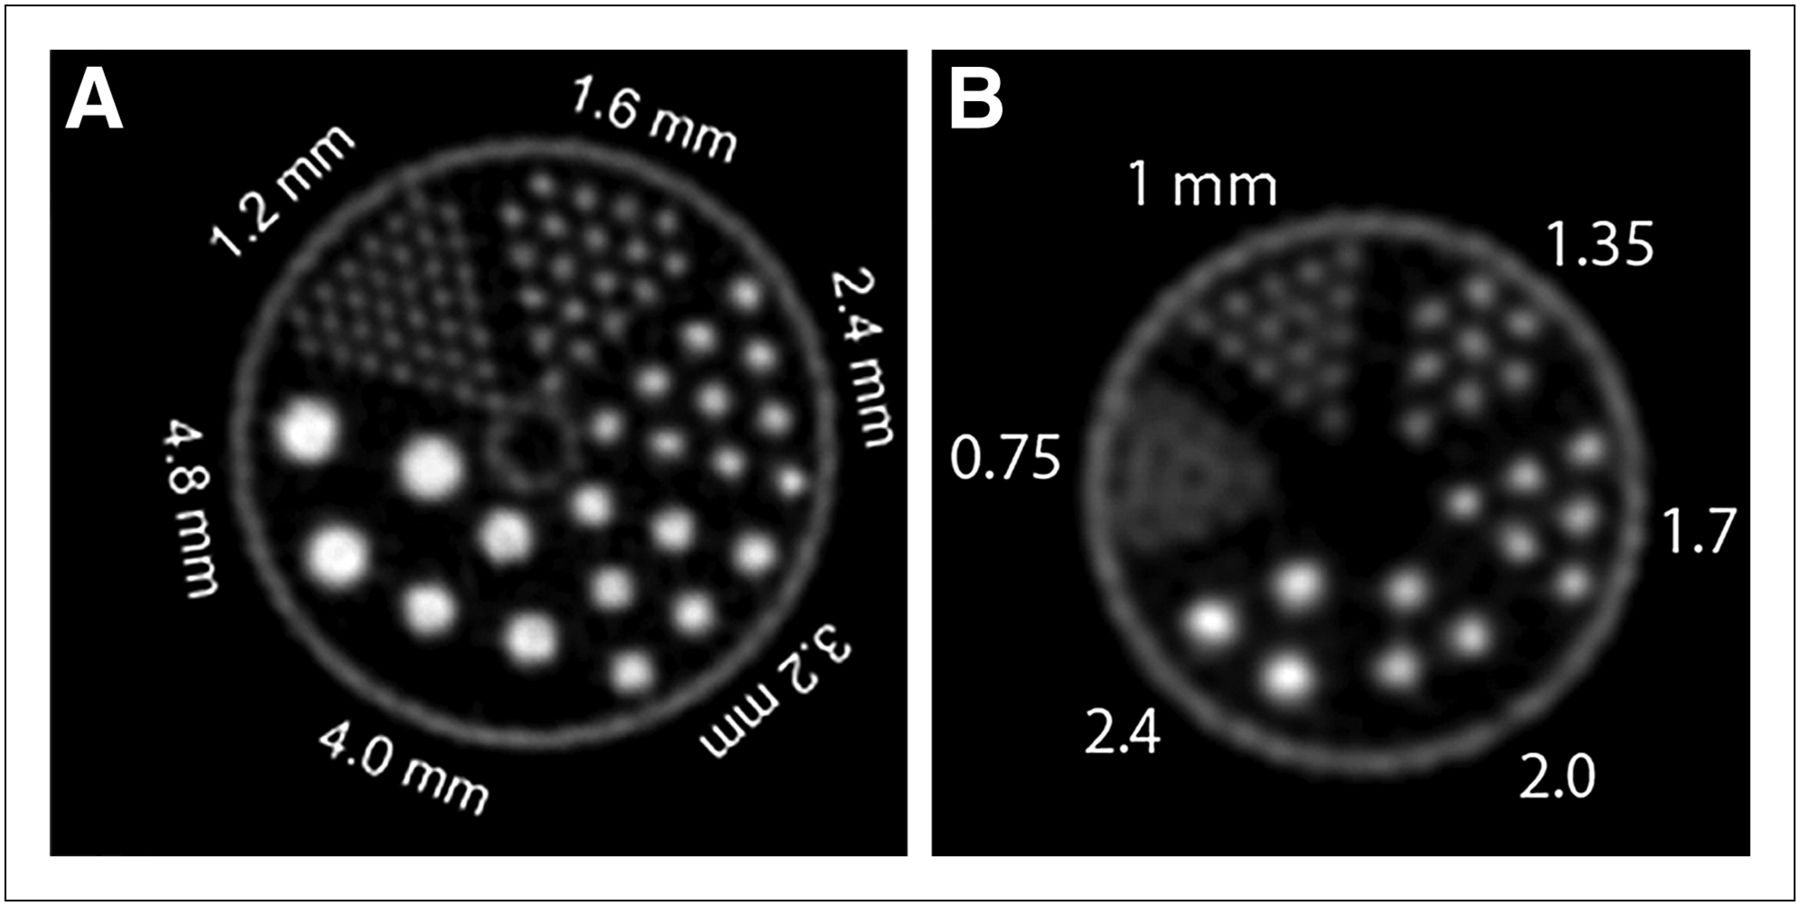
Transverse images of Micro Deluxe (A) and Ultra-Micro Hot Spot (B) phantoms. Diameter of hot rods for each rod sector is indicated in figure. The 1-mm rods were well resolved.
Mouse Studies
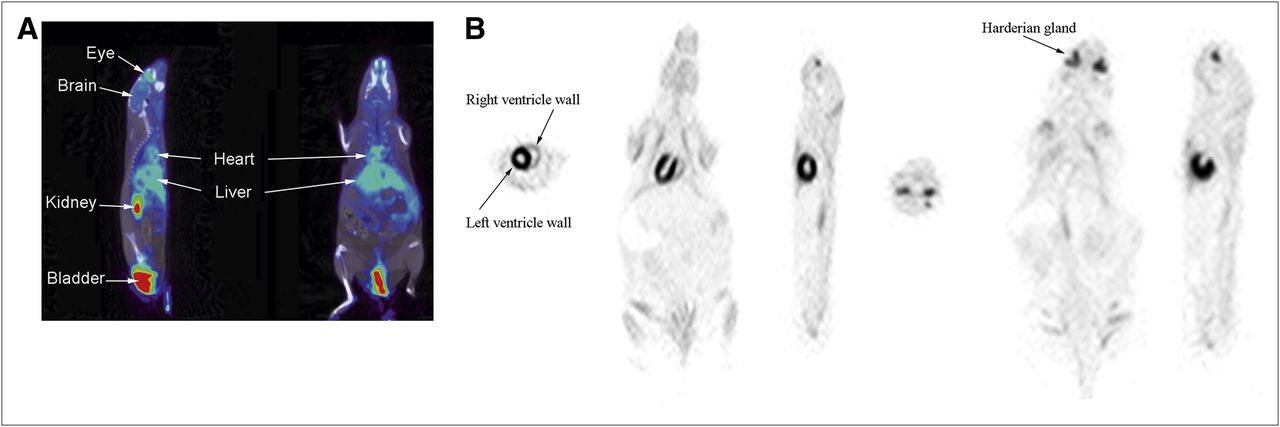
Figure 7A shows the sagittal and coronal views of the first mouse images acquired with 18F-FDG and using ketamine for anesthesia. The PET images are fused with the CT images. Figure 7B shows images of the second mouse acquired with 18F-FDG and using isoflurane for anesthesia. In the images of the second mouse, the heart was clearly distinguishable and the ventricular walls were resolved, as were the Harderian glands.

Nongated images of 2 healthy mice: sagittal and coronal slices of first mouse fused with CT images (A); transverse, coronal, and sagittal slices of second mouse (B) showing heart and Harderian glands. Both mice were injected with 18F-FDG. First mouse was anesthetized with ketamine–xylazine–atropine cocktail. Second mouse was anesthetized with isoflurane.
DISCUSSION
We evaluated the performance of the MuPET preclinical PET system using the NU 4-2008 standards of the NEMA and performing additional phantom and mouse studies. This camera incorporates the PQS method—which maximizes the number of crystals per photomultiplier that can be decoded, thus improving the spatial resolution—and uses regular PMTs, thus reducing the production cost of the camera. In addition, the system uses the SSS block production method to create internal light-guides within a PQS block, eliminating the need for an external light-guide, thus reducing the camera production cost, and increasing the light yield. An increased light yield improves energy resolution and timing for better detector performance. The camera also uses high-yield-pileup-event-recovery electronics to improve its counting rate performance.
The NEMA standards provide tools for comparison of PET cameras under relatively similar operating conditions. There are no previous evaluation studies of the MuPET scanner. Thus, we have compared its performance with the performances published for 3 of the latest commercially available small-animal PET cameras with comparable characteristics (Inveon [Siemens Preclinical Solutions, Inc.], NanoPET/CT [Bioscan Inc., manufactured by Mediso, Ltd.], and Triumph PET/SPECT/CT [Gamma Medica, Inc.]). The basic specifications of these cameras are given in Table 1. Because there are some minor differences among the operating conditions of these cameras, such as energy window, coincidence timing window, and source geometries, the comparison cannot be exact.
Spatial resolution and sensitivity are the most important design requirements for small-animal PET cameras because of the small structures of rodents and small volume of tracer that can be injected. For the MuPET scanner, the radial resolution near the center of the transaxial FOV was about 1.2 mm, degrading to about 2.6 mm at a 40-mm radial distance from the center, whereas the tangential resolution changed only modestly over the whole transaxial FOV. These characteristics can be attributed to the depth of interaction effect, which results in larger parallax errors and degradation of the radial resolution. The radial and tangential resolutions improved to 0.86 and 0.75 mm, respectively, at the center of the camera and degraded only to 1.3 and 1.1 mm at 40 mm off the center, respectively, using a resolution-recovery technique.
The spatial resolution of the MuPET near the center of the camera was better than that of the Inveon (~1.5 mm as reported by Constantinescu et al. (25) or 1.8 mm as reported by Bao et al. (10)). The resolution of the MuPET was also better than that of the LabPET-8 (1.7 mm) (12), and it was slightly higher than the 1-mm resolution of the NanoPET (11) but slightly lower with the resolution-recovery method. The better spatial resolution of the MuPET than of the Inveon and LabPET-8 can be attributed primarily to the MuPET’s smaller crystals and to its better light distribution inside the blocks. The improvement in spatial resolution clearly showed up in images of the NEMA image-quality, Micro Deluxe, and Ultra-Micro Hot Spot phantoms, for which the 1-mm rods were clearly observable.
The absolute sensitivity of the MuPET was 6.38%, which is similar to the 6.25% average value reported for the Inveon for similar energy and timing windows (5.75% reported by Constantinescu et al. (25) and 6.74% reported by Bao et al. (10)). The NanoPET/CT sensitivity is reported (11) to be about 4.67% for similar energy and timing windows.
The MuPET peak NECR value was 1,100 kcps for the mouselike phantom and 345 kcps for the ratlike phantom—lower than for the Inveon (1,670 and 590 kcps, respectively) (10). The lower peak values of the MuPET were due mainly to the slow transfer and writing speed of data to the hard drive. The NECR generally peaks at a much higher activity than the typical injection activity in laboratory studies. The injected activity in our laboratory for mouse studies is typically in the range of 10–20 MBq, which is well below the activity of 57 MBq for the MuPET and 130 MBq for the Inveon, at which NECR peaks for the mouselike phantom. For 15-MBq injections, the NECR values for the MuPET and Inveon were comparable.
The NECR peak values of the MuPET were much higher than those of the NanoPET/CT (mouselike phantom, 430 kcps; ratlike phantom, 130 kcps) and the LabPET-8 (mouselike phantom, 183 kcps; ratlike phantom, 67 kcps). The lower NECR peak values of these 2 cameras may be attributed to their smaller axial FOV, packing fraction, and possible differences in electronics.
CONCLUSION
A high-resolution and high-sensitivity preclinical PET/CT (MuPET) camera based on the low-cost PQS detector technology was evaluated using the NEMA NU 4-2008 standards, phantoms, and mouse studies. The average spatial resolution was about 1.2 mm at the center of the camera and improved to about 0.8 mm when a resolution-recovery method was used and remained below 1.2 mm for the 6-cm central transaxial FOV region. The absolute sensitivity of the PET scanner was 6.38% for an energy window of 350–650 keV and a coincidence timing windows of 3.4 ns. The peak NECR of the camera was 1,100 kcps for the NEMA mouselike phantom and 534 kcps for the ratlike phantom. The 1-mm rod in the NEMA image-quality phantom and 1-mm hot rods in the Ultra-Micro Hot Spot phantom were clearly observable. The images of a healthy mouse clearly showed the left and right-ventricle walls, and the Harderian gland was also observable.
DISCLOSURE STATEMENT
The costs of publication of this article were defrayed in part by the payment of page charges. Therefore, and solely to indicate this fact, this article is hereby marked “advertisement” in accordance with 18 USC section 1734.
Acknowledgments
We thank Drs. Suzanne Craig, Yiping Shao, and David Yang at the University of Texas M.D. Anderson Cancer Center for their support and for providing the mice and protocols used for this work. We also thank Jorge Delacerdo and Charles Kingsley at the Small Animal Imaging Facility for their technical support in mouse preparation. This work was supported in part by grants NIH RO1-EB004840-01 A3 and NIH RO1-EB001038-08 A1. No other potential conflict of interest relevant to this article was reported.
Footnotes
Published online Sep. 20, 2012.
- © 2012 by the Society of Nuclear Medicine and Molecular Imaging, Inc.
REFERENCES
- Received for publication January 23, 2012.
- Accepted for publication May 31, 2012.


