


Abstract
The novel PET flow tracer flurpiridaz F 18 shows high myocardial extraction and slow washout. flurpiridaz F 18 PET data analysis with tracer kinetic modeling provides accurate absolute myocardial blood flow (MBF) measurements but requires in-scanner injection and complex processing. We evaluated the hypothesis that myocardial retention and standardized uptake values (SUVs) based on late uptake provide accurate estimates of myocardial flow reserve (MFR) and, thus, might allow simplified quantification after tracer injection outside the scanner. Methods: Nine pigs had dynamic PET scans after repeated injections of flurpiridaz F 18 at rest and combined adenosine and dobutamine stress. flurpiridaz F 18 PET with a 3-compartment model and coinjected radioactive microspheres were used to delineate MBF. These quantitative measurements were compared with myocardial retention (%/min) and SUV of flurpiridaz F 18 after summing data over 5–10, 5–12, 5–15, 10–15, and 10–20 min after tracer injection. Results: MBF ranged from 0.5 to 2.8 mL/min/g. There was a good correlation between both flurpiridaz F 18 retention and SUVs from 5 to 12 min after injection and MBF measured using 3-compartment model– or microsphere-derived MBF (r = 0.73, P < 0.05, and r = 0.68, P < 0.05, respectively, for retention; r = 0.88, P < 0.001, and r = 0.92, P < 0.001, respectively, for SUV). At later time points, retention and SUV underestimated stress microsphere flow (at 10–20 min: r = 0.41, P = not significant, and r = 0.46, P = not significant, respectively, for retention; r = 0.41, P = not significant, and r = 0.65, P < 0.05, respectively, for SUV). When measured 5–12 min after injection, there was a close agreement between MFR measured with either flurpiridaz F 18 retention or SUV and MFR measured using microspheres (mean difference, −0.08 ± 0.36 and −0.18 ± 0.25, respectively). Conclusion: Myocardial retention and SUVs of the 18F-labeled flow tracer flurpiridaz F 18 accurately reflect the MFR. These simplified analysis methods may facilitate the combination of quantitative assessment of perfusion reserve and rapid clinical imaging protocols.
Myocardial perfusion imaging with SPECT and PET is a standard tool for detection of coronary artery disease, risk stratification of patients, and guidance of therapeutic interventions (1–4). Usually, myocardial perfusion is analyzed in a qualitative manner, so that only relative perfusion changes can be detected. Absolute quantification of myocardial blood flow (MBF) and the subsequent calculation of myocardial flow reserve (MFR; the ratio of MBF at stress and rest) are a goal of essentially all invasive and noninvasive imaging approaches (4–8). Compared with qualitative analysis, quantitative assessment of perfusion can improve the accuracy with which coronary artery disease is detected. It can reduce the number of false-negative results in patients with multivessel disease, for which qualitative analysis often cannot uncover globally reduced perfusion or uncovers only the coronary territory supplied by the most severe stenosis. It can also reduce false-positive findings by improving interpretation of subtle perfusion irregularities. In addition to epicardial stenosis, quantitative MFR provides information on microvascular function (9–11).
Cardiac PET is currently the most established noninvasive technique for quantification of MBF and MFR using tracer kinetic modeling, which requires dynamic imaging beginning briefly before the tracer injection and monitoring of tracer distribution in the myocardium for 2–30 min depending on the tracer and model (12–14). The potential of MBF and MFR quantification with PET in clinical research was extensively demonstrated in the past (6,15,16), as well as in recent studies (17).
Despite the advantages of quantitative MBF and MFR, the use of PET in clinical cardiology has remained limited. The primary reason is the need for a nearby cyclotron for production of tracers with short half-lives, such as 13N-ammonia and 15O-water, or a dedicated generator system for 82Rb. The short half-life of the currently used tracers effectively prohibits the combination of physical exercise and PET. Furthermore, most data are still acquired and analyzed qualitatively, because tracer kinetic modeling requires dynamic acquisition protocols and complicated analysis tools. Especially, 82Rb suffers from potential estimation errors for MBF due to its low extraction at higher flow (2,18,19), which requires large correction factors potentially amplifying noise in the data.
A recently introduced 18F-labeled flow tracer, flurpiridaz (the generic name of 18F-BMS747158-02), shows excellent myocardial extraction even at high MBF. This means that MBF can be measured reliably with a kinetic model even at high flow rates and that the image quality is excellent (20–22). We hypothesize that high extraction and the long tissue half-life of this tracer allow for quantitative analysis of MBF using a simplified analysis, which would be easier to introduce into the clinical routine. The simplified methods based on measurement of myocardial tracer retention and standardized uptake values (SUVs) (23) were outlined almost 2 decades ago (24,25). Tracer retention is defined as myocardial activity concentration divided by the integral of the arterial input function curve, which represents delivery of tracer to the myocardium. The SUV is widely used in oncologic imaging and normalizes tissue uptake with weight of the patient and injected dose. Most of the earlier human and animal-model studies using SPECT or PET flow tracers showed that measurements of tracer retention underestimate MBF, indicating that high myocardial tracer extraction is a prerequisite for the simplified quantification strategies to work (12,18,26–29). The extraction of flurpiridaz F 18 in an isolated perfused rat heart has been shown to be high, independently of the flow (30). However, the relationship between flurpiridaz F 18 myocardial retention and MBF in large-animal models that resemble the human heart over a wide range of pathophysiologic flow conditions has not been evaluated previously. Accordingly, we studied whether myocardial retention or an even simpler approach using the SUV of flurpiridaz F 18 at different time intervals provides indices of MFR values that are comparable to those obtained using tracer kinetic modeling with flurpiridaz F 18 or radiolabeled microspheres in a pig model.
MATERIALS AND METHODS
Animal Preparation
The study group consisted of 9 young domestic pigs (average weight, 31 ± 4 kg). The pigs were anesthetized using azaperone (2 mg/kg) and ketamine (10–15 mg/kg) followed by atropine (0.5–1 mg/kg), an intravenous bolus injection of propofol, 1%, and endotracheal intubation. Then, pentobarbitone was continuously infused to maintain anesthesia. Fentanyl and atracurium were injected every 30 min as an intravenous bolus for analgesia and muscle relaxation, respectively. For drug infusions, the external and internal jugular veins were catheterized. Heart rate and blood pressure were monitored using a carotid artery catheter. For blood sampling, the femoral artery was catheterized. The left atrial appendage was cannulated via left fifth intercostal space thoracotomy for injection of the microspheres. The study protocol was approved by the regional governmental commission of animal protection (Regierung von Oberbayern, Germany).
Tracer Production
The radiosynthesis and quality control of flurpiridaz F 18 have been described elsewhere (20).
Study Protocol
In each animal, a dynamic PET scan was obtained after an intravenous injection of 100 MBq of flurpiridaz F 18 at rest, followed by another scan after injection of 200 MBq of flurpiridaz F 18 during pharmacologic stress. We used variable doses of adenosine (150–500 μg/kg/min) to induce variation in flow response, combined with dobutamine (10–40 μg/kg/min) to prevent hypotension during stress. The delay between subsequent injections was 40 min.
The stressor infusion started 3 min before tracer injection and was maintained over 6 min to keep hemodynamic conditions stable. The variable doses of stressors were used to induce variation in hyperemic flow values. To obtain reference values of MBF at rest and at stress, radioactively labeled microspheres were injected into the left atrial appendage simultaneously with flurpiridaz F 18 injections. After PET, the animals were euthanized by injection of a saturated solution of potassium chloride. Then, the heart was excised and the excessive fat and connective tissue were removed from the left ventricle, which then was surgically isolated from the other heart chambers and sliced into transmural samples.
Image Acquisition and Reconstruction
An ECAT HR+ PET tomograph (Siemens Healthcare) was used. We used a 10-min transmission scan for attenuation and applied segmentation before attenuation correction using the approach available under the Siemens ECAT7.1 system. After transmission scanning, a 20-min PET dynamic series (12 × 10 s, 6 × 30 s, 3 × 5 min) was started 10 s before a 30-s slow flurpiridaz F 18 bolus injection was injected. PET data were acquired in 2-dimensional mode. Nongated, attenuation-corrected images were reconstructed with standard filtered backprojection (Hanning, cutoff frequency of 0.3 cycle per bin, zoom of 2.2, 2.34 × 2.34 × 3.38 mm voxels, 63 slices).
Microsphere Measurements and Tissue Counting
To obtain reference values of MBF, approximately 1 million radioactively labeled microspheres with a mean diameter of 15 μm (Perkin-Elmer) were injected into the left atrial appendage in all animals simultaneously with flurpiridaz F 18 injections. To determine the arterial input function, an arterial blood reference sample was withdrawn with a calibrated pump from left femoral artery for 120 s at a rate of 10 mL/min starting 10 s before the microsphere injection (31). After excision and preparation of the heart, 18F activity was allowed to decay for 2 d before measurement of microsphere radioactivity using a multichannel γ-counter (Cobra-Quantum; Perkin-Elmer). Two of 3 microspheres were used in each animal (141Ce, 103Ru, and 95Nb). Corrections for rate of decay, background, and spillover of the activity from one window into another were performed, followed by calculation of the microsphere-derived MBF (31).
Image Analysis
The PET images were analyzed using MunichHeart software (developed at Nuklearmedizinische Klinik und Poliklinik der Technischen Universität München), which has been previously validated for flurpiridaz F 18 PET quantitative analyses (22). Because of the long half-life of 18F, residual myocardial uptake from the rest injection was observed in the stress images. This residual activity was measured in the image frames immediately preceding reinjection of flurpiridaz F 18, and the stress tissue data were corrected by subtracting the residual activity as demonstrated in Figure 1. PET data were volumetrically sampled and the defined segments were applied to the dynamic imaging series to obtain myocardial time–activity curves. For measurement of arterial input function, a cylindric volume of interest (approximately 1 × 1 × 2 cm) was automatically centered in the basal portion of the left ventricle. No correction for metabolites was performed.

Typical time–activity curves of flurpiridaz F 18 uptake in myocardium and blood pool in sequential rest (left panel) and stress (right panel) studies. Triangles represent area under arterial blood curve in first 3 min after injection. Boxes demonstrate measurement of average activity concentration between 5–10 min at rest and 10–15 min during stress. Horizontal dashed line in right panel demonstrates background subtraction of residual activity from rest study. Vertical axis is in arbitrary units (a.u.), proportional to Bq/mL.
Image Quantification: Uptake, MBF, and Retention
flurpiridaz F 18–derived MBF (at rest and stress) was quantitatively analyzed using a 3-compartment tracer kinetic model as shown previously (22). In short, since the single-pass extraction fraction of flurpiridaz F 18 is high (0.94) and almost unchanged at high flow rates (30), no correction terms for a flow-dependent extraction were used. Because the dynamic images show high retention and no washout, k4 was set to zero. Because of the limited PET spatial resolution, myocardial activity might be reduced by partial-volume effects and motional blurring and increased by count spillover from the blood into the myocardium. To correct for these effects, a modified volume-of-interest approach was used. The volumes of interest were constructed so large that approximately 50% of the signal from the blood was included, and its variable contribution to the myocardial signal was included in the model (13).
Myocardial retention was measured by averaging the regional myocardial uptake values at 5–10, 5–12, 5–15, 10–15, and 10–20 min. This average was normalized to the area under the arterial blood curve in the first 3 min after injection (Fig. 1) (18,32). The time intervals were chosen to identify optimal time windows for imaging in the clinical setting.
Retention analysis requires dynamic imaging after tracer injection to assess the delivery of tracer to the myocardium. To simplify the analysis even further, the SUVs were calculated according to the following equation (33): SUV = CT · VT/WT · 1/DInj · WS, where CT is tissue radioactivity in Bq/cm3, VT/WT is tissue density (tissue volume/tissue weight [1 cm3 tissue/g tissue]), DInj is injected dose in becquerels, and WS is body weight in grams. For the simplified approaches, no partial-volume or spillover correction was used.
To investigate the relationship between flurpiridaz F 18 retention and flow, as well as the derived SUV, those data were plotted against both the absolute flurpiridaz F 18– and microsphere-derived MBF values. The MFR, which is defined as the ratio of maximal to basal MBF, was compared between the myocardial retention (MFRretention) and SUV-derived data (MFRSUV) versus both flurpiridaz F 18 MFR (MFRflurpiridaz) and microsphere-derived MFR values (MFRmicrospheres). Because myocardial perfusion was homogeneous in the animals, only mean values in the left ventricle were used in the analysis.
Statistical Analysis
Data are presented as mean ± SD. The Student t test for paired data was used to compare matched normal data, and the Wilcoxon matched-pairs test was used to compare matched continuous ordinal data. Spearman rank correlation coefficient was used to evaluate bivariate relationships. To evaluate the accuracy of SUV and flow, we applied the nonparametric Passing and Bablok regression, because the correlated variables showed no normal distribution. This test calculates whether the line of regression differs significantly from the line of identity. Bland–Altman analysis was used to further characterize the agreement. P values of less than 0.05 were considered statistically significant.
RESULTS
Time–activity curves of flurpiridaz F 18 uptake in sequential rest and stress PET scans in the myocardium and blood pool are shown in Figure 1. A rapid vascular clearance phase of approximately 5 min after injection is followed by a stable phase of myocardial tracer retention. We found a slight increase in myocardial tracer concentration over time under resting conditions (P < 0.05), whereas there was only an insignificant decrease at stress (Figs. 1 and 2).

Retention values (A) and SUVs (B) at 5–10, 5–12, 5–15, 10–15, and 10–20 min at rest and during stress, respectively. Compared with 5–12 min, retention values and SUVs increased at rest but decreased during pharmacologic stress after 12 min after injection.
Measurements of MBF using either microspheres or flurpiridaz F 18 PET with a 3-compartment tracer kinetic model provided comparable values at rest (mean, 1.2 ± 0.3, and range, 0.5–1.6 mL/min/g, vs. mean, 1.2 ± 0.3, and range, 0.5–1.6 mL/min/g, respectively) and at stress (mean, 1.8 ± 0.6, and range, 0.9–2.8 mL/min/g, vs. mean, 1.8 ± 0.5, and range, 1.0–2.7 mL/min/g, respectively).
Compared with the rest MBF, both microspheres and flurpiridaz F 18 PET with tracer kinetic modeling showed higher (P < 0.05 and P < 0.05, respectively) MBF at stress.
To correlate the MBF values of kinetic modeling and microspheres, data points of each animal at rest and stress were combined (Fig. 3). The data correlated well, without a statistical difference from the identity line, and with excellent agreement (y = 0.89x + 0.26). The confidence interval (CI) was [0.43; 1.5] for the slope and [−0.72; 1.1] for the intercept, and the mean difference was −0.1 ± 0.1 mL/min/g over the measured MBF range (0.5–2.8 mL/min/g) (Fig. 3). The data also showed a good correlation between flurpiridaz F 18 and microsphere-derived MFR, with only a modest deviation from the line of identity (y = 0.66x + 0.39, CI of [0.45; 0.96] for the slope and [0.02; 0.69] for the intercept), and the mean difference was −0.14 ± 0.25 mL/min/g (Fig. 3).

Regression plots (left) and Bland–Altman plots (right). (A) MBFflurpiridaz vs. MBFmicrospheres at rest and during stress. (B) MFRflurpiridaz vs. MFRmicrospheres. Correlations and agreements were good.
Retention and SUV Versus MBF
Myocardial retention and SUV of flurpiridaz F 18 were calculated using the averaged myocardial activity concentration in 5 overlapping time intervals. Figure 2 demonstrates that retention and SUVs were significantly higher at stress than at rest at 5–10 and 5–12 min. However, the difference between rest and stress values decreased at later intervals.
Using a simplified analysis, both flurpiridaz F 18 retention (Table 1) and SUV (Table 2) showed a good correlation with MBF measured using either the 3-compartment tracer kinetic model or microspheres at 5–10 and 5–12 min after injection. At later intervals (5–15, 10–15, and 10–20 min after injection), retention and SUV underestimated MBF.
Retention (%/min) Versus flurpiridaz F 18 and Microsphere MBF (mL/min/g)
SUV Versus flurpiridaz F 18 and Microsphere MBF (mL/min/g)
Assessment of MFR
The ratios of stress and rest values of MFRretention and MFRSUV were calculated and compared with MFRflurpiridaz or MFRmicrospheres.
The data showed a good correlation, with excellent agreement, between either MFRretention or MFRSUV and MFRflurpiridaz or MFRmicrospheres at 5–10 min and 5–12 min after injection, respectively (Tables 3 and 4; Figs. 4 and 5). For MFRretention versus MFRmicrospheres, a good correlation was found: at 5–10 min (y = 0.76x + 0.37), the CI was [0.21; 1.06] for slope and [−0.14; 1.11] for intercept, and at 5–12 min (y = 0.62x + 0.57), the CI was [0.29; 1.25] for slope and [−0.51; 1.0] for intercept. For MFRSUV versus MFRmicrospheres, there was also no statistical difference from the line of identity: at 5–10 min (y = 0.76x + 0.37), the CI was [0.69; 1.59] for slope and [−1.14; 1.25] for intercept, and at 5–12 min (y = 0.62x + 0.57), the CI was [0.63; 1.5] for slope and [−1.14; 0.27] for intercept. However, at later time points, MFRretention and MFRSUV showed marked scatter and were significantly lower than MFRflurpiridaz or MFRmicrospheres.
MFRretention Versus MFRflurpiridaz and MFRmicrospheres
MFRSUV Versus MFRflurpiridaz and MFRmicrospheres

MFRretention (left panel) and MFRSUV (right panel). At early intervals (5–10 and 5–12 min), values are comparable to MFRmicrospheres (dashed line). At later intervals (5–15, 10–15, and 10–20 min), values are significantly lower than MFRmicrospheres. *P < 0.05 vs. MFRmicrospheres.
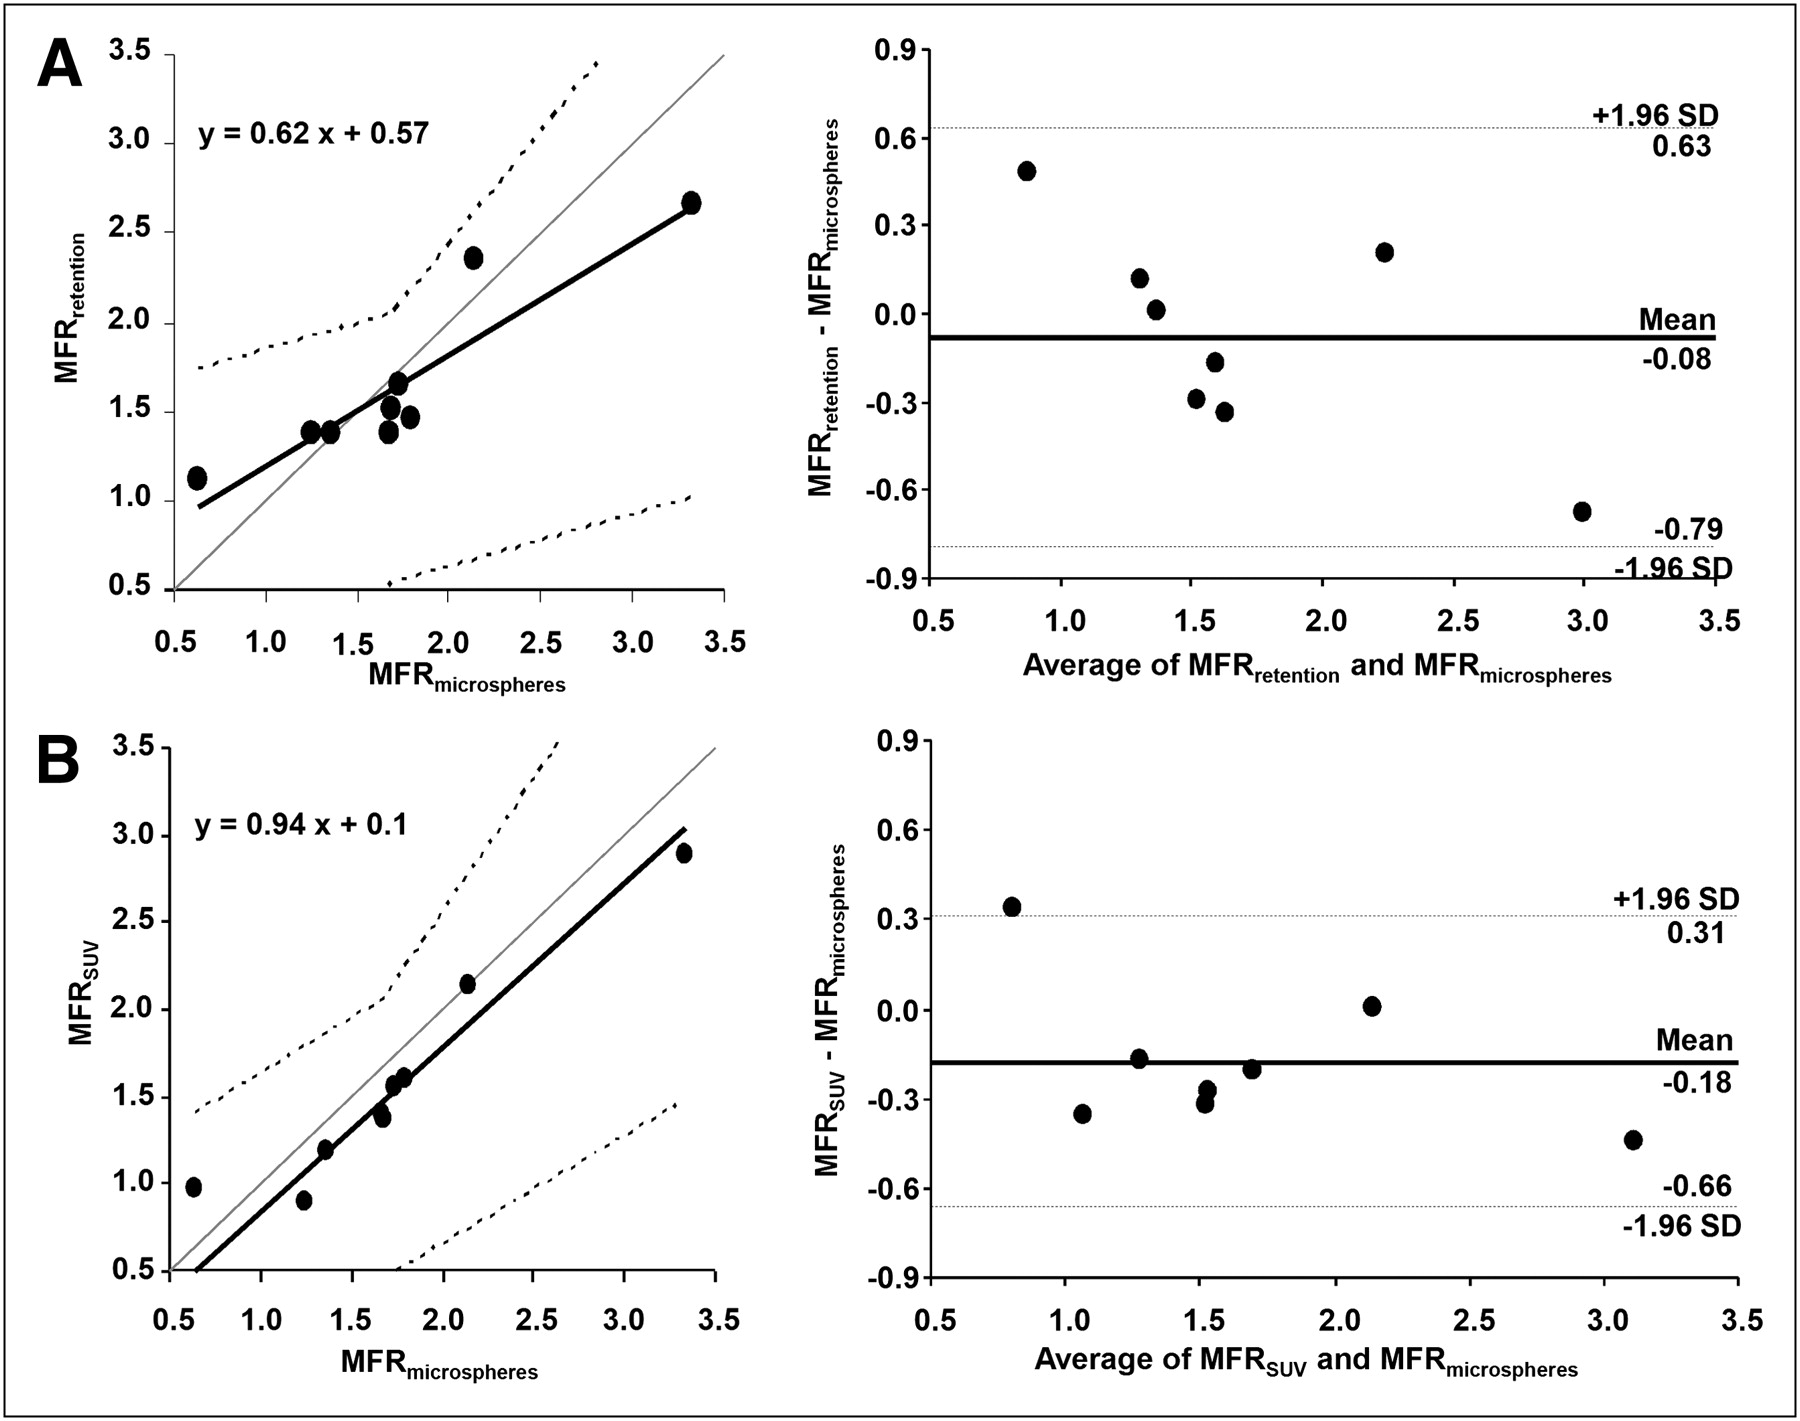
Regression plots (left) and Bland–Altman plots (right) for MFRretention (A) and MFRSUV (B) vs. MFRmicrospheres, from 5 to 12 min. Correlation and agreement between MFRretention and MFRSUV vs. MFRmicrospheres were good.
Consequently, the agreement between either MFRretention (Table 3) or MFRSUV (Table 4) and either MFRflurpiridaz or MFRmicrospheres was good, with small mean differences during early intervals (at 5–10 min and 5–12 min after injection) (Fig. 5).
Retention Versus SUV
There was also a good correlation between the retention and SUVs, as well as MFRretention and MFRSUVs, at all time intervals.
DISCUSSION
Tracer kinetic modeling was compared with simplified approaches for quantitative analysis of myocardial perfusion and MFR using the PET flow tracer flurpiridaz F 18, which has high extraction and retention in the myocardium. We found that flurpiridaz F 18 retention and, particularly, SUVs showed a good correlation with absolute MBF values at rest and pharmacologic stress from 5 to 12 min after tracer injection. Thus, retention and SUVs could be used as a substitute for absolute MBF values in assessing MFR quantitatively. Simplified, robust analysis protocols could facilitate the use of quantitative analysis in myocardial perfusion imaging and, thus, have important clinical implications. SUV is a particularly attractive measure, because it does not require determination of tracer input function and, thus, could be measured even when the tracer is injected outside the scanner. This ability would allow combination of quantitative analysis with exercise treadmill or bicycle stress testing protocols.
Recently, the clinical potential of absolute MFR quantification has gained interest (3). Previously the domain of primarily research studies, absolute flow reserve quantification could be of significant value for several applications, such as identification of balanced ischemia in extensive coronary artery disease (9), detection of impaired regional vasoreactivity (10), and measurement of improvements in myocardial microcirculation due to invasive and noninvasive therapies (11).
A high and flow-independent extraction of the perfusion tracer has potential to significantly improve the reliability of flow quantification. From a clinical point of view, an optimal myocardial flow tracer would combine high extraction and long retention in the myocardium over a wide range of blood flow while clearing rapidly from the blood. The extraction of flurpiridaz F 18 in an isolated perfused rat heart was high (0.94) independently of the flow (5–15 mL/min), reflecting suitability for blood flow quantification (30). SPECT tracers, such as 99mTc-sestamibi, have an average myocardial extraction fraction of 0.38 when flow ranges from 0.52 to 3.19 mL/min/g (34). The extraction fraction of 13N-ammonia is 0.82 at basal (resting) flow (12) but lower at higher flow rates. Finally, the extraction fraction of 82Rb has been found to be 0.42 at normal resting flow rates (0.75–1.5 mL/min/g) (18,35), but an increasing blood flow under stress conditions is associated with a more significant reduction of extraction. Thus, extraction is higher for flurpiridaz F 18 than for the currently used SPECT and PET tracers. flurpiridaz F 18 is also an interesting alternative because its half-life (110 min) is longer than that of the conventional PET tracers, making it potentially suitable for MBF and MFR quantification in the clinical setting (21,22,30,36).
Blood flow quantification based on kinetic models suffers from 2 major limitations. One is the need for dynamic data acquisition, which requires that the tracer be injected in the tomograph, making physical-exercise stress testing in combination with imaging almost impossible (37). Therefore, important information about symptoms and prognosis related to exercise tolerance is not available. The other limitation is related to the reproducibility and reliability of complex mathematic models in a high-throughput, clinical environment. Even with cardiac flow tracers that have good overall imaging properties, dynamic imaging requires acquisition of repeated images within a short time, and the quality of these images could be adversely affected in some (e.g., obese) patients. The same holds true for dose reduction strategies, which could limit the available signal-to-noise ratio.
For these reasons, we investigated 2 simplified analysis approaches for quantitative assessment of myocardial perfusion with flurpiridaz F 18, namely retention (a model-free quantification approach in which tracer uptake is calibrated with the noninvasively measured myocardial tracer delivery) and SUV (in which myocardial uptake is calibrated with the patient dose and weight) (33). In our study, the assessment of MBF with radioactive microspheres served as a reference. Both retention and SUV yielded optimal results in the interval between 5 and 12 min, when compared with MBF measured using either the 3-compartment tracer kinetic model or microspheres.
These results appear superior to other SPECT and PET agents tested previously in animal models. Comparison of 99mTc-sestamibi, 99mTc-tetrofosmin, and 99mTc-furifosmin showed that sestamibi had a greater increment in retention than did 99mTc-tetrofosmin or 99mTc-furifosmin (slope = 0.53, r2 = 0.86, vs. slope = 0.47, r2 = 0.83, and slope = 0.21, r2 = 0.86, respectively) (29). Also, the 82Rb retention index in pigs showed a good correlation with the microsphere-derived MBF in the physiologic flow range (<3 mL/min/g, slope = 0.62, r2 = 0.71) (18).
Despite the presence of a significant correlation between flow estimates provided by the retention approach and true flow, both SUV approach and tracer kinetic modeling appeared to perform better. Therefore, the relative value of retention analysis alone versus SUV or compartmental modeling remains to be clarified in studies involving a larger number of subjects.
In our study, the analysis was rapid (<5 min of total analysis processing time) for both simplified approaches.
It would be desirable to include data acquired over a long period to optimize image quality. However, inclusion of uptake values after 12 min after injection resulted in underestimation of MFR by either the retention or the SUV method. This behavior is related to the observed increasing uptake of flurpiridaz F 18 over time at rest (Figs. 1, 2, and 5), although tracer uptake is relatively stable under stress conditions. The metabolic fate of flurpiridaz F 18 was not evaluated in this study, but the observed incremental increase in myocardial uptake over time may suggest the presence of metabolites with different tissue uptake characteristics.
A limitation of this study is that only healthy myocardium was investigated. The possibility of the potential depression of the mitochondrial complex I with myocardial diseases could potentially affect flurpiridaz F 18 binding and uptake values. To avoid potential adverse effects of prolonged anesthesia on hemodynamics, we repeated tracer injection before complete decay of the tracer, but the activity remaining from the previous injection could easily be subtracted from the images.
CONCLUSION
This study indicated that it is feasible and accurate to use simplified analysis models for the assessment of MFR with the highly extracted flow agent flurpiridaz F 18. Especially, the prospect of estimating flow reserves on the basis of SUVs measured early after tracer injection indicates the potential for tracer injection outside the imaging device and thus the possibility of physical stress tests. These findings encourage further evaluation of quantitative approaches with flurpiridaz F 18 in the clinical setting.
Acknowledgments
This work was supported by EC-FP6-project DiMI (LSHBCT-2005-512146) and by an Unrestricted Cardiovascular Research Grant from Bristol-Myers Squibb (now Lantheus Medical Imaging). Ming Yu and Simon Robinson are employees in the Department of Discovery Research, Lantheus Medical Imaging, North Billerica, MA.
Footnotes
↵* Contributed equally to this work.
- © 2011 by Society of Nuclear Medicine
REFERENCES
- Received for publication September 11, 2010.
- Accepted for publication December 20, 2010.


Jump to section
Related Articles
Cited By...
- Rest/Stress Myocardial Perfusion Imaging by Positron Emission Tomography with 18F-Flurpiridaz: A Feasibility Study in Mice
- Clinical Quantification of Myocardial Blood Flow Using PET: Joint Position Paper of the SNMMI Cardiovascular Council and the ASNC
- Integration of Quantitative Positron Emission Tomography Absolute Myocardial Blood Flow Measurements in the Clinical Management of Coronary Artery Disease
- Flow-Dependent Uptake of 123I-CMICE-013, a Novel SPECT Perfusion Agent, Compared with Standard Tracers
- Absolute Quantitation of Myocardial Blood Flow in Human Subjects With or Without Myocardial Ischemia Using Dynamic Flurpiridaz F 18 PET
- Potential Applications of PET/MR Imaging in Cardiology
- Myocardial Imaging for Mitochondrial Membrane Potential
- Reply: Simplified Quantification of Myocardial Flow Reserve with 18F-Flurpiridaz: Validation with Microspheres in a Pig Model
- Simplified Quantification of Myocardial Flow Reserve with 18F-Flurpiridaz: Validation with Microspheres in a Pig Model