


Abstract
Ventilation distribution can be assessed by SPECT with Technegas. This study was undertaken in piglets with different degrees of ventilation inhomogeneity to compare PET using 68Ga-labeled pseudogas or “Gallgas” with Technegas. Methods: Twelve piglets were studied in 3 groups: control, lobar obstruction, and diffuse airway obstruction. Two more piglets were assessed for lung volume (functional residual capacity). Results: In controls, SPECT and PET images showed an even distribution of radioactivity. With lobar obstruction, the absence of ventilation of the obstructed lobe was visible with both techniques. In diffuse airway obstruction, SPECT images showed an even distribution of radioactivity, and PET images showed more varied radioactivity over the lung. Conclusion: PET provides detailed ventilation distribution images and a better appreciation of ventilation heterogeneity. Gallgas with PET is a promising new diagnostic tool for the assessment of ventilation distribution.
Ventilation distribution is regularly studied before lung resection and is also part of the diagnosis of pulmonary emboli ( 1).
The standard technique for assessing ventilation distribution by γ-camera is the use of Technegas (Vita Medical Ltd.). Small carbon particles (0.2–0.4 μm) behave as a pseudogas and are distributed within the airway tree down to the alveoli during inspiration. The subject lies under a γ-camera, and a 2-dimensional planar view or a 3-dimensional SPECT scan is acquired.
PET offers better resolution than SPECT ( 2), and if repeated measurements are required, the shorter half-lives of positron-emitting isotopes may allow more rapid investigations than with γ-emitting isotopes.
A prerequisite is that the ventilation marker be easy to administer. The equipment for producing Technegas might also be used to prepare a pseudogas for which the carbon particles are labeled with positron-emitting 68Ga as GaCl3. 68Ga is readily available from a long-shelf-life 68Ge/68Ga generator, and it decays by 89% through positron emission.
This study was undertaken in a porcine model of different degrees of ventilation inhomogeneity to compare PET using 68Ga-labeled pseudogas (Gallgas) with standard SPECT using Technegas.
MATERIALS AND METHODS
Preparation of Gallgas
68Ga (half-life of 68 min, decay by positron emission [89%], and electron capture [11%]) was available from a 68Ge/68Ga generator system in which 68Ge (half-life, 270.8 d) was attached to a column of an inorganic matrix using titanium dioxide. The nominal 68Ge radioactivity loaded onto the generator column was 1,850 MBq. The specified shelf-life of the generator was 2–3 y. The 68Ga was eluted with 6 mL of 0.1 M hydrochloric acid. The whole volume of the eluate was preconcentrated on an anion-exchange cartridge to decrease the volume of the generator eluate (from 6 mL to 200 μL) ( 3).
Gallgas was prepared on the commercially available Technegas Plus Generator (Vita Medical Ltd.). The standard procedure was used, including the prewetting of the crucible with ethanol before the application of the 68GaCl3 solution. The preconcentrated 68Ga solution (100–140 μL; 50–100 MBq) was applied to the graphite crucible and evaporated in the furnace at 50°C–70°C. 68Ga was then encapsulated by carbon composites. Gallium metal was covered by layers of graphite sheets that isolated the metal from the external environment (performed at 2,500°C–2,700°C for 15–20 s). The imaging agent was used for the experiments via inhalation within 10 min to avoid aggregation of the particles.
Imaging Techniques
The animals were studied supine, first on a CT-equipped γ-camera using inhalation of Technegas and then on a PET/CT camera using inhalation of Gallgas. The radioactivity inhaled by the piglets was 30 and 5–10 MBq, respectively, for 99mTc and 68Ga. A vacuum mattress was used to keep the piglet in the same position during the experiments and when the animal was moved between the cameras.
SPECT Acquisition
SPECT was performed on a dual-head γ-camera (Infinia; GE Healthcare) equipped with all-purpose, low-energy collimators. The SPECT images were acquired with a low-energy general-purpose collimator in 60 projections (30 per head) stored in a 128 matrix. The acquisition time was 30 s per projection. Low-resolution CT (2.5 mA, 140 kV) was performed covering the same volume as the SPECT acquisition to evaluate lung borders and enable attenuation correction. The overall acquisition time was 25 min. Data were then reconstructed on a Xeleris workstation using a reconstruction technique with 4 iterations, 8 subsets, and a Hann 3-dimenstional postreconstruction filter.
PET Acquisition
PET was performed on a Discovery VCT scanner (GE Healthcare). The acquisition mode used a 3-dimensional imaging technique, a scan time of 3 min per bed position, 128 × 128 pixels, and a 70 cm field of view. The VUE Point HD iterative reconstruction algorithm (GE Healthcare) was used to reconstruct images with 2 iterations and 28 subsets. The z-axis filter was a standard box car (1-4-1), and the postprocessing filter was set to 6.00 mm (in full width at half maximum). Images from the CT study were attenuation-corrected 120 kV; 30–80 mA; smart mA and auto mA (GE Healthcare); and rotation time, 0.5 s).
Analysis Techniques: Distribution Volume for Pseudogas
The distribution volume for the pseudogas when labeled either with 68Ga or with 99mTc was calculated from the SPECT and PET images as the sum of all voxels multiplied by the individual voxel volume that contained radioactivity of 68Ga or 99mTc inside the lung. Lungs were delineated by creating a lung mask from the CT image.
The variation in tracer gas radioactivity, reflecting any inhomogeneity in the distribution of the gas, was calculated by applying statistical modeling.
Protocol.
Fourteen piglets were mechanically ventilated under a continuous administration of ketamine, fentanyl, and pancuronium. Physiologic data were intermittently acquired.
Twelve animals were allocated to the following 3 groups, with 4 piglets in each group: healthy-lung control, normal ventilation distribution; lobar obstruction, a balloon catheter occluding a lower main bronchus; and diffuse obstruction, a continuous methacholine ( 4, 5) infusion adjusted to cause an increase in respiratory resistance by 50%.
The pseudogas was administered to the lungs using a 2-L syringe, 0.5 L of gas was aspirated from the generator box, and 0.5 L was inflated into the lungs. Then the deflation and inflation process was repeated 4 times.
In addition, 2 piglets were studied using similar anesthesia during baseline and infusion of methacholine, with measurement of their end-expiratory lung volume (functional residual capacity [FRC]) by multiple-breath nitrogen washout ( 6).
Statistics
PET and SPECT counts were log-transformed in a transversal slice (the one with the largest lung area) to enable a regression analysis of the heterogeneity of the ventilation distribution. For each piglet, the transformed PET and SPECT counts were related to 2-dimensional coordinates (i.e., x, y from that slice) in a regression model using a quadratic function of the coordinates. The quadratic function was fitted for the 2 lungs combined, delineated by the created lung masks from the CT images.
The difference between the coefficients of determination (R2) from the 2 models (the SPECT and PET) was calculated for each piglet, and a Wilcoxon matched-pairs signed-rank test was performed to test the null hypothesis of equal R2.
For the other physiologic variables, we used repeated-measures ANOVA for comparisons during the protocol. Significance was defined as a P level (bicaudal) of less than 0.05.
RESULTS
Physiology
Compared with the control animals, methacholine infusion increased respiratory resistance by 67% (P < 0.05) and caused a fall in the ratio of partial pressure of arterial O2 (PaO2) to the fraction of inspired O2 (FIO2) (P < 0.05), as is consistent with diffuse bronchial obstruction. Lobar obstruction caused a significant drop in PaO2/FIO2 (P < 0.05), reasonably explained by continuing perfusion of the nonventilated lobe. However, there was no significant difference in resistance, or in respiratory compliance or arterial oxygenation, between measurements done during the SPECT and PET investigations ( Table 1).
Physiologic Data
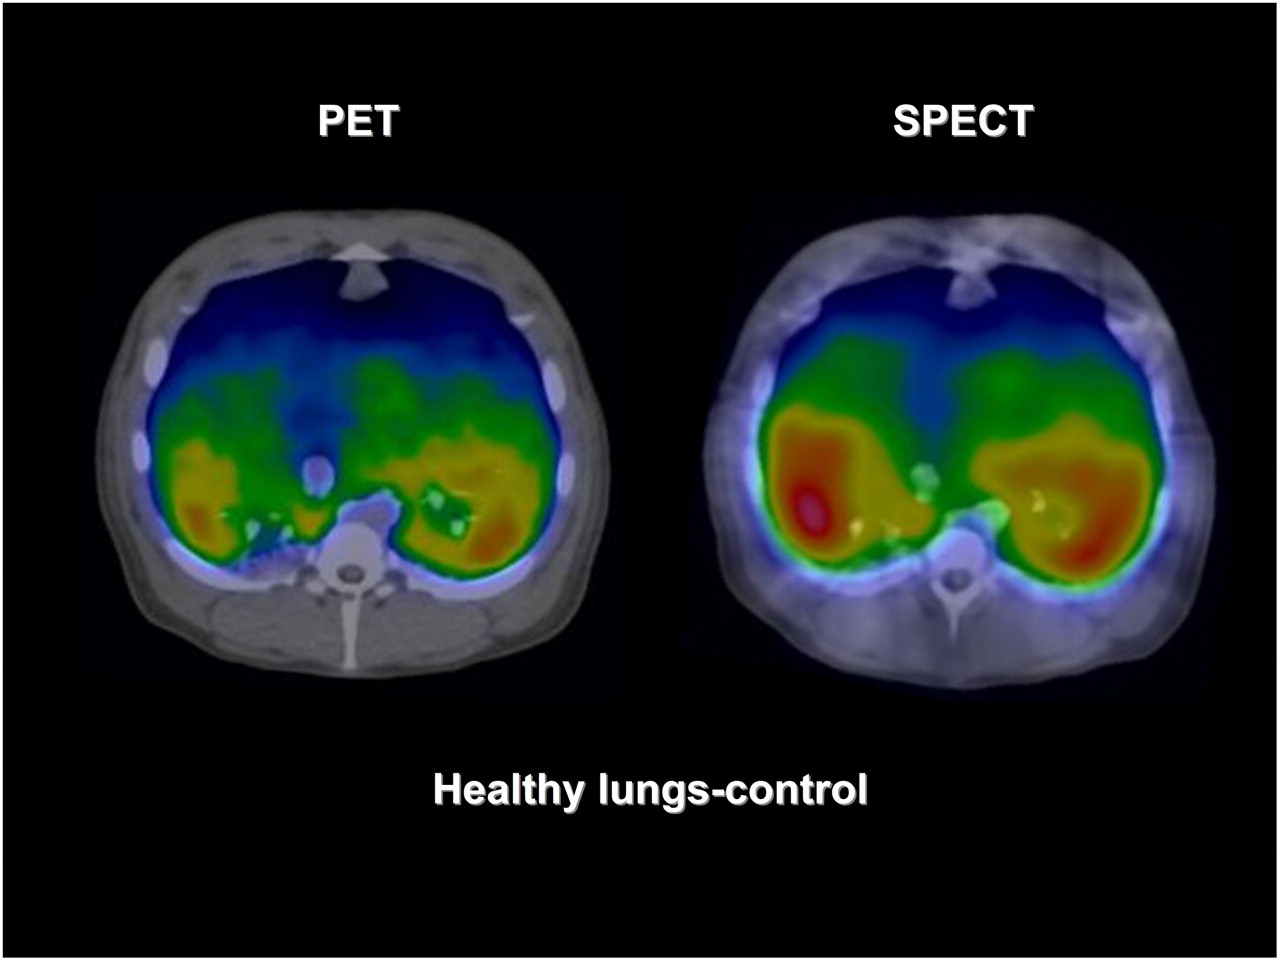
For the healthy-lung control group, SPECT and PET images showed an even distribution of activity ( Fig. 1), reflecting homogeneous ventilation distribution. The distribution volumes for Technegas and Gallgas were similar ( Table 2). For the lobar obstruction group, the absence of ventilation of the lower lobe was clearly visible on both SPECT and PET images ( Fig. 2). For the diffuse obstruction group, distribution volumes for 68Ga and 99mTc differed considerably, with the volume for 68Ga being lower than that for 99mTc (P < 0.05; Table 2).

PET/CT (68Ga) and SPECT/CT (99mTc) images of lung ventilation in healthy piglet. Ventilation distribution on PET and SPECT images is similar.

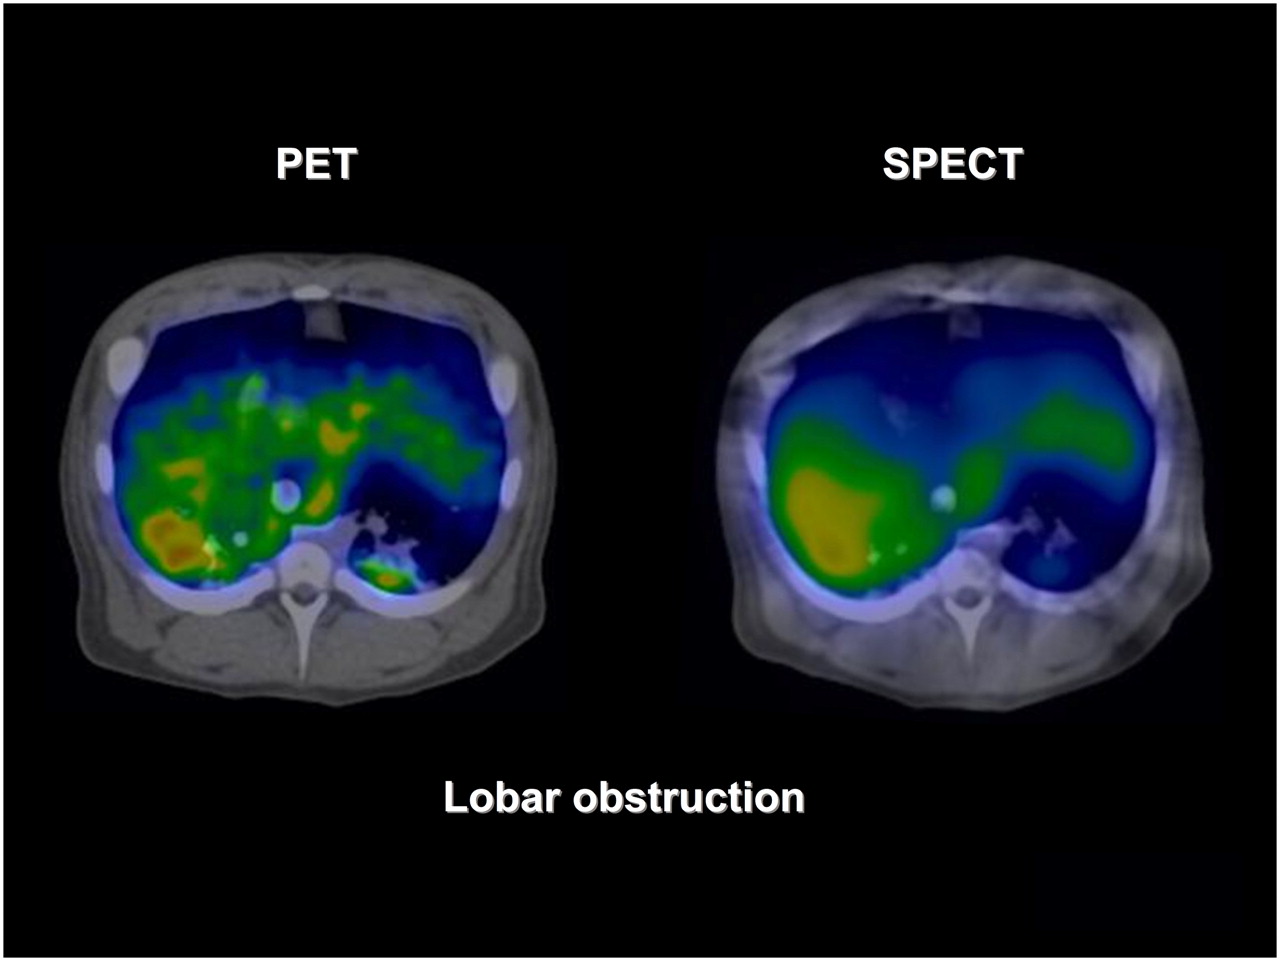
PET/CT (68Ga) and SPECT/CT (99mTc) images of lung ventilation during lower lobar obstruction. Ability of images to detect absence of ventilation corresponding to lower lobe is similar. Ventilation distribution on PET image varies more than that on SPECT image, perhaps suggesting diffuse bronchial constriction as consequence of lobar obstruction, which is not detected with SPECT.
Distribution Volume, FRC, and Heterogeneity Index
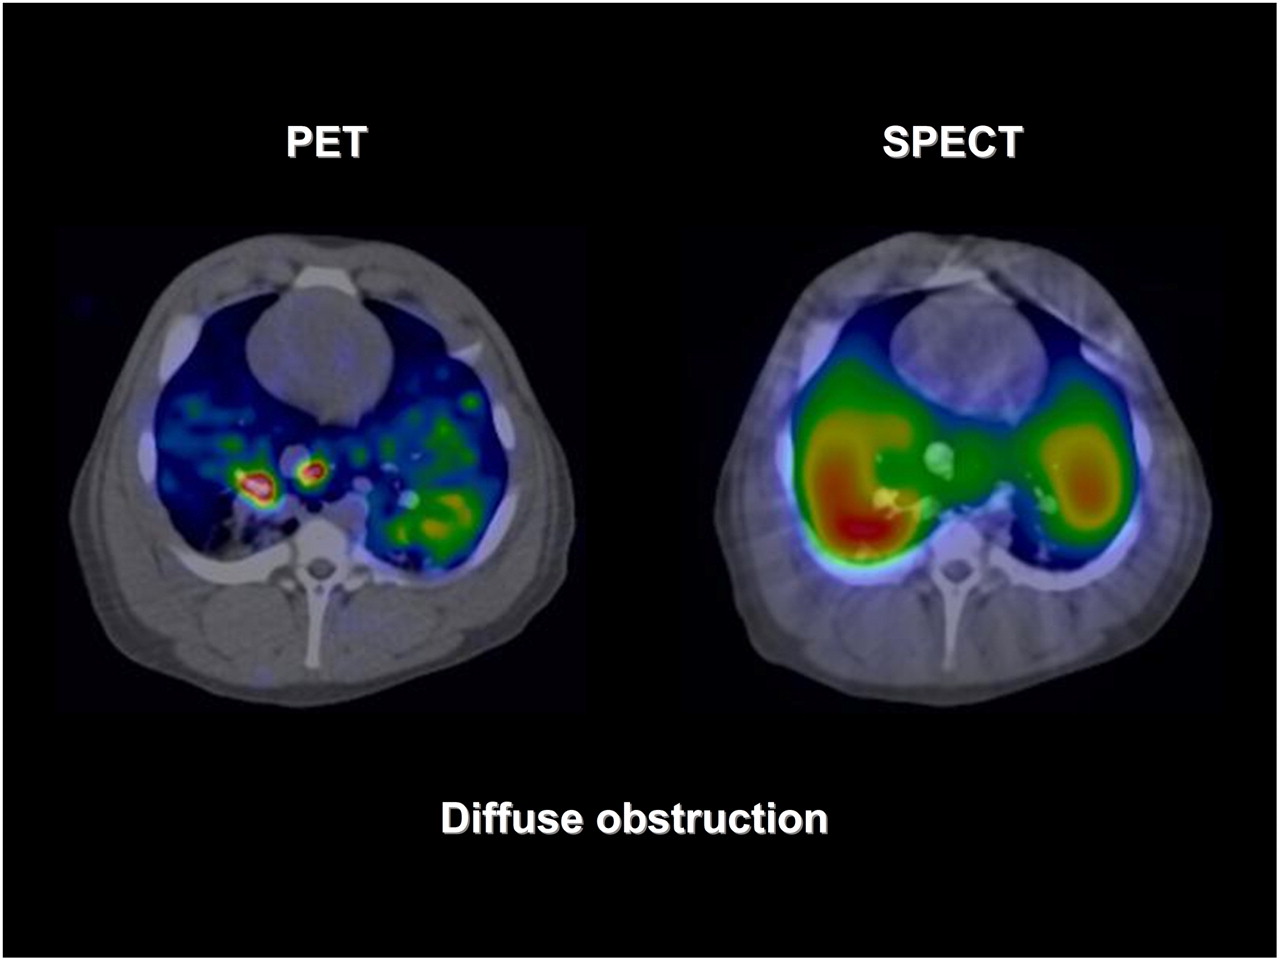
Despite an expected inhomogeneity of ventilation distribution during methacholine infusion, the SPECT image showed a smooth and even distribution of activity ( Fig. 3). The PET image showed a more varied activity over the lung field, indicating inhomogeneity of the ventilation.

PET/CT (68Ga) and SPECT/CT (99mTc) images of lung ventilation during methacholine infusion, which causes diffuse airway obstruction. Ventilation distribution on PET image varies more than that on SPECT image. This larger variation was also supported by statistical analysis shown in Figure 4.
Variation in Tracer Gas Activity for SPECT and PET
The difference between the R2 values from the SPECT and PET models was calculated for each piglet and resulted in significantly less variability in tracer gas activity for SPECT than for PET (P < 0.05; Table 2).
FRC During Methacholine Infusion
The smaller distribution volume for 68Ga than for 99mTc prompted the additional experiments on FRC. These experiments showed a decrease in FRC during methacholine infusion ( Table 2).
DISCUSSION
This study showed that measurement of ventilation distribution with the PET tracer 68Ga (Gallgas) resulted in more detailed images than with SPECT using 99mTc (Technegas).
We obtained technically good results in all 12 piglets. SPECT and PET images were similar in the healthy controls, with even distributions of ventilation. Bronchial occlusion eliminated ventilation to the lower lobe (right or left lung), with good visualization with both techniques. However, distribution of the tracer in the ventilated lung tissue was more detailed on the PET image.
Diffuse airway obstruction by methacholine infusion showed a much larger distinction between poorly and well-ventilated regions on the PET image than on the SPECT image. This difference may be related to the lower spatial resolution of SPECT. This difference could also be visualized when PET methacholine images were smoothed by a Butterworth filter (cutoff, 0.7 cycles/cm; order, 2). The full width at half maximum for PET was similar to that for SPECT (15.5 and 15.6 mm, respectively). After the smoothing, the PET images resembled the SPECT images—that is, the PET images no longer showed the large variation in ventilation distribution caused by the methacholine.
The smaller distribution volume for the 68Ga than for the 99mTc caused some concern that 68Ga did not reach the lung periphery as well as did the 99mTc. However, the recording of FRC in the 2 additional piglets showed a decrease in their FRC on methacholine infusion, more in line with the drop in Gallgas distribution volume than the increase seen with Technegas. Therefore, reduced FRC suggests bronchial obstruction and airway closure by the methacholine ( 7– 9) that limits the spread of 68Ga (and 99mTc) to all lung units. The larger distribution volume for 99mTc will then be an artifact, related to the poorer resolution of the 99mTc activity. With poorer resolution, there will be less ability to distinguish between well- and poorly ventilated lung regions if these regions are near one another.
Further support for this interpretation comes from the correlation between the heterogeneity index (R2) and distribution volume—the smaller the R2, the smaller the distribution volume, as shown in Table 2 and Figure 4.

Difference in distribution volumes between SPECT (99mTc) and PET (68Ga) (▴) images and difference between R2 for distribution volumes (•). R2 corresponds to residual SD—that is, scatter of individual observations along regression line. Higher R2 indicates closer fit to regression line and thus less variation in distribution of tracer gas. Parallel shift of difference in distribution volume and R2 when going from control to lobar obstruction to diffuse obstruction shows that decreased distribution volume for PET (68Ga), compared with distribution volume for SPECT (99mTc), occurs simultaneously with increased heterogeneity of dispersion of 68Ga. Data are expressed as mean ± SEM.
Our study has limitations, such as the small number of animals investigated. The 2 techniques were not compared at the same time because we had to use 2 different cameras. Therefore, lung ventilation may not have been identical at the 2 times of imaging. To overcome this, we performed a procedure to homogenize the lung history before and between each acquisition of PET and SPECT images.
To support the homogenization of lung history, respiratory mechanics and oxygenation were similar during SPECT and PET in all 3 experiments. Lung ventilation distribution measurements with PET have methodologic limitations. Partial-volume averaging and spillover effects affect radioactivity quantification with PET, mainly in the peripheral parts of the lungs.
CONCLUSION
PET provided detailed ventilation distribution images and a better appreciation of heterogeneity of the airway response to a bronchoconstrictive challenge than did SPECT. Gallgas and PET is a promising new diagnostic tool for the assessment of ventilation distribution.
Acknowledgments
We thank Agneta Roneus, Karin Fagerbrink, Pia Boström, Anna Eriksson, and Aseel Sherif for their help with the study. This study was supported by grants from institutional funds from Uppsala University and Coordenação de Aperfeiçoamento de Pessoal de Nível Superior (CAPES)—Ministry of Education, Brazil, and by GE Healthcare. Consumables for the generation of Technegas and carbon boats for Gallgas were provided by Hans-Olof Sandberg, Medicall-Nordic AB.
- © 2011 by Society of Nuclear Medicine
REFERENCES
- Received for publication October 4, 2010.
- Accepted for publication November 3, 2010.


