


Abstract
The purpose of this study was to assess 18F-FDG uptake in children with a newly diagnosed diffuse intrinsic brain stem glioma (BSG) and to investigate associations with progression-free survival (PFS), overall survival (OS), and MRI indices. Methods: Two Pediatric Brain Tumor Consortium (PBTC) therapeutic trials in children with newly diagnosed BSG were designed to test radiation therapy combined with molecularly targeted agents (PBTC-007: phase I/II study of gefitinib; PBTC-014: phase I/II study of tipifarnib). Baseline brain 18F-FDG PET scans were obtained in 40 children in these trials. Images were evaluated by consensus between 2 PET experts for intensity and uniformity of tracer uptake. Associations of 18F-FDG uptake intensity and uniformity with both PFS and OS, as well as associations with tumor MRI indices at baseline (tumor volume on fluid-attenuated inversion recovery, baseline intratumoral enhancement, diffusion and perfusion values), were evaluated. Results: In most of the children, BSG 18F-FDG uptake was less than gray-matter uptake. Survival was poor, irrespective of intensity of 18F-FDG uptake, with no association between intensity of 18F-FDG uptake and PFS or OS. However, hyperintense 18F-FDG uptake in the tumor, compared with gray matter, suggested poorer survival rates. Patients with 18F-FDG uptake in 50% or more of the tumor had shorter PFS and OS than did patients with 18F-FDG uptake in less than 50% of the tumor. There was some evidence that tumors with higher 18F-FDG uptake were more likely to show enhancement, and when the diffusion ratio was lower, the uniformity of 18F-FDG uptake appeared higher. Conclusion: Children with BSG for which 18F-FDG uptake involves at least half the tumor appear to have poorer survival than children with uptake in less than 50% of the tumor. A larger independent study is needed to verify this hypothesis. Intense tracer uptake in the tumors, compared with gray matter, suggests decreased survival. Higher 18F-FDG uptake within the tumor was associated with enhancement on MR images. Increased tumor cellularity as reflected by restricted MRI diffusion may be associated with increased 18F-FDG uniformity throughout the tumor.
Brain stem tumors account for 10%–20% of intracranial tumors in children ( 1, 2). The most common is the diffuse intrinsic brain stem glioma (BSG), usually a fibrillary (World Health Organization [WHO] grade 2) or malignant (WHO grade 3 or 4) astrocytoma involving the pons ( 3, 4). Standard MRI has high diagnostic sensitivity when a T2-weighted hyperintense tumor expands and diffusely infiltrates the pons ( 4) but is limited in assessing tumor metabolic activity ( 5– 7). Biopsies are not routinely performed because of potential morbidity, limiting correlations among tumor grade and outcome. Radiation therapy is the standard treatment, with improved neurologic function, but median progression-free survival (PFS) remains less than 6 mo, and median overall survival (OS) is approximately 10 mo ( 8). Investigations of molecular signaling agents have yet to improve the dismal prognosis ( 9– 14).
PET using 18F-labeled FDG fused with MRI can demonstrate metabolically active disease ( 15) and can be helpful in diagnosing and following up children with brain stem gliomas ( 16). The intensity of 18F-FDG uptake in adults with brain tumors may reflect malignancy grade and predict survival ( 17– 20). Preliminary data indicate that 18F-FDG uptake in children may be associated with malignancy grade and add prognostic information in BSG ( 21, 22) and related brain tumors ( 23, 24).
The aim of this study was to assess the prognostic value of baseline intensity and uniformity of 18F-FDG uptake in a large series of children with newly diagnosed BSG and to investigate associations among 18F-FDG uptake, PFS and OS, and baseline MRI indices of tumor volume, enhancement, diffusion, and perfusion.
MATERIALS AND METHODS
Study Description
The institutional review boards of the Pediatric Brain Tumor Consortium (PBTC) approved the studies before patient enrollment; continuing approval was maintained throughout the studies. Patients or legal guardians gave written informed consent; assent was obtained as appropriate. The 2 clinical trials of children with newly diagnosed BSGs were designed to investigate the efficacy of concurrent radiation therapy with molecular targeting agents. PBTC-007 was a phase I/II study of gefitinib (ZD1839, Iressa; AstraZeneca); PBTC-014 was a phase I/II study of tipifarnib (R115777, Zarnestra; Johnson and Johnson Pharmaceutical Research and Development). Analyses in this report are restricted to the baseline PET and MRI studies. Images were acquired at participating institutions and electronically transferred to the PBTC Operations and Biostatistics Center and, after deidentification, to the PBTC Neuroimaging Center (NIC) for analysis ( 25). Investigators at the NIC were unaware of patient outcome at the time of image evaluation.
MR Image Acquisition
Standard MR images were acquired at each institution using a 1.5-T scanner with axial fluid-attenuated inversion recovery (FLAIR), axial T2-weighting, axial diffusion, axial T2*-weighted perfusion, and axial T1-weighted postgadolinium imaging. Baseline MRI was performed within 2 wk before treatment. FLAIR images were obtained with 4-mm contiguous slice thickness using the following sequence: repetition time (TR)/inversion time/echo time (TE), 10,000/2,200/162. Axial T2-weighted fast spin-echo (FSE) images were obtained with the following sequence: TR/effective echo time, 4,000–6,000/80–100; echo train length, 10–16; receiver bandwidth, ±16 kHz; field of view, 18–24 cm; slice thickness/gap, 4/0 mm interleaved; number of excitations, 2; matrix, 256 × 192; flow compensation option; and frequency in the anterior–posterior direction. Diffusion images were obtained using a single-shot echoplanar spin-echo sequence (TR/TE, 2,000/80; matrix, 128 × 128; b-factor, 5/1,000 s/mm2; 3 directions (x,y,z) for trace imaging; receiver bandwidth, ±64 kHz; frequency in the R/L direction; and slice thickness/gap, 4/0 mm. Perfusion imaging consisted of axial echoplanar imaging; gradient echo mode; single shot; matrix, 128 × 128; TR/TE, 1,500/45–60; field of view, 18–24 cm; number of excitations, 1; slice thickness, 4/0 mm; frequency in the R/L direction; and 45–60 phases, 10 phases before bolus injection of gadolinium diethylenetriamine pentaacetic acid (0.1 mmol/kg). Postgadolinium axial T1-weighted spin-echo images were 4-mm contiguous slices of the whole head using a TR of 500–700 ms and a minimum full TE.
PET Acquisition and Reconstruction
18F-FDG was available across all PBTC institutions. Because the PET scans were acquired in a multicenter consortium on a variety of scanners (Advance NXI [GE Healthcare], Discovery LS [GE Healthcare], Discovery STE [GE Healthcare], G-PET [Philips], HR+ [Siemens], and HiRez Bioscan [Siemens]) with specified spatial resolutions of 4.0–5.0 mm, considering the filtering as a consequence of the reconstruction algorithms, the spatial resolution was in the 7- to 10-mm range.
The consistency of the PET data was maintained by adherence to a standard quality assurance program, with daily blank scans and quarterly normalization, calibration, and preventive maintenance. Two phantoms were imaged at each site to ensure consistent quantitation, as previously described ( 24, 26). Baseline 18F-FDG PET scans of the brain were acquired on all subjects within 2 wk before therapy. Patients fasted for 4 h before PET. The baseline brain PET scan was acquired in 3-dimensional mode for 10 min, 40–60 min after the intravenous administration of 18F-FDG (5.55 MBq/kg) (minimum dose, 18 MBq; maximum dose, 370 MBq). Attenuation correction was performed using either a 3-min segmented transmission scan with 68Ge/68Ga rods or a CT-based approach, depending on whether the scanner was a PET or PET/CT scanner, respectively. The acquired data were reconstructed using Fourier rebinning, followed by a 2-dimensional (2D) ordered-subset expectation maximum reconstruction algorithm.
Image Registration
Fused PET/MR images were obtained using a workstation (Hermes Medical Solutions) and a mutual-information approach, with the PET data resampled along the planes of the MR image. This method provides excellent results, with median errors on fused images of less than 2 mm ( 27). For each case, the quality of the image registration was assessed subjectively and was based on alignment of the cortical surface and gray matter.
Image Analysis
Anatomic tumor extent was evaluated by a pediatric neuroradiologist using axial T1-weighted postcontrast, FLAIR, and T2-weighted MR images. Diffusion images and regions of interest (ROIs) were analyzed using ImageJ (U.S. National Institutes of Health). From the apparent diffusion coefficient (ADC) map, an ROI (3–5 mm in diameter) within the solid part of the tumor was determined using the T1-weighted, FLAIR, T2-weighted, and postgadolinium T1-weighted sequences as reference. In turn, the mean ADC of the ROI was divided by the mean ADC value from an ROI in the normal frontal white matter to obtain the normalized ADC value within the tumor. The perfusion images were transferred to an UltraSPARC II workstation (Sun Microsystems); relative cerebral blood volume (rCBV) maps were generated from the dynamic susceptibility-weighted perfusion MRI data. ROIs (3–5 mm in diameter) were placed in the highest regions of perfusion in the tumor from the generated rCBV maps; the mean rCBV of the tumor ROI was divided by the mean rCBV of an ROI obtained from the frontal white matter to get a normalized tumor rCBV value.
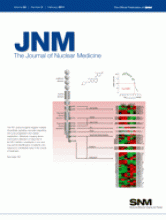
All PET and fused PET/MR images were evaluated by a pediatric neuroradiologist and nuclear medicine physicist for intensity and uniformity of tracer uptake in the tumor. Intensity was graded on a 5-point scale (1, no uptake; 2, uptake similar to normal white matter; 3, uptake between normal white and gray matter; 4, uptake similar to normal gray matter; and 5, uptake greater than normal gray matter). Uniformity was defined as the percentage of the tumor (as delineated on the FLAIR MR image) demonstrating 18F-FDG uptake and was graded on a 4-point scale (0, <25%; 1, 25%–50%; 2, 51%–75%; and 3, >75%). Uniformity was determined by visual estimation from the corresponding multiplanar MR and PET images through the tumor. For cases with negligible 18F-FDG uptake in the tumor, uniformity was grade 0. Figure 1 illustrates the grading scheme for intensity and uniformity of tracer uptake. 2D image analysis was also performed. The axial image through the tumor containing the maximum activity per pixel (highest 18F-FDG uptake) was identified, and a 2D ROI was manually drawn using the 18F-FDG definition of the tumor. Because of the wide range of uptake in these tumors, a set threshold could not be used; ROIs were defined subjectively. Because the PET data analyzed in this study were from a multicenter trial, they were transmitted by the different centers to the NIC in a variety of formats, with pixel values represented as either raw counts, activity concentration (in Bq/mL), or standardized uptake value. To standardize the ROI values, they were normalized by values obtained in a comparison region, as previously reported ( 24). A slice at the level of the thalamus and basal ganglia was chosen, and an ROI in the temporoparietal region was used for normal-gray-matter values. The mean and maximum pixel values within the tumor ROI were normalized by those for normal gray matter and normal white matter to provide ratios of tumor to gray matter and tumor to white matter.

Illustrative examples of grading scheme for intensity and uniformity of 18F-FDG PET uptake by BSG. (A) 12-y-old girl with intensity of BSG 18F-FDG uptake between normal white and gray matter; percentage of tumor demonstrates 18F-FDG uptake less than 25% (as demonstrated on FLAIR MR image marked with red ROI), PFS of 258 d, and OS of 348 d. (B) 7-y-old boy with intensity of BSG 18F-FDG uptake greater than normal gray matter; percentage of tumor demonstrates 18F-FDG uptake greater than 75% (as demonstrated on FLAIR MR image marked with red ROI), PFS of 169 d, and OS of 196 d.
Statistical Analysis
Cox proportional hazards models were used to investigate possible associations of PET variables with PFS and OS distributions. Subjects were followed for up to 3 y from the time of enrollment. PFS was measured from treatment start date to the earliest of date of progression or death; similarly, OS was measured from treatment start date until date of death. Patients who did not experience an event for PFS or OS were censored at their last follow-up date. Because Cox proportional hazards models are known to produce spurious results if fewer than 10 events per covariate are available, associations with PFS and OS were explored only when at least 9 events were available for a given neuroimaging variable for the univariable Cox models.
Log-rank and χ2 tests were used when statistically appropriate. An ordinal logistic regression model was used to evaluate the association of subjective BSG 18F-FDG uptake intensity and uniformity grading with 2D continuous PET variables. Linear-by-linear association tests were used to explore the associations of baseline 18F-FDG uptake and uniformity with baseline tumor volume on FLAIR/T2-weighted imaging, baseline diffusion values, and baseline tumor perfusion values. The Exact Cochran–Armitage trend test was used to examine 18F-FDG uptake versus volume of tumor enhancement.
Because reported P values are not adjusted for multiplicity, the usual 0.05 level cannot be used to determine statistical significance; therefore, each P value reported must be considered in light of the multiplicity-adjusted significance level of 0.00076.
RESULTS
One hundred six children were enrolled in the PBTC-007 phase I/II and PBTC-014 phase I/II studies. Of these, 40 children (38%; age, 3.4–18.7 y; 26 girls and 14 boys) underwent both baseline brain 18F-FDG PET and MRI. Twenty-three children were enrolled in PBTC-007 phase I/II (9 in phase I and 14 in phase II) and 17 in PBTC-014 phase I/II (6 in phase I and 11 in phase II).
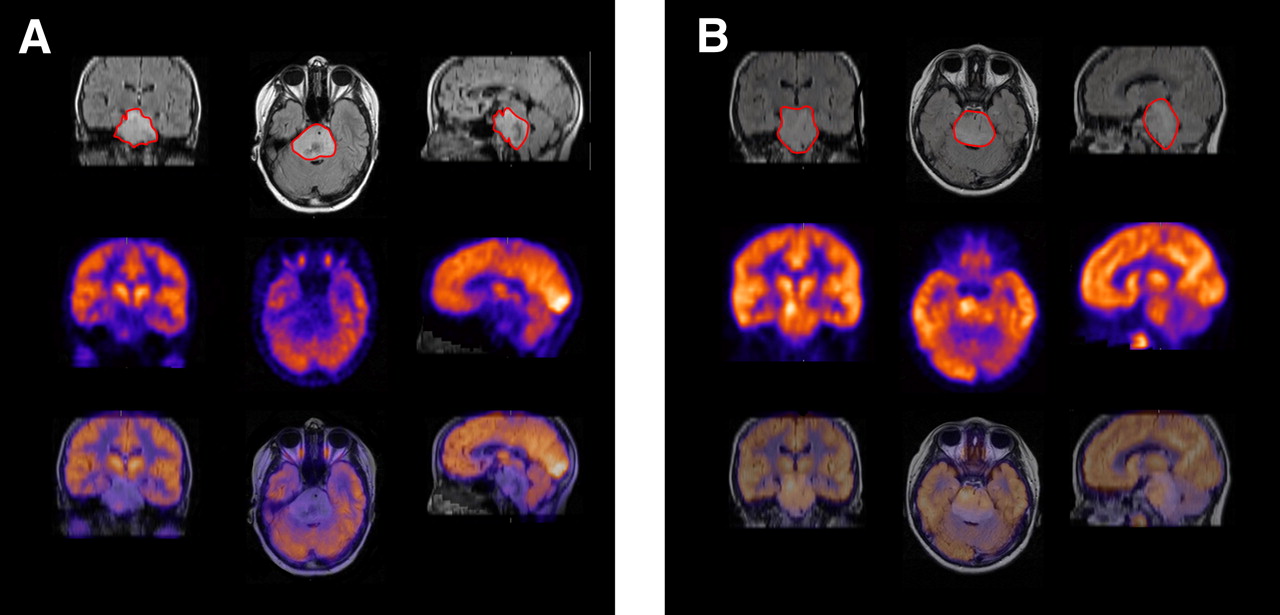
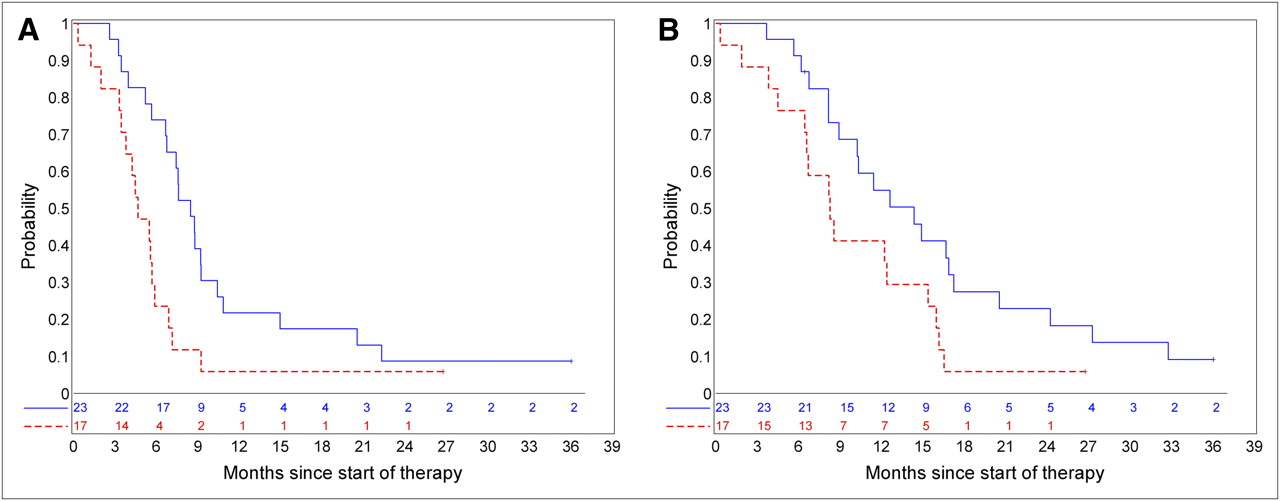
The 12-mo PFS rates (±SE) were 15.0% ± 5.2% and 12.1% ± 3.8%, respectively, for patients with and without baseline PET scans; 12-mo OS rates (±SE) were 49.0% ± 7.8% and 42.5% ± 6.0%, respectively, for patients with and without baseline PET scans. There was no evidence that the subset of children with baseline PET was biased with respect to PFS distribution (P = 0.52) or OS distribution (P = 0.52) ( Fig. 2).

PFS rate (A) and OS rate (B) for patients with baseline PET (blue solid line) vs. patients without baseline PET (red dashed line). There was no evidence that subset of children for whom baseline PET was available was biased with respect to PFS (P = 0.52) or OS distributions (P = 0.52).
Table 1 shows the 1-y PFS and OS estimates corresponding to the intensity of 18F-FDG uptake on the baseline PET. In 33 of the 40 children evaluated (83%), 18F-FDG uptake was less than normal-gray-matter uptake. The current data show no association between intensity of 18F-FDG uptake, PFS (P = 0.36), or OS (P = 0.48) ( Fig. 3).

Association of intensity of BSG 18F-FDG uptake with PFS (blue lines) and OS (red lines). Dashed lines represent patients with 18F-FDG uptake in tumor similar to or greater than gray matter and solid lines represent others. There was no association between intensity of BSG 18F-FDG uptake, PFS (P = 0.36), or OS (P = 0.48).
One-Year PFS and OS by 18F-FDG Uptake
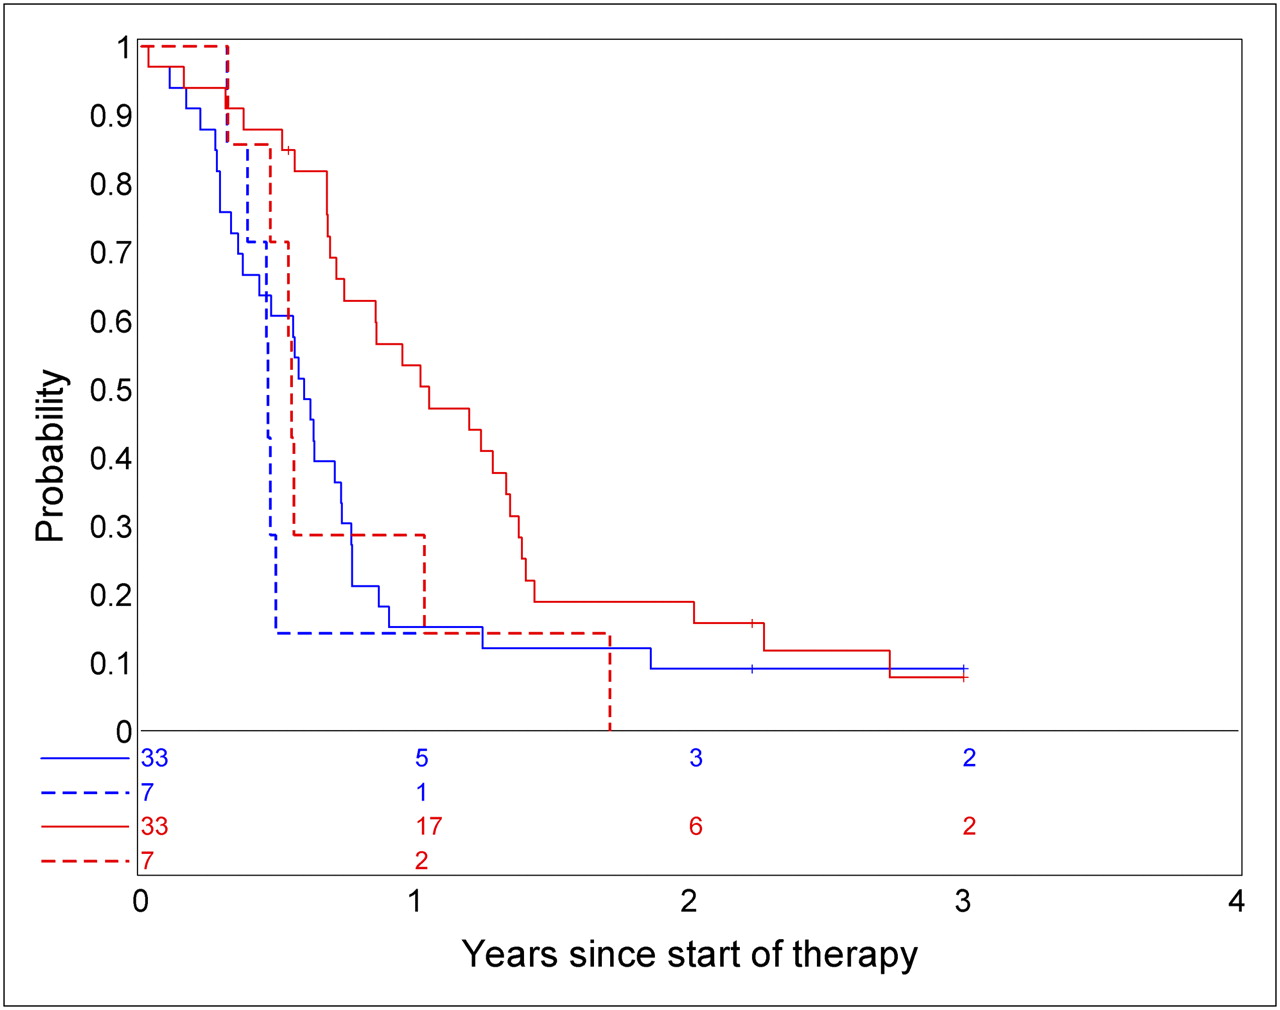
Table 2 shows the 1-y PFS and OS rates (±SE) corresponding to the uniformity of BSG 18F-FDG uptake. 18F-FDG uptake was seen in more than half the tumors in 17 of the 40 children (43%). When more than 50% of the tumor was 18F-FDG–avid, PFS and OS appeared to be decreased ( Fig. 4). One-year PFS (±SE) estimates were 21.7% ± 7.9% and 5.9% ± 4.0%, respectively, for patients with less than 50% 18F-FDG–avid tumor versus those with 50% or more 18F-FDG–avid tumor (exact log-rank test, P = 0.031). One-year OS (±SE) estimates were 54.9% ± 10.2% and 41.2% ± 11.2%, respectively (exact log-rank test, P = 0.086). There was some evidence of a positive linear association between intensity of 18F-FDG uptake and uniformity of 18F-FDG uptake ( Table 3), with a linear–linear association test P value of 0.0003, suggesting that as tumor 18F-FDG uptake increases, compared with uptake in normal tissue, the proportion of 18F-FDG–avid tumor also increases.

Association of uniformity of BSG 18F-FDG uptake with PFS (A) (P = 0.031) and OS (B) (0.086), suggesting that patients with less than 50% of tumor with 18F-FDG uptake have more favorable PFS. 18F-FDG uptake greater than 50% of tumor is red line; 18F-FDG uptake 50% or less is blue line.
One-Year PFS and OS by Uniformity of 18F-FDG Uptake
Comparison of 18F-FDG Uptake with Uniformity
Continuous PET variables were not found to be associated with PFS. Although not significant on the basis of the multiplicity-adjusted significance level, the available data showed some evidence in this exploratory analysis that all continuous PET scans suggest associations with OS ( Table 4). Patients with higher 18F-FDG uptake values in tumors than in comparative tissues (gray matter, white matter, or entire brain) seemed to have earlier death on average.
Cox Proportional Hazards Models Results for Associations of Continuous PET Variables with PFS and OS
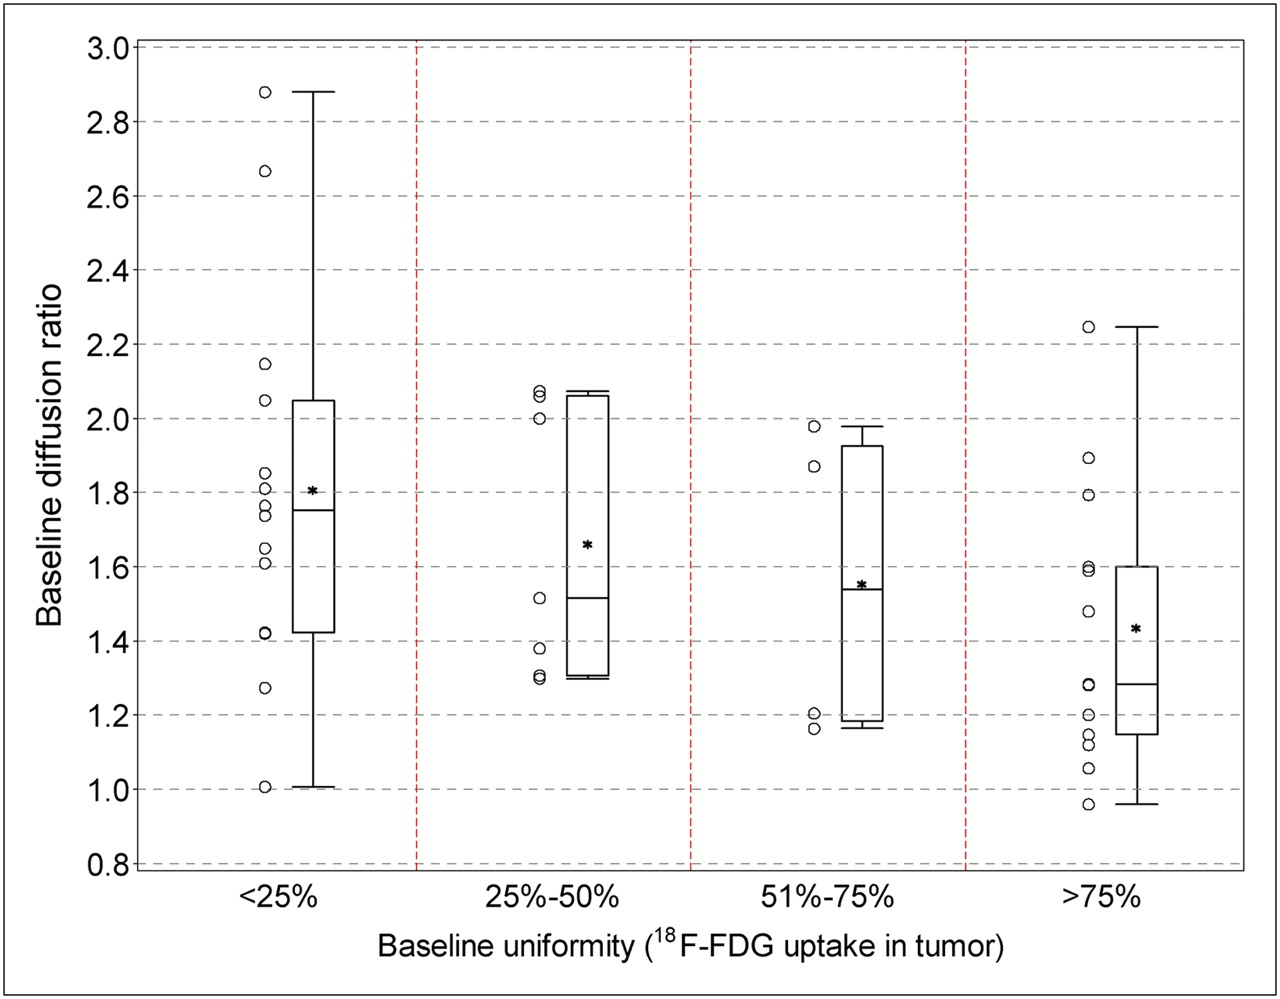
There is some evidence of an association between 2D continuous PET variables and intensity of 18F-FDG uptake. Specifically, for higher values of continuous PET variables the odds of being in a higher18F-FDG uptake intensity grade were increased ( Fig. 5A). In particular, a higher ratio of tumor 18F-FDG uptake to gray matter uptake was associated with a higher 18F-FDG uptake intensity grade (P ≤ 0.001). There was some evidence of association between 2D continuous PET variables and uniformity of 18F-FDG uptake, although this association was not as strong ( Fig. 5B). For example, a higher ratio of tumor 18F-FDG uptake to gray matter uptake was associated with a higher BSG 18F-FDG uptake uniformity grade (P = 0.03). There was no trend in association between intensity of 18F-FDG uptake on the baseline PET image with tumor size on the MR image, perfusion ratio, or diffusion ratio. There was no trend in association between uniformity of 18F-FDG uptake on the baseline PET image with tumor size on the MR image or perfusion ratio. However, there was some evidence that uniformity of 18F-FDG uptake was associated with the tumor diffusion ratio ( Fig. 6). Specifically, the diffusion ratio was lower on average for higher levels of uniformity (P = 0.025). There was also some evidence that for higher 18F-FDG uptake, enhancement was more likely to be observed in the tumor ( Table 5; Exact Cochran–Armitage trend test, P = 0.032). When only those tumors that had enhancement at baseline were considered, there was no association with 18F-FDG uptake (linear-to-linear association test, P = 0.40).
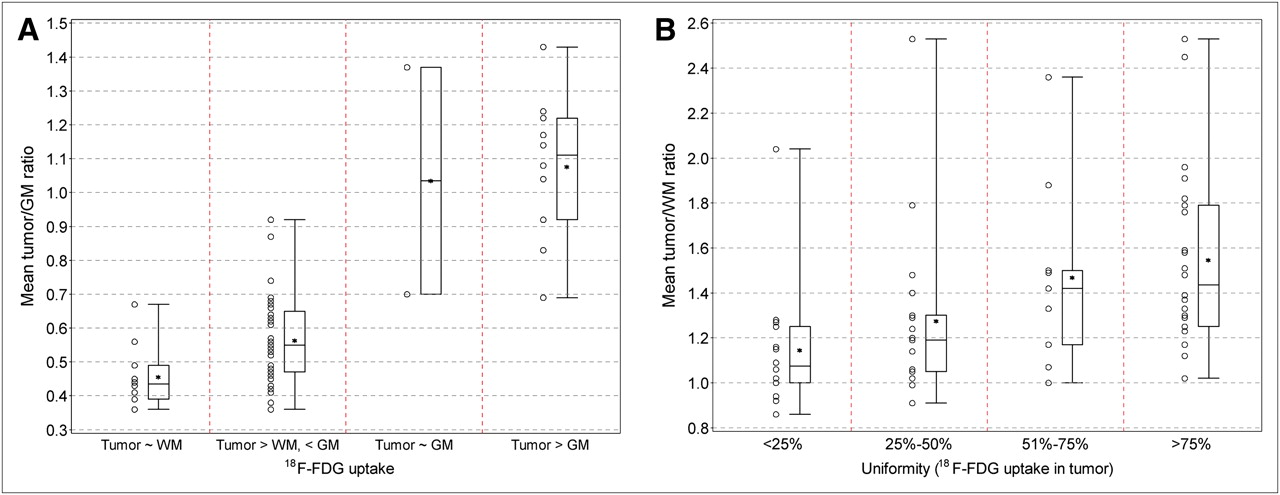
Association of 2D continuous PET variables and intensity (A) or uniformity (B) of BSG 18F-FDG uptake. There was some evidence of association between 2D continuous PET variables and intensity or uniformity of BSG 18F-FDG uptake (P ≤ 0.05). GM = gray matter; WM = white matter.

Association of uniformity of BSG 18F-FDG uptake with tumor diffusion ratio. There is some evidence that as uniformity of BSG 18F-FDG uptake increases, apparent diffusion coefficient decreases (P = 0.025), suggesting increasing cellularity in tumor corresponding to 18F-FDG uptake.
Comparison of Baseline PET BSG 18F-FDG Uptake with Tumor Enhancement on MRI
DISCUSSION
Clinical trials of children with newly diagnosed BSGs have been designed in the PBTC to investigate combinations of radiation therapy with investigational chemotherapeutic agents. In particular, trials PBTC-007 and PBTC-014 were designed to study the efficacy of concurrent radiation therapy with the molecularly targeted agents gefitinib and tipifarnib, respectively. Gefitinib is a selective inhibitor of epidermal growth factor receptor, a protein that may be overexpressed in neoplastic disease, leading to the activation of the Ras signal transduction cascade and uncontrolled cell proliferation. Tipifarnib is a farnesyltransferase inhibitor that may also affect the Ras signal transduction cascade and therefore cell proliferation.
MRI is often diagnostic in BSG, anatomically defining tumor extent, and serially used to assess response and status during and after therapy. However, precise tumor metabolic evaluation on standard MR images is limited. Several studies in adults have suggested that functional imaging with 18F-FDG PET complements anatomic MRI in the evaluation of brain tumors by identifying metabolically active disease. DiChiro et al. suggested that the intensity of 18F-FDG uptake was associated with the malignant tumor grade ( 17) and that intensely 18F-FDG–avid disease reflected high-grade disease and decreased patient survival ( 18). Results have varied regarding the association between 18F-FDG uptake intensity and prognosis. De Witte et al. concluded that in adults with a low-grade glioma, increased tracer uptake suggested a poor survival ( 28). This group later showed that in adults with a high-grade glioma, 18F-FDG uptake was not an independent predictor for prognosis ( 29). The results of adult studies may not be applicable to the pediatric population. Ultimately, PET appears to provide a helpful noninvasive tool for the evaluation of brain tumor metabolic activity ( 19, 30– 32).
Recently, studies have suggested that PET may be useful for the evaluation of children with BSGs. Kwon et al. reported 18F-FDG PET uptake in 12 children, with the suggestion that hypermetabolic tumors were more likely to reflect a glioblastoma, as opposed to little or no 18F-FDG uptake, which was more likely to reflect anaplastic astrocytomas or low-grade astrocytomas ( 21). Pirotte et al. reported 20 children with newly diagnosed BSG, all of whom had PET-guided stereotactic biopsy, indicating that PET guidance improved the diagnostic yield of stereotactic biopsy sampling and that PET data might carry prognostic value ( 22). All tumors with high 18F-FDG uptake were malignant and associated with a shorter survival time than tumors with absent or moderate 18F-FDG uptake ( 22). Williams et al. suggested that 3D maximum and mean tumor 18F-FDG uptake were associated with PFS in pediatric supratentorial anaplastic astrocytomas when using 3D PET analysis techniques ( 24).
In our evaluation, there was no evidence of association between the intensity of 18F-FDG uptake and PFS or OS, when evaluated objectively ( Fig. 3). Less than 20% of children survived progression-free 12 mo into the trial, and less than 20% were alive at 24 mo ( Fig. 2). The OS was slightly lower for children with intense 18F-FDG uptake ( Fig. 3). The techniques used showed evidence of an association between 2D continuous PET variables and subjective measures of intensity or uniformity of 18F-FDG uptake.
There was a suggestion that in tumors with metabolic activity in greater than 50% of the tumor volume, PFS and OS showed an apparent inferiority ( Fig. 4). In addition, both higher maximum tumor–to–gray matter ratios and higher mean tumor–to–gray matter ratios appeared to be associated with decreased survival ( Table 4). This may mean that more intense tracer uptake in the tumor than in normal gray matter suggests decreased survival. A larger study is needed to prospectively verify this hypothesis.
We compared MRI and PET and found that BSG 18F-FDG uniformity was associated with tumor diffusion ratio values ( Fig. 6). Specifically, when the diffusion value was lower, the uniformity of 18F-FDG uptake was higher, suggesting that increased tumor cellularity likely represents a greater number of viable tumor cells and higher 18F-FDG uptake throughout the tumor. Indeed, data reported by Palumbo et al. on 15 adults with metastatic brain lesions suggested that hypercellular tumors may have increased impedance to water diffusion, resulting in low ADC and high 18F-FDG uptake ( 33). Holodny et al. reported 21 adults with pathologically proven glial tumors of the brain and found that ADC maps appear to provide unique information that may be analogous to 18F-FDG PET, with increased 18F- FDG uptake corresponding to lower ADC values ( 34).
Only a few diffuse intrinsic BSGs had intense 18F-FDG uptake. Without a biopsy, the histologic milieu in children with a diffuse intrinsic BSG is unknown. However, these tumors at baseline often have increased diffusion likely reflecting a combination of tumor cellularity and vasogenic edema ( 35). In this study, the association between uniformity of 18F-FDG uptake and diffusion suggests that those tumors with lower 18F-FDG uptake have lower tumor cellularity at baseline.
Tumor size and perfusion were not associated with baseline 18F-FDG uptake or uniformity. However, there was a suggestion that with higher 18F-FDG uptake, tumor enhancement is more likely ( Table 5), which may reflect more aggressive disease because most BSGs do not enhance ( 36).
The principal limitation of this study is the sample size. Only 40 subjects within the 2 protocol studies received baseline 18F-FDG PET, making it difficult to draw significant inferences from this evaluation; the reported cohort is, however, larger than the cohorts in other published studies ( 21, 22). All children in this study had poor survival. Consequently, small differences in survival reflected by changes in intensity or uniformity of 18F-FDG uptake may have been difficult to appreciate statistically. Without biopsy, it is unknown whether these tumors represent a molecularly and pathologically heterogeneous group, which could also affect results. Future studies correlating PET with postmortem tissue sampling may be helpful but may be limited by possible changes in the tumor over time during treatment. Evaluation of a larger patient population is needed to establish the statistical significance of the parameters we have studied. Subsequent studies should also evaluate the relative difference between baseline and follow-up PET scans in the clinical evaluation of children with these brain tumors. Future studies may also investigate the use of PET radiopharmaceuticals besides 18F-FDG, including 11C-labeled methionine, 18F F-3,4-dihydroxyphenylalanine, 18F-labeled choline, and 18F-fluorothymidine, which may theoretically provide better sensitivity for cellular proliferation.
CONCLUSION
Most children with BSG demonstrate tumor 18F-FDG uptake that is less than uptake by the normal gray matter. Survival is poor, irrespective of the intensity of BSG 18F-FDG uptake; there is no association between intensity of 18F-FDG uptake, PFS, or OS. Our data suggest that intense tracer uptake may be seen in association with more uniform tracer uptake spread throughout the tumor and that intense tracer uptake in the tumor, compared with uptake in the normal gray matter, suggests decreased survival. When 18F-FDG uptake is seen in at least half the tumor, PFS and OS are subjectively shorter than when 18F-FDG is taken up in only a small portion of tumor.
Comparing MRI with PET, increased uniformity of 18F-FDG avidity may be associated with increased tumor cellularity. Further evaluation with more patients is needed to establish statistically significant associations that can provide prognostic information for clinical management.
Acknowledgments
We acknowledge the other-site PET physicians, including Drs. Randall Hawkins (University of California, San Francisco), James Mountz (Children's Hospital of Pittsburgh), Satoshi Minoshima (Seattle Children's Hospital), David Earl-Graef (Children's National), Stewart Spies (Children's Memorial), and John Butman (National Institutes of Health). We acknowledge Cynthia Dubé for manuscript preparation. This work was supported in part by NIH grant U01 CA81457 for the Pediatric Brain Tumor Consortium (PBTC), the Pediatric Brain Tumor Consortium Foundation (PBTCF), the Pediatric Brain Tumor Foundation of the United States (PBTFUS), and American Lebanese Syrian Associated Charities.
- © 2011 by Society of Nuclear Medicine
REFERENCES
- Received for publication July 20, 2010.
- Accepted for publication November 18, 2010.


Jump to section
Related Articles
Cited By...
- Evaluation of 11C-Methionine PET and Anatomic MRI Associations in Diffuse Intrinsic Pontine Glioma
- Value of 18F-FDG PET and PET/CT for Evaluation of Pediatric Malignancies
- 18F-FDG PET and MR Imaging Associations Across a Spectrum of Pediatric Brain Tumors: A Report from the Pediatric Brain Tumor Consortium
- Value of 18F-3,4-Dihydroxyphenylalanine PET/MR Image Fusion in Pediatric Supratentorial Infiltrative Astrocytomas: A Prospective Pilot Study
- Exploratory Evaluation of MR Permeability with 18F-FDG PET Mapping in Pediatric Brain Tumors: A Report from the Pediatric Brain Tumor Consortium