


Abstract
The pharmacokinetics of 18F-fluorodeoxythymidine (FLT), 18F-FDG, 11C-choline, and 18F-fluoroethylcholine (FEC) in 2 hormone-independent (PC-3, DU145) and 2 hormone-dependent (CWR22, PAC120) prostate cancer xenograft mouse models were evaluated by PET and compared by immunohistochemistry. Further investigation was performed to determine whether PET can detect early changes in tumor metabolism after androgen ablation therapy through surgical castration. Methods: PET was performed on 4 consecutive days. In addition, the CWR22 and PAC120 tumor models were surgically castrated after the baseline measurement and imaged again after castration. The tracer uptake was analyzed using time–activity curves, percentage injected dose per volume (%ID/cm3), and tumor-to-muscle ratio (T/M). Results: Regarding the hormone-independent prostate tumor models, 18F-FLT showed the best T/M and highest %ID/cm3 in PC-3 (2.97 ± 0.63 %ID/cm3) and DU145 (2.06 ± 0.75 %ID/cm3) tumors. 18F-FDG seemed to be the tracer of choice for delineation of the PC-3 tumors but not for the DU145 tumors. Using 11C-choline (PC-3: 1.33 ± 0.29 %ID/cm3, DU145: 1.60 ± 0.27 %ID/cm3) and 18F-FEC, we did not find any significant uptake in the tumors, compared with muscle tissue. Regarding the hormone-dependent prostate tumor models, the CWR22 model showed a highly significant (P < 0.01) decrease in tumor 18F-FDG uptake from 4.11 ± 1.29 %ID/cm3 to 2.19 ± 1.45 %ID/cm3 after androgen ablation therapy. However, the 18F-FLT, 11C-choline, or 18F-FEC tracers did not provide sufficient uptake or reliable information about therapy response in CWR22 tumors. The PAC120 model showed a significant increase in 18F-FLT tumor uptake (P = 0.015) after androgen ablation therapy. The accumulation of 18F-FEC (before: 2.32 ± 1.01 %ID/cm3, after: 1.36 ± 0.39 %ID/cm3) was found to be the next highest after 18F-FDG (before: 2.45 ± 0.93 %ID/cm3, after: 2.18 ± 0.65 %ID/cm3) in PAC120 tumors before castration and is better suited for monitoring therapy response. Conclusion: This comprehensive study in 2 hormone-dependent and 2 hormone-independent prostate tumor mouse models shows that 18F-FLT and 18F-FDG are the most appropriate tracers for delineation of PC-3, DU145 (except 18F-FDG), and CWR22 tumors, but not for PAC120 tumors. 18F-FEC and 11C-choline, in particular, revealed insufficient T/M ratio in the prostate tumor models. The results may indicate that radiolabeled choline and choline derivatives compete with a high concentration of the precursor dimethylaminoethanol, resulting in reduced uptake in small-rodent tumor models, a hypothesis that is currently under investigation in our laboratory.
Prostate cancer is the most prominent oncologic disease in men in the western world. Its spectrum ranges from insignificant, indolent cancer to aggressive stages with metastasis formation. This heterogeneity of prostate carcinoma makes it a difficult disease to diagnose and treat.
Although serum prostate-specific antigen is the most important diagnostic indicator of prostate malignancy used clinically, it fails to accurately track disease progression (1) and does not provide any information about regional or distant metastasis (2). Furthermore, it fails to differentiate between malignant carcinoma and benign prostatic hyperplasia or inflammation. Therefore, establishing a method that allows for the primary diagnosis and staging of prostate cancer and enables the following of treatment success or disease progression over long periods is of prime importance.
In the field of oncology, molecular imaging, PET specifically, provides important information for primary diagnosis, accurate staging, and detection of metastasis. After the development of combined PET/CT, prostate imaging using radiolabeled tracers was improved, enabling an exact segmentation of unspecific tracer accumulation in the bladder and specific tissue uptake (3). Considering the current activities in developing combined PET/MRI, prostate cancer diagnosis using PET tracers may become even more used for routine clinical diagnosis in the future (4,5).
Currently, the clinical gold standard in PET oncology is 18F-FDG. However, 18F-FDG is not suitable for imaging prostate carcinoma (6,7). The high bladder activity of 18F-FDG creates difficulty in differentiating between malignant prostate tissue and benign prostatic hyperplasia or inflammation. 18F-FDG is transported most effectively through glucose transporters 1 and 3 (GLUT-1 and GLUT-3, respectively) in cancer cells (8). However, glucose metabolism in well-differentiated prostate carcinoma cells is often lower than in cells of other tumor types, leading to low tumor 18F-FDG uptake and insufficient image contrast (9). This decreased metabolism could be because most prostate carcinoma cells are less metabolically active and slower growing than cells of other tumor types.
Another PET tracer for cancer imaging is 18F-fluorodeoxythymidine (FLT), a marker for cell proliferation (10). 18F-FLT may also be of potential interest for imaging prostate carcinoma because the intracellular target of 18F-FLT is thymidine kinase 1 (TK-1) (11). Clinical studies have shown that 18F-FLT may be a promising tracer for predicting and monitoring response to therapy in breast cancer (12,13). So far, 18F-FLT has been used for imaging prostate cancer only in preclinical studies (14).
The PET tracers currently most used for clinical prostate imaging are 11C-choline and its derivates. 11C-choline is transported into the tumor cell, phosphorylated by choline kinase α, and incorporated as phosphatidylcholine into the cell membrane (15). A major advantage of 11C-choline is its low bladder activity, especially in comparison to 18F-labeled tracers such as FDG. Thus, 11C-choline is already used for imaging prostate carcinoma in clinical diagnosis, generally as a staging biomarker during neoadjuvant and adjuvant therapies and for clarification of a relapse after treatment. However, 11C-choline is rarely used for primary diagnosis (16). Unfortunately, the exact biochemical background of choline metabolism still remains unclear and clinical PET studies validating 11C-choline are often contradictory (17–19). After surgery, use of 11C-choline often raises questions concerning differentiating relapsed malignant tissue from surgical necrosis or inflammation. Additionally, 11C-choline does not always confirm a prostate-specific antigen increase or decrease (20,21). Another drawback of 11C-choline is the short half-life (20 min) of the isotope 11C, which requires on-site production and is therefore not suitable for distribution among clinical satellite centers. Thus, two 18F-labeled derivates of 11C-choline, 18F-fluoroethylcholine (FEC) and 18F-fluorocholine (FCh), have been developed. These tracers supposedly have in vivo biodistribution and pharmacokinetics similar to 11C-choline (22,23). Although 18F-FEC and 18F-FCh show similar clinical results to choline and have the advantage of a 2-h half-life, their renal clearance and subsequent high degree of bladder activity rely on PET/CT.
Another PET tracer candidate for imaging prostate cancer is 11C-acetate (24), which was, however, not evaluated in this study. This tracer is displayed with low bladder activity and pharmacokinetics similar to 11C-choline (25).
The aim of this work was to validate 11C-choline and 18F-FEC in 4 different mouse models of human prostate cancer and compare them with the gold standards 18F-FLT and 18F-FDG. The different pharmacokinetics of the tracers and their uptake characteristics were evaluated by small-animal PET in mouse xenograft models of 2 human hormone-independent cancer cell lines, PC-3 and DU145, and 2 hormone-dependent tumor models, CWR22 and PAC120. Subsequently, we evaluated the effect of castration on the uptake characteristics of the 4 different tracers through the CWR22 and PAC120 mouse models. The in vivo imaging results were cross-correlated with immunohistochemistry.
MATERIALS AND METHODS
A detailed description of the preparation of the radiopharmaceuticals 18F-FDG, 18F-FLT, 11C-choline, and 18F-FEC, as well as of the animal models, tumor inoculation, and grafting, can be found in the supplemental data (supplemental materials are available online only at http://jnm.snmjournals.org). Furthermore, hematoxylin and eosin staining and immunohistochemistry are specified in the supplemental notes.
PET
PET for the hormone-independent PC-3 and DU145 model was performed using the microPET Focus scanner (Siemens) (26). All PET data were corrected for decay and dead time; however, our standard mouse imaging protocols do not include attenuation correction.
Dynamic and static small-animal PET was performed when the tumors had reached a mean size (±SD) of 278 ± 239 mm3 for PC-3 (n = 12) or 58 ± 21 mm3 for DU145 (n = 11) (first imaging day) (Supplemental Fig. 1). Tumor volumes were assessed by external measurement with a caliper along the long axis (length a) and the short axis (width b). Volume was calculated by the following formula: (radical(a × b)) × (a × b) × 0.5236 (approximated to the volume calculation of an ellipsoid).
The mice were imaged on 4 consecutive days with the 4 different tracers: 18F-FLT, 18F-FDG, 11C-choline, and 18F-FEC. The tracers were injected through the lateral tail vein. Dynamic animal PET data were acquired in list mode over 1.5 h for 18F-FDG, over 2 h for 18F-FLT and 18F-FEC, and over 1 h for 11C-choline. Time–activity curves were used to determine the optimal uptake time in the tumor for each tracer and each tumor mouse model. On the basis of this information, 20-min static scans were obtained at 50 min (PC-3) and 10 min (DU145) after injection of 18F-FDG, at 50 min (PC-3 and DU145) after injection of 18F-FLT, and at 60 min (PC-3) or 30 min (DU145) after injection of 18F-FEC.
All 11C-choline scanning was performed as dynamic scans over 1 h. For all 18F tracers, a total activity of 10 ± 2 MBq per mouse was injected, whereas for 11C-choline, 13 ± 3 MBq was injected. During 18F-FLT and 18F-FEC tracer uptake, the mice were awake, whereas the animals were warmed and kept under anesthesia during 18F-FDG tracer uptake.
PET for the hormone-dependent CWR22 and PAC120 models was performed using an Inveon small-animal PET scanner (Siemens) (27,28).
Dynamic and static small-animal PET was performed when tumors had reached a mean size of 481 ± 333 mm3 for CWR22 (n = 18, 4–6 wk after implantation [first imaging day]) or 73 ± 49 mm3 for PAC120 (n = 19, 6–8 wk after implantation [first imaging day]) (Supplemental Fig. 2). The animals were imaged using the same imaging protocols and same animal-handling procedures as described for the PC-3 and DU145 tumor-bearing mice.
Again, on the basis of the dynamic data, static scans were performed at 60 min after injection of 18F-FDG, at 60 min (CWR22) or 50 min (PAC120) after injection of 18F-FLT, and at 60 min after injection of 18F-FEC. The first 4 consecutive days of imaging served as the baseline measurement for the hormone-dependent mouse models. After this baseline, the CWR22 and PAC120 tumor-bearing mice were surgically castrated and again imaged 2–3 wk after castration.
After the last scan, the animals were sacrificed and tumors were excised for further evaluation by immunohistochemistry and histology. During dynamic and static measurements, the mice were warmed through a heating pad and kept under anesthesia by 1.5% isoflurane evaporated in 0.8 L of O2 per minute. For 18F-FDG measurements, the animals were kept fasting for 9–15 h before tracer injection.
PET image reconstruction was performed with 2-dimensional iterative ordered-subset expectation maximization. The reconstructed PET images were analyzed with the software package AsiPro (Siemens). After decay correction and normalization of the data to the injected activity, 3-dimensional regions of interest based on the visually identified size of the tumor were drawn. Three regions of interest were placed over 3 consecutive slices in the shoulder muscle, serving as control regions.
Tracer uptake was analyzed by retrieving time–activity curves from the dynamic scans, percentage injected dose per volume (%ID/cm3), and tumor-to-muscle ratio (T/M). The presented data are pooled data from 2 or 3 studies per xenograft model. We conducted our investigations at least twice per tumor model to verify our findings. All imaging studies were performed in our laboratory.
Statistics
Differences in tracer uptake were compared using the 2-tailed Student t test, type 3. Data were represented as the mean ± SD. A value of P less than 0.05 was considered as statistically significant, and a value of P less than 0.01 as highly statistically significant.
RESULTS
PET of PC-3 and DU145 Tumor Models
The best in vivo tumor delineation from muscle tissue was observed with 18F-FLT (Fig. 1) for both mouse models. The time–activity curves of the tumors (Fig. 1A) reached a plateau at about 3,600 s after tracer injection. At the same time, the time–activity curve of the muscle uptake showed a significant tracer washout. Therefore, the PET scans started at 50 min after injection, which covered the plateau of tracer uptake and revealed 2.97 ± 0.63 %ID/cm3 for PC-3 and 2.06 ± 0.75 %ID/cm3 for DU145 (Fig. 1B). The 18F-FLT muscle %ID/cm3 in the static scans (PC-3: 0.90 ± 0.14, DU145: 0.74 ± 0.28) showed almost the same values for both animal models.
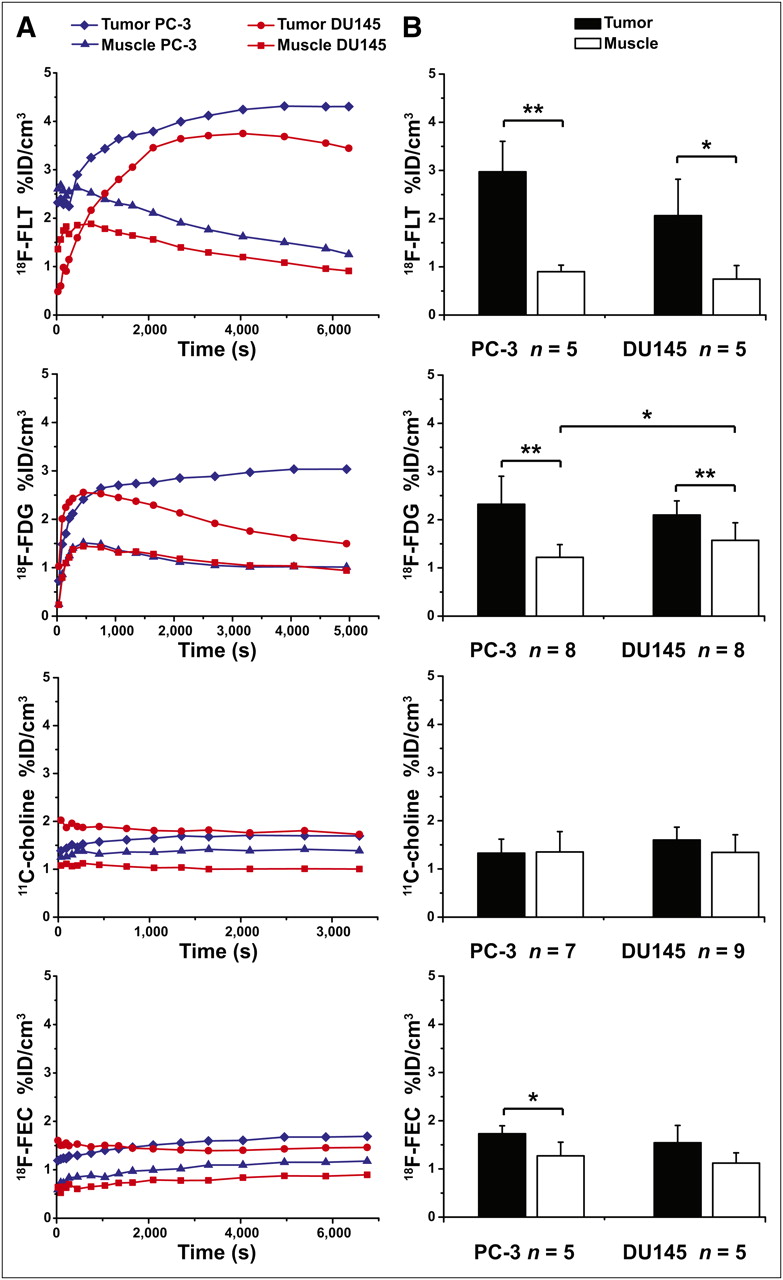
(A) Representative time–activity curves in %ID/cm3 from particular tracer imaged in subcutaneous hormone-independent prostate tumor mouse models PC-3 and DU145. (B) Static mean tumor and muscle uptake in %ID/cm3. Error bars represent SD. *P < 0.05. **P < 0.01.
Static 18F-FDG PET data revealed an uptake in PC-3 tumors of 2.32 ± 0.62 %ID/cm3, and the DU145 tumors showed 2.10 ± 0.30 %ID/cm3 (scan started 600 s after injection) at the time point with the highest tracer accumulation (Fig. 1). The 18F-FDG muscle uptake was lower for PC-3 (1.22 ± 0.30 %ID/cm3) than for DU145 (1.57 ± 0.36 %ID/cm3). The equilibrium for the PC-3 tumors was reached at approximately 2,700 s after tracer injection. The dynamic curves (Fig. 1A) reveal that 18F-FDG is not trapped in DU145 tumor cells.
The pharmacokinetics of 11C-choline demonstrated a rapid initial tracer uptake into both tumors, which reached a constant plateau in the time–activity curve at 180–300 s after injection (Fig. 1A). At 1,200 s after injection, however, both tumor cell lines showed only a low uptake: 1.33 ± 0.29 %ID/cm3 for PC-3 and 1.60 ± 0.27 %ID/cm3 for DU145 (Fig. 1B). The uptake of 11C-choline in the muscle was between 1.35 ± 0.42 %ID/cm3 (PC-3) and 1.34 ± 0.37 %ID/cm3 (DU145).
18F-FEC pharmacokinetics and uptake in the PC-3 and DU145 tumors were comparable to 11C-choline. 18F-FEC reached 1.73 ± 0.17 %ID/cm3 at 3,600 s after injection in the PC-3 tumors and 1.54 ± 0.36 %ID/cm3 at 1,800 s after injection in the DU145 tumors (Fig. 1B). The 18F-FEC uptake in the muscle was 1.27 ± 0.28 %ID/cm3 for the PC-3 mice and 1.12 ± 0.21 %ID/cm3 for the DU145 mice.
The best T/Ms for the PC-3 (3.31 ± 0.54) and DU145 (2.80 ± 0.61) tumors were achieved with 18F-FLT. 18F-FDG revealed a significant difference between the T/Ms of PC-3 (1.96 ± 0.54) and DU145 (1.38 ± 0.33). The T/Ms of PC-3 tumors were 1.05 ± 0.32 for 11C-choline and 1.41 ± 0.29 for 18F-FEC. Only a moderate 11C-choline uptake could be found in DU145 tumors, leading to a T/M of 1.26 ± 0.35, similar to 18F-FEC with a T/M of 1.38 ± 0.21. Supplemental Figure 3 shows representative PET images.
Immunohistochemistry of PC-3 and DU145 Tumors
The histologic and immunohistochemical analysis performed with antibodies against Ki67, TK-1, GLUT-1, and GLUT-3 for the 2 hormone-independent tumor entities are shown in Supplemental Figure 4. Hematoxylin and eosin staining of the PC-3 tumor showed a diffuse solid growth of large neoplastic cells with moderate nuclear pleomorphism and abundant mitoses (Supplemental Fig. 4A). Ki67 staining confirmed the high proliferation index of the tumor cells, with a mean value of 75%. In contrast, TK-1 staining revealed a mean proliferation index of 51%. GLUT-1 was expressed in a relatively high percentage of the tumor cells; in contrast, GLUT-3 was not expressed (Supplemental Fig. 4A). The histologic analysis of the DU145 cells reveals tumors characterized by a diffuse growth pattern composed of pleomorphic cells with numerous mitoses (Supplemental Fig. 4B). The Ki67 staining showed a mean proliferation index of 65%, with a TK-1 index of 40%. GLUT-1 staining was observed only in isolated cells (arrow), whereas GLUT-3 was found in small groups of cells (arrows) (Supplemental Fig. 4B).
PET of CWR22 and PAC120 Tumors
After the baseline measurements with all 4 tracers, the animals were surgically castrated and imaged again at 2 (PAC120) or 3 (CWR22) weeks after castration to investigate possible changes in tumor tracer uptake caused by simulated androgen ablation therapy. Castration led to a volume reduction in CWR22 tumors (baseline: 481 ± 333 mm3 (n = 18) [first imaging day]; 3 wk after castration: 280 ± 180 mm3 (n = 11) [first imaging day]). A change of tracer uptake on PET after therapy was observed earlier than a reduction in tumor volume in PAC120 tumors (baseline: 73 ± 49 mm3 (n = 19) [first imaging day]; 2 wk after castration: 100 ± 60 mm3 (n = 11) [first imaging day]) (29) (Supplemental Fig. 2B), and a clear change of tumor microenvironment was seen in the immunohistochemistry 2 wk after castration.
CWR22
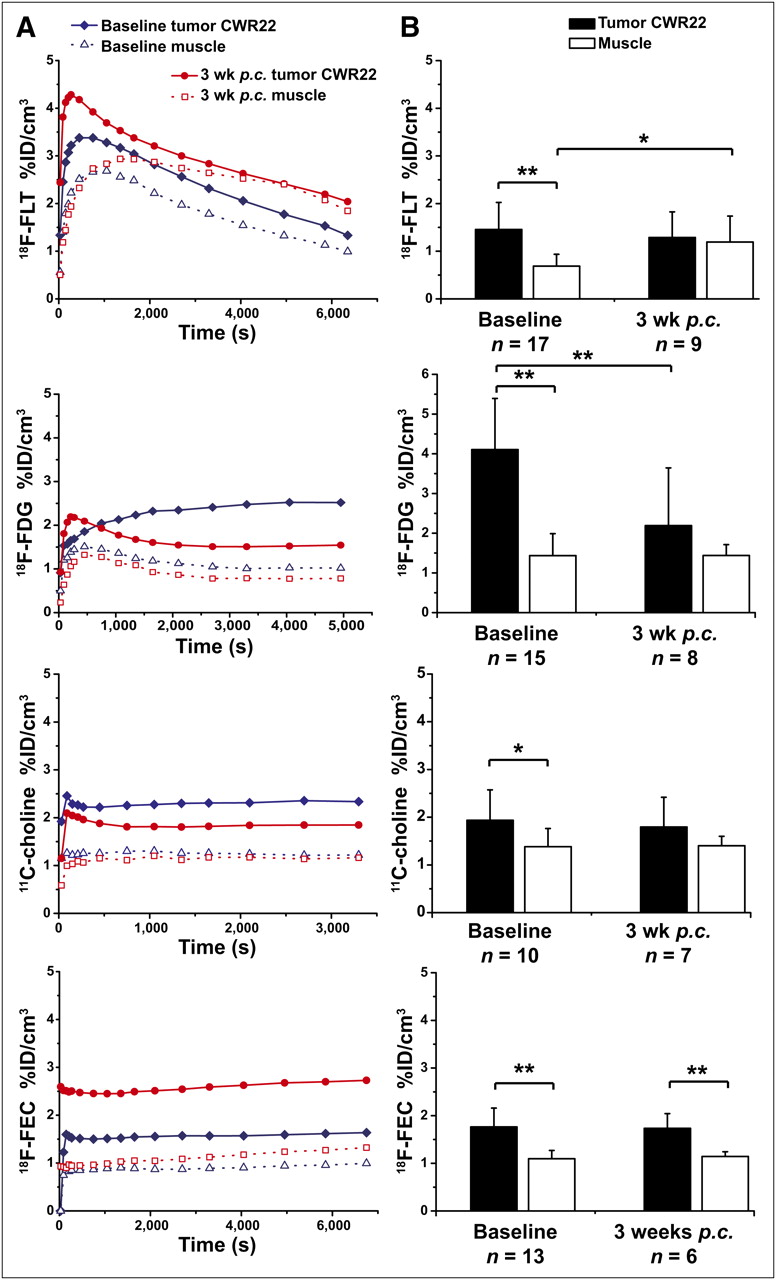
The time–activity curves of 18F-FLT showed nearly no tracer trapping in the CWR22 tumors (Fig. 2A), resulting in 1.38 ± 0.65 %ID/cm3 3,600 s after injection; for the muscle, the value was 0.69 ± 0.24 %ID/cm3 (Fig. 2B). There was a slight decrease of tracer accumulation in the tumor, to 1.16 ± 0.65 %ID/cm3, at 3 wk after castration (Fig. 2B). For the muscle uptake, we saw a significant increase of tracer accumulation, from 0.69 ± 0.24 %ID/cm3 to 1.19 ± 0.51 %ID/cm3 (P = 0.024), after castration (Fig. 2B).

(A) Representative time–activity curves in %ID/cm3 of particular tracer in subcutaneous tumors of hormone-dependent prostate cancer tumor mouse model CWR22 before and after castration. (B) Static mean data of tracer uptake in tumors and muscle for CWR22 mouse model in %ID/cm3. Error bars represent SD. p.c. = after castration. *P < 0.05. **P < 0.01.
In the CWR22 tumor model, the time–activity curve (Fig. 2A) showed a slow accumulation of 18F-FDG in the tumor and the formation of a plateau at 3,600 s after injection (4.11 ± 1.29 %ID/cm3, Fig. 2B). The 18F-FDG muscle uptake was 1.44 ± 0.55 %ID/cm3. After therapy, the CWR22 model showed a significant (P = 0.008) decrease of 18F-FDG in the tumor (2.19 ± 1.45 %ID/cm3, Fig. 2B), whereas muscle uptake remained stable after castration.
With 11C-choline and 18F-FEC, the CWR22 tumors had a pattern similar to the PC-3 and DU145 tumors. The pharmacokinetics of 11C-choline and 18F-FEC demonstrated a rapid initial tracer uptake, reaching a constant plateau at 180–300 s after injection (Fig. 2A). For the baseline measurements, the CWR22 tumors presented a moderate uptake of 11C-choline at 1,200 s after injection (1.94 ± 0.64 %ID/cm3) and a moderate uptake of 18F-FEC at 3,600 s after injection (1.77 ± 0.39 %ID/cm3). After therapy, a small decrease in tumor uptake was detected with 11C-choline (1.79 ± 0.62 %ID/cm3), whereas no changes were seen with 18F-FEC (1.73 ± 0.31 %ID/cm3, Fig. 2B). Tracer accumulation into the muscle did not change significantly for 11C-choline or 18F-FEC after surgical castration.
A highly significant decrease, caused by the increased muscle uptake after castration, for the T/M was found with 18F-FLT (before: 2.04 ± 0.65, after: 0.99 ± 0.42). However, this decrease did not relate to any change in the tumor accumulation. Using 18F-FDG, we observed a highly significant (P = 0.0064) decrease in the T/M (3.14 ± 1.15 to 1.62 ± 1.08) until 3 wk after castration. Neither 11C-choline nor 18F-FEC showed significant differences in the T/M of the CWR22 model. Both tracers showed only a slight decrease in the T/M (11C-choline before: 1.50 ± 0.56, after: 1.29 ± 0.46; 18F-FEC before: 1.62 ± 0.32, after: 1.52 ± 0.25). Supplemental Figure 5 displays representative PET images from the CWR22 tumor model before and after therapy.
PAC120
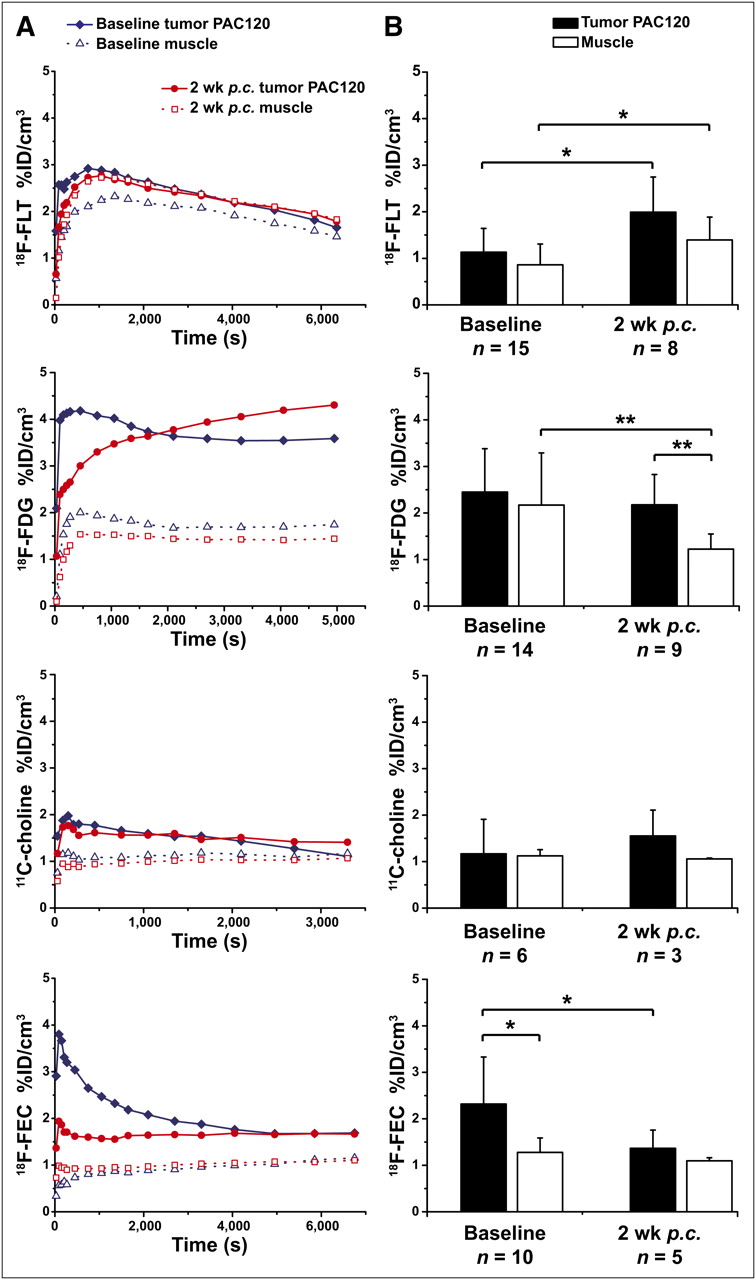
The PAC120 tumor model demonstrated a rapid but low accumulation followed by washout of 18F-FLT in the dynamic PET images (Fig. 3A). Subsequently, PAC120 tumors showed a %ID/cm3 of only 1.13 ± 0.75 and 0.86 ± 0.44 in the muscle at 3,000 s after injection (Fig. 3B). We observed a significant increase (P = 0.015) in the 18F-FLT tumor uptake (1.99 ± 0.75 %ID/cm3) at 2 wk after castration (Fig. 3B). Additionally, similar to the CWR22 model, muscle uptake increased after castration (1.39 ± 0.49 %ID/cm3).

(A) Representative time–activity curves in %ID/cm3 of particular tracer in PAC120 tumor mouse model before and after castration. (B) Static mean data of tumor and muscle in %ID/cm3 for PAC120 mouse model. Error bars represent SD. p.c. = after castration. *P < 0.05. **P < 0.01.
Using 18F-FDG, we observed a rapid uptake into the tumor followed by a constant plateau after 2,000 s after injection (Fig. 3A). The %ID/cm3 of the tumors was 2.45 ± 0.93 at 3,600 s after injection, and the %ID/cm3 of the muscle was 2.17 ± 1.12 at the baseline measurement (Fig. 3B). Mimicking androgen ablation therapy by castration decreased 18F-FDG tracer muscle uptake significantly (1.23 ± 0.32 %ID/cm3, P = 0.0091), compared with a moderately decreased tumor uptake (2.18 ± 0.65 %ID/cm3).
With 11C-choline and 18F-FEC we saw a similar pattern for all investigated prostate tumor models; the pharmacokinetics of 11C-choline and 18F-FEC demonstrated a rapid initial tracer uptake into the PAC120 tumors that reached a plateau at 180–300 s after injection (Fig. 3A). 11C-choline reached 1.17 ± 0.74 %ID/cm3 before and 1.55 ± 0.56 %ID/cm3 after castration at 1,200 s after injection (Fig. 3B). Muscle uptake changed from 1.12 ± 0.13 %ID/cm3 to 1.06 ± 0.02 %ID/cm3. Neither alteration was statistically significant.
18F-FEC showed the second-highest (after 18F-FDG) uptake in this tumor model (2.32 ± 1.01 %ID/cm3 before and 1.36 ± 0.39 %ID/cm3 after castration, P = 0.022) (Fig. 3B). No significant changes in tracer uptake were found in the muscle (before: 1.28 ± 0.31 %ID/cm3, after: 1.10 ± 0.07 %ID/cm3, P = 0.073). The 18F-FEC pharmacokinetics were similar and comparable to 11C-choline.
18F-FLT showed no change in T/M (before: 1.39 ± 0.26, after: 1.44 ± 0.25). The 18F-FDG T/M of PAC120 demonstrated an increase from 1.29 ± 0.44 %ID/cm3 at baseline to 1.83 ± 0.50 %ID/cm3 at 2 wk after castration (P = 0.019). The T/M of 11C-choline showed an increase from 1.01 ± 0.52 to 1.47 ± 0.51 after castration. For 18F-FEC, we noticed a decrease in the T/M from 1.85 ± 0.88 to 1.25 ± 0.35 after castration. Supplemental Figure 6 displays representative PET images from the PAC120 tumor model before and after therapy.
Immunohistochemistry of CWR22 and PAC120 Tumors
CWR22
The results of the histologic and immunohistochemical analyses of CWR22 tumors are displayed in Supplemental Fig. 7. The hematoxylin and eosin staining showed a diffuse growth pattern with areas of necrosis (arrows) and abundant mitosis. The Ki67 staining confirmed a high proliferation index with a mean of 60% before treatment. At 3 wk after castration, the hematoxylin and eosin staining revealed a dramatic reduction of tumor cells and an increase in macrophages and fat cells (clear areas). Mitoses were rather rare. The Ki67 staining showed a low mean proliferation index of 3%, demonstrating the efficacy of androgen ablation therapy. The TK-1 staining showed results similar to the Ki67 staining (before: 32% positive, after: 1% positive) (Supplemental Fig. 7). GLUT-1 was expressed in a minority of tumor cells (arrow) before castration; at 3 wk after castration, no expression of GLUT-1 was observed. GLUT-3 was not expressed in CWR22 tumors.
PAC120
Supplemental Figure 8 displays the results of the histologic and immunohistochemical analyses of PAC120 tumors. The hematoxylin and eosin staining showed tumors with a solid, diffuse growth pattern and abundant mitoses. In contrast to the CWR22 tumors, almost no necrosis was observed. The Ki67 staining showed a high mean proliferation index of 63% before treatment. At 2 wk after castration, hematoxylin and eosin staining revealed regression of the tumors, with reduced tumor cell content and abundant macrophages and fat cells. The mitosis index was reduced to 20%. The TK-1 index was relatively low and changed from 24% to 13%. GLUT-1 showed results similar to the CWR22 tumors, with only moderate expression before treatment and no expression after treatment. Similarly, GLUT-3 expression was not observed.
DISCUSSION
In this project, we investigated the uptake characteristics of 18F-FLT, 18F-FDG, 11C-choline, and 18F-FEC in 2 human hormone-independent prostate tumor models, PC-3 and DU145, and 2 hormone-dependent models, CWR22 and PAC120. The tracer pharmacokinetics were evaluated before and after surgical castration in the CWR22 and PAC120 mouse models, mimicking androgen ablation therapy.
18F-FLT showed the highest %ID/cm3 and best T/M for PC-3 and DU145 (Fig. 1). 18F-FDG also displayed sufficient, although lower, absolute uptake and poorer T/M than 18F-FLT. The dynamic data showed identical 18F-FLT uptake characteristics for PC-3 and DU145 tumors. Although 18F-FDG showed a slow but high uptake in PC-3 tumors, there was lower uptake in DU145 tumors and a significant washout starting at 500 s after injection.
By contrast, we did not find sufficient uptake of 11C-choline and 18F-FEC in these tumor entities. For both tumors, the dynamic measurements of 11C-choline and 18F-FEC showed a fast but low tracer uptake and a plateau over 3,600 s or 7,200 s, respectively.
The 18F-FLT uptake observations were consistent with the Ki67 and TK-1 immunohistochemistry (Supplemental Fig. 4A). Although Ki67 does not necessarily correlate with 18F-FLT uptake (30), in this case it does better reflect the 18F-FLT uptake than TK-1. GLUT-1 was elevated in PC-3 tumors but only moderately in DU145 (Supplemental Fig. 4B). This result could explain the low 18F-FDG uptake and the washout characteristics of the DU145 tumors. Therefore, the 18F-FDG uptake within the first 1,000 s most probably results from the blood-pool activity. The static 18F-FDG PET images of DU145 mice, acquired at 600 s after injection, revealed high activity in the liver, intestine, and muscle, leading to a low T/M but still sufficient compared with PC-3 (Supplemental Fig. 3). If we had chosen a later scanning time point, the differences in uptake measurements for PC-3 and DU145 would have been more obvious. GLUT-3 plays a minor role in DU145.
In contrast to the hormone-independent models, we observed in the CWR22 and PAC120 tumors a lower uptake of 18F-FLT. For both tumors, the time–activity curves show a strong tracer washout after the initial perfusion phase. The low uptake of the proliferation marker 18F-FLT is in line with the slow growth rate of the CWR22 and PAC120 tumors (Supplemental Fig. 2). CWR22 tumors showed a sufficient and—compared with the muscle—highly significant 18F-FDG uptake. Most important, 18F-FDG uptake in CWR22 tumors was significantly reduced 3 wk after castration (Fig. 2B). Compared with muscle, a low but significant 11C-choline uptake was found in CWR22 tumors (Fig. 2B). 11C-choline uptake in PAC120 tumors was at the background levels of muscle tissue (Fig. 3). However, in both tumors time–activity curves showed a fast tracer uptake that remained stable over 1 h. 18F-FEC also revealed low tracer uptake but highly significant T/M in the CWR22 model. Tracer uptake of 18F-FEC did not change after castration. In PAC120 mice, PET scans with 18F-FEC revealed a significantly higher tracer uptake in the tumor compared with the muscle before castration. After androgen ablation therapy, the 18F-FEC uptake in the tumor was significantly reduced. In 11C-choline and 18F-FEC-PET scans, we found high levels of tracer uptake in liver, kidneys, and intestine, making delineation of the tumor in same animals difficult (Supplemental Fig. 6).
In CWR22 and PAC120, Ki67 expression was approximately 60%, which was similar to that found in the PC-3 and DU145 tumors. In sharp contrast, we found a much lower TK-1 expression in hormone-dependent tumors, as might explain the low 18F-FLT uptake (Supplemental Figs. 7 and 8). Ki67 was significantly reduced after castration in CWR22 and PAC120, whereas a reduction of TK-1 was found only in CWR22. Interestingly, the reduced Ki67 and TK-1 expression was not reflected by the 18F-FLT uptake of CWR22 mice after hormone depletion (Fig. 2B). A statistically significant enhanced uptake of 18F-FLT in muscle tissue was found in both mouse models after castration. GLUT-1 was elevated in CWR22 and PAC120 tumors but disappeared after surgical castration, as reflects the 18F-FDG pharmacokinetics in CWR22 mice. In PAC120 tumors, 18F-FDG uptake was not reduced 2 wk after castration, although GLUT-1 expression was diminished at that time (Supplemental Fig. 8). GLUT-3 seemed to play no role in either tumor model.
Particularly in the 18F-FLT-PET scans, we saw that the quantitative tracer uptake (%ID/cm3) was significantly higher for dynamic scans than for static scans (Figs. 1–3). These findings are currently under detailed evaluation. First results indicate that the anesthesia has a strong effect on 18F-FLT pharmacokinetics. A similar effect was observed for dynamic 18F-FDG scans in PC-3 tumors. However, these discrepancies between static and dynamic %ID/cm3 result from uptake values evaluated in 3 of 8 dynamic scans and were not linked to anesthesia effects because the mice were also anesthetized during the tracer uptake for static scans.
Although several clinical studies have shown the potential of 11C-choline, 18F-FCh, and 18F-FEC for PET in tumors, the sensitivity and specificity for detecting prostate cancer are limited (17,18). In addition, the exact relation between prostate-specific antigen and 11C-choline uptake is not known and the significance of clinical studies using 11C-choline is seen as contradictory (17–19).
Our study revealed that 18F-FDG and 18F-FLT are better suited than 11C-choline and 18F-FEC for imaging hormone-independent xenograft tumors.
18F-FLT revealed a weak but significantly higher uptake only in CWR22 tumors, compared with muscle tissue. In CWR22 tumors, 18F-FDG turned out to be the best tracer for tumor detection and monitoring of therapy response. However, in the clinic 18F-FDG has limitations for primary staging and imaging of metastasis in prostate cancer (31).
11C-choline did not provide sufficient tumor delineation and could not be used as an indication for successful androgen ablation therapy. In both hormone-dependent tumor mouse models, 18F-FEC was better than 11C-choline, although a reduction of 18F-FEC in tumors after therapy could be found only in the PAC120 xenograft tumors (Fig. 3B). Comparable results in CWR22 mice were found for 18F-FLT before and after castration by Oyama et al. (14). In CWR22 and PC-3 tumors, we found a 18F-FDG T/M that was approximately a factor of 2 higher than the one reported by Jadvar et al. (32). Krause et al. showed in a PC-3 tumor model a T/M of 1.8 ± 0.4 before treatment and was able to monitor with 11C-choline a therapy response when using docetaxel (33). Even a higher 11C-choline uptake of 12.5 %ID/g in CWR22 and of 10.2–23.1 %ID/g in PC-3 tumors was found by Fei et al. (34).
Our results reveal that none of the studied mouse xenograft tumor models for prostate cancer are valuable for translational examinations using 11C-choline or its derivates. However, for basic research the hormone-independent PC-3 and the hormone-dependent CWR22 tumor models are good tools when 18F-FLT or 18F-FDG is used, as well as for therapy monitoring (CWR22) (Supplemental Table 1). Both models are easy to handle, reproducible, and reliable.
Our results further support the hypothesis from recent publications that an excess of the nonlabeled precursor dimethylaminoethanol may inhibit the specific uptake of 11C-choline in prostate tumors (35–39). This effect can specifically play an important role in small rodents because the ratio of injected precursor to the entire body mass is more unfavorable than in larger subjects. Unexpectedly, 18F-FEC showed a higher uptake than 11C-choline in both hormone-dependent and PC-3 tumors, although in vitro studies showed that the uptake of fluorinated compounds such as 18F-FEC in phospholipids is slower than that of 11C-choline (35,40). The fact that we found a higher 18F-FEC than 11C-choline T/M may support the hypothesis of confounding uptake effects from dimethylaminoethanol because the total injected dimethylaminoethanol content was probably lower in 18F-FEC studies than in 11C-choline studies. Rosen et al. (36) showed that the uptake of 11C-choline in tumors is 6 times higher when the dimethylaminoethanol concentration is under 1 μg/kg. Leyton et al. (41) designed 18F-fluoromethyl-[1,2-2H4]-choline, which enhances the sensitivity of tumor imaging through increased availability of substrate.
The influence of dimethylaminoethanol in prostate cancer imaging needs to be further evaluated.
CONCLUSION
Our study aimed at a comprehensive evaluation of 18F-FLT, 18F-FDG, 11C-choline, and 18F-FEC in 2 hormone-dependent and 2 hormone-independent prostate tumor mouse models. We found that 18F-FLT and 18F-FDG reveal appropriate uptake in PC-3, DU145 (except 18F-FDG), and CWR22 but not in PAC120 prostate tumors.
18F-FEC and, in particular, 11C-choline were not able to reveal a sufficient T/M in most tumors. These results may confirm that radiolabeled choline and choline derivates compete with the precursor dimethylaminoethanol, resulting in reduced uptake in small-rodent prostate tumor models.
DISCLOSURE STATEMENT
The costs of publication of this article were defrayed in part by the payment of page charges. Therefore, and solely to indicate this fact, this article is hereby marked “advertisement” in accordance with 18 USC section 1734.
Acknowledgments
We thank Funda Cay, Daniel Bukala, Maren Koenig, and Mareike Lehnhoff for excellent technical assistance, as well as Denis Lamparter, Anke Stahlschmidt, and Nadja Buckmüller for tracer synthesis. Further, we thank Julia Mannheim for PET imaging support. This work was supported by the Deutsche Forschungsgemeinschaft (MA 1096/6-1, PI 771/4-2). No other potential conflict of interest relevant to this article was reported.
Footnotes
Published online Aug. 22, 2011.
- © 2011 by Society of Nuclear Medicine
REFERENCES
- Received for publication December 19, 2010.
- Accepted for publication June 30, 2011.


