


Abstract
Histopathologic validation of a PET tracer requires assessment of colocalization of the tracer with its intended biologic target. Using thin tissue section autoradiography, it is possible to visualize the spatial distribution of the PET tracer uptake and compare it with the distribution of the intended biologic target (as visualized with immunohistochemistry). The purpose of this study was to develop and evaluate an objective methodology for deformable coregistration of autoradiography and microscopy images acquired from a set of sequential tissue sections. Methods: Tumor-bearing animals were injected with 3′-deoxy-3′-18F-fluorothymidine (18F-FLT), 14C-FDG, and other markers of tumor microenvironment including Hoechst 33342 (blood-flow surrogate). After sacrifice, tumors were excised, frozen, and sectioned. Multiple stacks of sequential 8 μm sections were collected from each tumor. From each stack, the middle (reference) sections were used to obtain images of 18F-FLT and 14C-FDG uptake distributions using dual-tracer autoradiography. Sections adjacent to the reference were used to acquire all histopathologic data (e.g., images of cell proliferation, hematoxylin and eosin). Hoechst images were acquired from all sections. To correct for deformations and misalignments induced by tissue processing and image acquisition, the Hoechst image of each nonreference section was deformably registered to the reference Hoechst image. This transformation was then applied to all images acquired from the same tissue section. In this way, all microscopy images were registered to the reference Hoechst image. The Hoechst-to-autoradiography image registration was done using rigid point-set registration based on external markers visible in both images. Results: The mean error of Hoechst to 18F-FLT autoradiography registration (both images acquired from the same section) was 30.8 ± 20.1 μm. The error of Hoechst-based deformable registration of histopathologic images (acquired from sequential tissue sections) was 23.1 ± 17.9 μm. Total error of registration of autoradiography images to the histopathologic images acquired from adjacent sections was evaluated at 44.9 μm. This coregistration precision supersedes current rigid registration methods with reported errors of 100–200 μm. Conclusion: Deformable registration of autoradiography and histopathology images acquired from sequential sections is feasible and accurate when performed using corresponding Hoechst images.
- PET tracer validation
- small animal tumor models
- autoradiography
- immunohistochemistry
- multi-modality deformable image registration
Deregulated growth and abnormal cancer cell phenotypes result in a highly heterogeneous tumor microenvironment. Direct visualization of different microenvironmental aspects of the tumor, such as hypoxia and proliferation, provides diagnostic information that could allow for better patient care and management. For this purpose, numerous immunohistochemistry and immunofluorescent microscopy techniques have been established. Furthermore, the exploration of tumor microenvironment has been translated to diagnostic imaging through the rapidly developing field of molecular imaging. Specific biomarker probes can be administered and visualized in vivo with the aid of functional imaging modalities such as PET. In addition, it has been suggested that the efficacy of radiation treatment may be increased considerably by creating and delivering heterogeneous dose distributions based on PET data (1–3). However, until now, only phase I dose escalation trials based on 18F-FDG imaging have been conducted (4,5).
The chaotic nature of tumor vascularization and irregularities of blood flow can significantly affect the spatial distribution of the tracer within the tumor tissue. Correspondingly, one of the required initial validation steps for any PET tracer to be used in image-guided radiotherapy is the in vivo demonstration of spatial concordance between the pattern of intratumoral PET tracer uptake and the spatial pattern of its biologic target that can be imaged with histopathologic or immunohistopathologic techniques. However, the registration of in vivo PET images with histologic samples has been shown to require a technically complex methodology (6,7) that still is not always accurate enough to correctly represent PET tracer distribution in tissue (8,9).
An alternative way to evaluate the concordance between the PET tracer intratumoral distribution and distribution of its intended target is to use thin tissue sections obtained from a surgically excised whole tumor specimen from a patient or an animal injected with the tracer before the surgery. Using these tissue sections, it is possible to visualize PET tracer distribution (using autoradiography) and the spatial distribution of relevant biologic markers (using immuno-fluorescent microscopy). By coregistering these data and performing statistical analysis, it is possible to evaluate how well the PET tracer distribution depicts the spatial pattern of the intended biologic target of the tracer.
Most often, it is impossible to obtain all the desired data from a single tissue section. Consequently, several studies investigating colocalization of a PET tracer with its biologic target use a set of sequential tissue sections to perform autoradiography and immunohistochemical staining and imaging to reveal multiple aspects of the tumor biology (10–12). However, such data acquisition methods pose an additional challenge of coregistration of all the images acquired from different, albeit sequential, tissue sections. Even though the tissue sections used are thin enough (several microns) to ensure minimum variation of the microenvironmental parameters of interest between adjacent sections, tissue cutting, mounting, and processing can introduce deformations that prevent precise coregistration of the images acquired from the adjacent tissue sections. When autoradiography images are part of the image dataset, objective coregistration of the images becomes even more difficult, as the information content of the autoradiography is drastically different from that of the microscopy image. For this reason, manual coregistration of autoradiography with microscopy images tends to be highly subjective, if based on the tissue outline.
The purpose of the study presented here was to develop and validate a methodology for objective coregistration of histopathologic and autoradiography images acquired from a set of sequential thin sections of tumor tissue. 3′-deoxy-3′-18F-fluorothymidine (18F-FLT) and 14C-FDG were the 2 investigated radiotracers.
MATERIALS AND METHODS
Tumor Models and Radiotracers
Human tumor xenografts were developed in male athymic mice (NCr-nu/nu; National Cancer Institute), from bilateral flank subcutaneous inoculation of 5 × 10⁵ cells per site. Human head and neck squamous cancer cells were used for inoculation (FaDu, SQ-20B). Animals were maintained according to the protocol approved by the local Institutional Animal Care and Use Committee at Virginia Commonwealth University.
18F-FLT was produced by the Center of Molecular Imaging, Virginia Commonwealth University. The synthesis followed an established protocol, using 5′-benzoyl-2,3′-anhydrothymidine as a precursor (13,14). To allow for separation of signals from 18F-FLT and 18F-FDG, 14C-labeled FDG was used (American Radiolabeled Chemicals, Inc.).
Tumor Tissue Collection
When the tumors reached 10–15 mm in diameter, the animals were anesthetized by inhalation of a mixture of oxygen and isoflurane. At 80 min before planned animal euthanasia, a bolus injection containing pimonidazole hydrochloride (Hypoxyprobe; HPI, Inc.), 2.5 mg/20-g mouse; Hoechst 33342 (Sigma-Aldrich), 0.4 mg/20-g mouse; 37 MBq of 18F-FLT, and 185 kBq of 14C-FDG was administered by tail-vein injection, followed by 2 consecutive intraperitoneal injections of bromodeoxyuridine (Sigma-Aldrich), 15 mg/20-g mouse, at 50 and 30 min before the animal sacrifice. After animal sacrifice, tumors were immediately excised, embedded in Tissue-Tek OCT (Sakura Finetek), and frozen on dry ice. The tumor specimens were sectioned with a CM1850 UV cryostat (Leica Microsystems) at 8 μm thickness. From each tumor, 3 stacks of at least 15 consecutive sections were obtained from the top, the middle, and the bottom of the tumor specimen (≥45 sections per tumor).
Autoradiography
In this study, dual-tracer autoradiography was used to reveal the intratumoral distribution of 18F-FLT and 14C-FDG (12). One section (the reference section) was selected from each stack of consecutive sections and used for phosphor plate autoradiography. Registration marker dots were manually placed on the glass slide around the reference section, using a mixture of 1 μL of 14C ink (Moravek Biochemicals and Radiochemicals), 50 μg of Hoechst, and all-purpose glue. The slides selected for autoradiography were covered with a layer of plastic wrap to avoid contamination of the imaging plates with long-lived radionuclide and were exposed to a phosphor plate for 4 h. All exposures were conducted at room temperature. The imaging plate was read with a BAS-5000 Bio-Imaging Analyzer (Fujifilm) to obtain the image of 18F-FLT distribution. After the first exposure, 18F activity was allowed to decay for 1 d. Thereafter, a 4 day exposure was initiated to obtain the image of distribution for the 14C-FDG tracer. In the last step, another 4 h exposure was performed to confirm the insignificant contribution of 14C-FDG activity to the 18F-FLT image. The resulting images were exported in tagged image file format, at a 25 μm/pixel resolution and 16-bit depth. The autoradiography images of individual tumor sections (Supplemental Figs. 1A and 1B) were cropped from a large image of the whole phosphor plate containing multiple sections. The typical size of an individual tissue section image was on average 500 by 600 pixels, at 25 μm/pixel. Before registration, these individual tumor section autoradiography images were up-sampled to 2.5 μm/pixel using nearest-neighbor interpolation, preserving the original intensity values.
Tumor Microenvironment Imaging
To visualize different aspects of the tumor biology, such as cell proliferation, hypoxia, and blood flow patterns, a combination of previously described immunohistochemical techniques was used (10,15,16). The immunofluorescent histochemical processing of the tissue sections was performed using the Discovery XT system (Ventana Medical Systems, Inc.). Hematoxylin and eosin staining was performed manually.
Hoechst 33342, a fluorescent dye that was injected as a part of intravenous bolus shortly before animal sacrifice, was used as a surrogate marker for imaging tumor blood flow and diffusion. Hoechst images were acquired from all tissue sections before any histochemical or immunohistochemical processing. In the study presented here, bromodeoxyuridine binding and Ki-67 expression were used for imaging cell proliferation. Pimonidazole was used to image hypoxia. Tumor vasculature was imaged using CD31 antibody, whereas cell nuclear content was imaged with 4,6-diamino-2-phenylindole stain.
Because of the long exposure times necessary for autoradiography and because of the contact with the plastic film that can damage the tissue on removal, the tissue sections used for autoradiography were deemed unsuitable for any further immunohistochemical processing. Therefore, the strategy depicted in Figure 1 was adopted: obtain autoradiography from the reference section and microenvironment information from adjacent sections. All microscopy images were acquired at ×20 magnification using a motorized research Olympus BX61 microscope, connected to an X-Cite 120PC fluorescence illumination system for immunofluorescence imaging, and an Applied Imaging SL50 automatic microscope slide loader. The automated tiled image acquisition and reconstruction process was controlled through the Ariol software (Genetix). All images were acquired at 8-bit depth and had a 2.5-μm pixel size. The typical physical size of the image was on average 5,000 by 6,000 pixels, varying with the extent of the tumor tissue.

Image acquisition and registration scheme. Green double arrows represent rigid point-set registration used for autoradiography and Hoechst images from reference section. Blue dashed arrows represent manual rigid registration of microscopy images from nonreference sections. Red solid arrows correspond to Hoechst-based deformable registration.
Image Registration
A 2-step registration approach was used as depicted in Figure 1. For each individual tissue section used for data acquisition, all images obtained were initially rigidly coregistered. Thereafter, these independent sets of rigidly registered images representing individual tissue sections were registered together using deformable registration.
Rigid Image Registration: Images Acquired from Same Section
For the microscopy images obtained from the same tumor section, the adjustments needed for registration were minor, as all tissue deformations induced during section cutting and mounting would affect all these images in the same way. Misalignments could be induced only by the automated slide placement on the microscope tray and, potentially, tissue shrinkage during subsequent immunohistochemical processing.
To correct for these misalignments, manual rigid registration of these images was performed in Photoshop CS4 Extended (Adobe), based on aligning tissue boundaries (always visible because of the tissue autofluorescence or nonspecific binding). Automated image content–based registration was avoided because the multiple microscopy images obtained from the same tissue section represented radically different characteristics and features.
Registration of autoradiography images with microscopy images poses a different problem, as the former are characterized by lower resolution and lack microscopic landmarks useful for coregistration and verification. Therefore, for the autoradiography image and the Hoechst image acquired from the reference tissue section, a different registration method was used. Instead of relying on the tissue outlines, a set of regular landmarks was created by placing 8–12 dots of 14C ink mixed with Hoechst dye around the tissue section on the glass slide. These dots (with the typical diameter of ∼0.2–0.5 mm) were visible on both autoradiography and Hoechst images (Supplemental Figs. 1A–1C).
For each marker dot, a weighted center of mass was obtained for the autoradiography and microscopy images. Using at least 6 marker dots (selected interactively), the rigid transformation needed to align their centers of mass in the Hoechst image with those in the autoradiography image was obtained. The rigid transform of the point coordinates was calculated using a MATLAB R2010a (MathWorks) implementation of a coherent point drift algorithm (17). The resulting transformed image intensity values were calculated using linear interpolation.
Deformable Image Registration: Images Acquired from Multiple Sections
As previously reported in histopathologic image registration studies (18,19), tissue cutting and slide preparation induce in each collected tissue section unique characteristic nonlinear deformations (tissue stretching and warping, among others). Thus, deformable image registration is needed to correctly align the images obtained from sequential tissue sections.
As represented schematically in Figure 1, Hoechst microscopy images were obtained from all tumor sections. The typical diffusion distance of Hoechst is approximately 100–250 μm (15), significantly larger than the tissue section thickness (8 μm). Therefore, it was assumed that most of the Hoechst image features observed in a set of consecutive tumor tissue sections are spatially constant, as illustrated in Figure 2. Correspondingly, this spatial correspondence can be used to establish the deformations needed to register Hoechst images acquired from nonreference sections to the Hoechst image of the reference section.
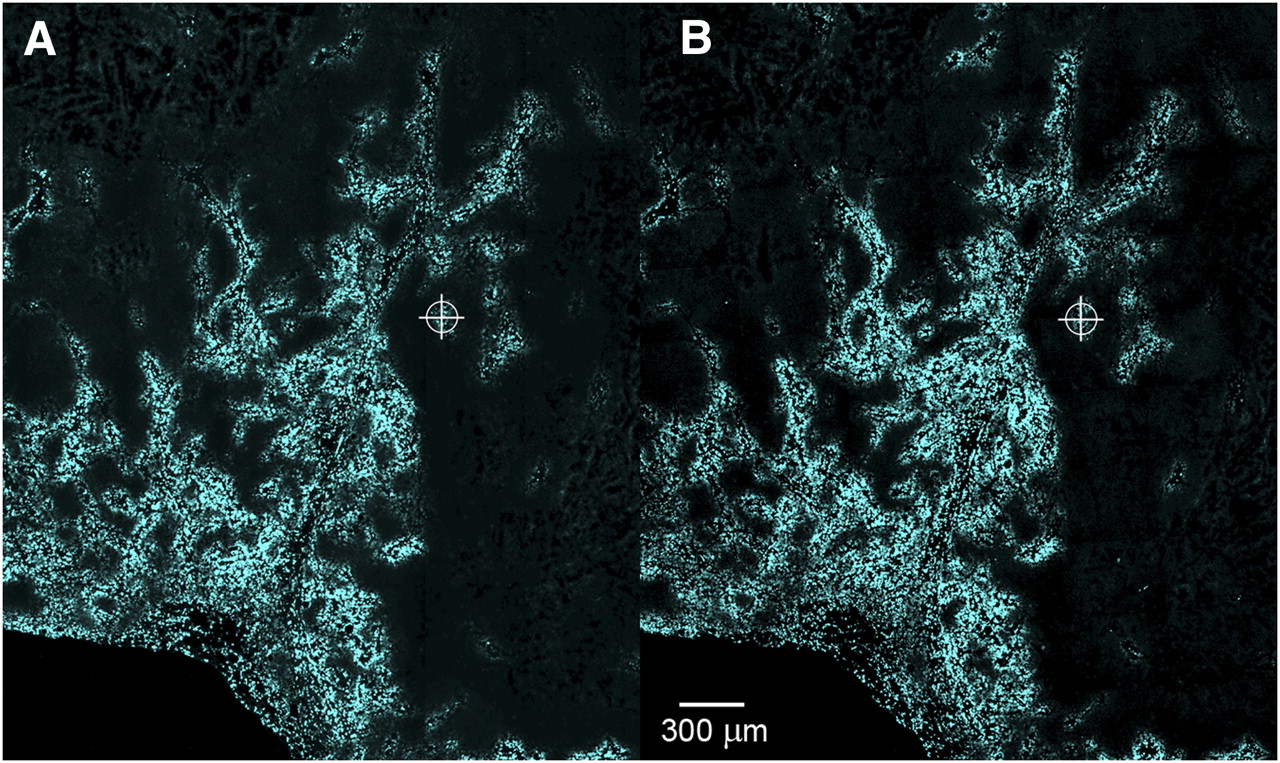
Fragments of Hoechst images acquired from 2 consecutive sections showing corresponding landmark indicated with white cross.
To perform deformable registration of Hoechst images acquired from sequential tissue sections, the open-source Java (Oracle)-based Fiji plug-in bundle (implemented in the National Institutes of Health ImageJ platform) was used. The Hoechst images were first rigidly registered using the Register Virtual Stack Slices plug-in. For the reference Hoechst image (acquired from the section used for autoradiography acquisition) and each of the nonreference Hoechst images (representing adjacent tissue sections), a set of corresponding invariant features distributed through the area of the section was identified using the Feature Extraction plug-in and a multiscale oriented patch feature extraction algorithm (20). With these features as soft registration landmarks, a deformable registration plug-in, UnwarpJ, using an elastic B-spline deformable registration was applied (21).
The derived deformable transformation was then applied to the Hoechst image for which it was calculated, and to all other images obtained from that particular tumor section. By repeating this procedure for the rest of the nonreference tissue sections, all the microscopy images obtained from a stack of sequential tissue sections were registered to the Hoechst image of the reference section. As the latter was also registered to the 18F-FLT and 14C-FDG autoradiography images, all microscopy and autoradiography images were registered together by the combination of rigid and deformable registration techniques as shown in the flow chart presented in Figure 1, and had a resulting pixel size of 2.5 μm.
Image Registration Error Analysis
Rigid Registration: Images Acquired from Same Section
The minor misalignments between the microscopy images coming from the same image were resolved by manual registration as described above. Preliminary testing using difference images have indicated that visual inspection of the overlap was a sensitive method to detect misregistrations. Misalignments as small as 1 pixel in size could be detected without difficulty. Therefore, the registration error of this alignment process was considered to be under the observable limit of 1 pixel (2.5 μm) and thus negligible.
The accuracy of the microscopy–to–autoradiography image rigid registration was evaluated using the marker dots created around each tumor section. Specifically, for each image pair, the total number of marker dots visible around the tissue was randomly split into a registration landmark set and a measurement landmark set. The rigid transformation was based on the optimal alignment of the registration set, which always contained only 4 points; the rest of the landmarks served as a measurement point set (22). To evaluate the rigid registration error, the displacements between the weighted centers of mass of corresponding points in the measurement point set were recorded after registration, for all the used sets of images (8 tumor models). Multiple repetitions of the registration procedure (n = 30) were performed for each tumor model, each time using different subsets of landmarks for registration and for measurement. Mean registration error and the SD were calculated and reported for all the measurements (n = 960).
Deformable Registration: Images Acquired from Multiple Sections
To evaluate the registration accuracy of the deformable registration for the images acquired from adjacent tissue sections, sets of corresponding landmarks were established for the Hoechst image pairs to be registered (measurement landmark sets) (23). To ensure objective evaluation, these landmarks had to be different from those used for the registration. Therefore, a different feature extraction algorithm, scale invariant feature transform, was used to establish corresponding points in the 2 images (24). To obtain a set of measurement landmarks to be used for registration accuracy evaluation, these initial sets of points were manually processed to ensure proper correspondence between the landmarks and their uniform distribution across the section area. For each of the 8 tumor models, there were 3–5 different pairs of Hoechst images. For each Hoechst nonreference and Hoechst reference image pair, a minimum of 30 corresponding landmarks was defined.
To obtain the registration error distribution after deformable registration of the Hoechst image pairs, the distances between corresponding measurement landmarks in the target image and the registered image were recorded. The average distance between the landmarks after deformable registration was reported as the deformable registration error.
To calculate a combined registration error, it was assumed that the observed displacement values between corresponding points after image registration were random and normally distributed over all measurements. The total registration error was represented by its 2 components: rigid registration error (autoradiography to microscopy from the same tissue section) and deformable registration error (for microscopy images acquired from sequential tissue sections). The total registration error was defined as the convolution of the 2 error components approximated by gaussian distributions.
RESULTS
The initial step in the presented coregistration procedure was the rigid registration of autoradiography and microscopy images obtained from the reference section. Figure 3 shows image overlays representative of the point-set rigid registration results. Following the same procedure, the 14C-FDG autoradiography and Hoechst images were registered to the 18F-FLT autoradiography.

Transparent overlay in false colors of 14C-FDG autoradiography (red), 18F-FLT autoradiography (green), and Hoechst (light blue). (A and C) Images manually registered on basis of observed tissue outline. (B and D) Same images after rigid point-set registration.
The distribution of rigid registration error measurements is shown in Figure 4A. The average registration error for the rigid registration of Hoechst microscopy images to 18F-FLT autoradiography images was Erigid,Hoechst = 30.8 ± 20.1 μm image registration. The mode of the distribution was 16.1 μm, and the maximum displacement was 129.1 μm. The distribution of displacement values for 14C-FDG to 18F-FLT autoradiography images indicated an average registration error of Erigid,autorad = 26.4 ± 17.9 μm. The mode of the distribution was 9.01 μm, with a maximum displacement of 107.4 μm.
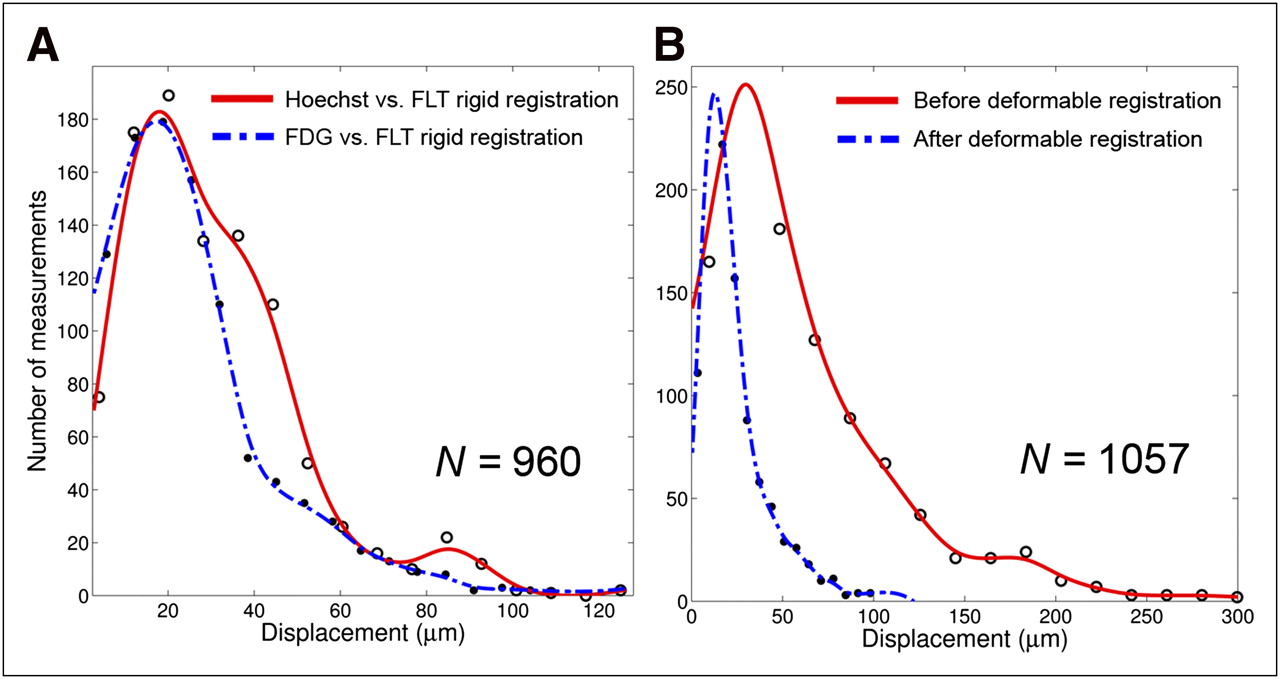
(A) Distribution of displacement values between corresponding landmarks after rigid point-set image registration (Hoechst image registered to 18F-FLT autoradiogram and 14C-FDG autoradiogram registered to 18F-FLT autoradiogram). (B) Distribution of displacement values between corresponding landmarks: before deformable image registration (red dotted line) and after deformable image registration (blue continuous line).
The distribution of deformable registration error measurements is shown in Figure 4B. These registration errors were calculated for 3–5 different pairs of Hoechst images for each of the 8 tumor models. The success rate of the deformable registration algorithm was uniform across the used tumor models (average error ranged from 19.73 to 25.66 μm). For each Hoechst nonreference and Hoechst reference image pair, we had a minimum 30 defined corresponding landmarks, for a total of 1,057 measurements. Figure 5 presents transparent overlays of images before and after the deformable registration procedure. Specifically, the top row demonstrates the effect of applying the calculated transformation for Hoechst images, whereas the bottom row reveals the overlay of 2 complementary aspects of the tumor biology (hypoxia and blood flow), before and after the deformable registration procedure.
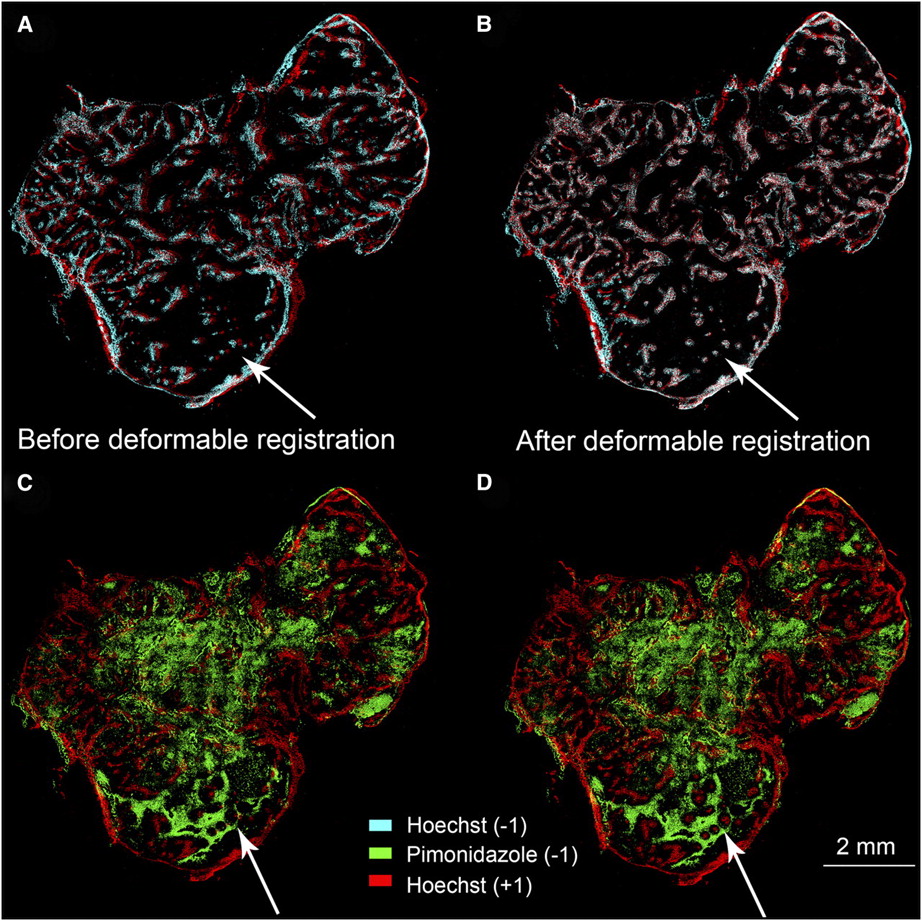
Transparent overlays of: (A and B) Hoechst images corresponding to section −1 (light blue) and section +1 (red); (C and D) pimonidazole from section −1 (green) and Hoechst from section +1 (red). Left panels present images before Hoechst-based registration, and right panels present same images after registration. Arrow indicates area highlighting how initial misalignment was corrected by deformable registration.
The calculated error of the deformable registration was Edeformable = 23.1 ± 17.9 μm, which is similar to that reported in 3-dimensional tissue reconstruction studies using the same deformable registration algorithm (23). The distributions of the registration errors before deformable registration (red dashed line; maximum error, 308.3 μm) and after (blue line; maximum error, 108.4 μm) are shown in Figure 4B.
The total registration error was calculated as the convolution of the 2 error components:
DISCUSSION
The aim of this study was to develop and evaluate a semiautomated approach to multimodality registration of autoradiography and microscopy images acquired from sequential tissue sections. Although this procedure was developed specifically for histopathologic validation of PET tracers, it can be used as a tool for any colocalization studies involving various imaging probes, especially when the images of the probe distributions cannot be obtained from a single tissue section.
Earlier studies registering autoradiography and microscopy images used manual coregistration of autoradiography and microscopy images, to the observer's best ability. Rigid transforms (translation, rotation, scaling) were applied to images in transparent overlay, followed by convolution with a 200-μm gaussian kernel and rebinning, where the images were resampled to a 200 × 200 μm grid to minimize the effect of any residual misalignment errors on pixel-by-pixel correlative studies (10,12). Others have implemented automated rigid registration algorithms, followed by image rebinning to a 200 × 200 μm pixel size to account for the estimated accuracy of image coregistration (11). Although these approaches are considered acceptable, manual registration of images from different modalities, even when acquired from a single tissue section, may be prone to observer bias and lack reproducibility (25). The lower resolution of autoradiography images combined with the background noise can obscure the edges of the tissue sections enough to hinder manual registration relying on alignment of tumor section outlines (Figs. 3A and 3C). Furthermore, rebinning the data to the coarser pixel size with or without blurring can result in a significant loss of information because tumor microenvironment can change significantly, on a scale of 200 μm (26–28). Image intensity–based registration was also successfully used by applying cross-correlation, mutual information, and minimization of image dissimilarity (25,29). Nevertheless, intermodality image registration cannot rely on image content, as to avoid alignment of regions that have similar content but are not biologically colocalized. Landmark-based registration remains the most objective registration method for multimodality imaging (7).
To allow for objective 3-dimensional registration of in vivo images obtained with MRI and PET, and ex vivo histology and autoradiography images, Humm et al. introduced the stereotactic system using Teflon (DuPont) fiduciary markers driven into the tumor (7). Similar to the approach of Humm et al., the present study adopted the principle of creating landmarks visible on all registered images, that is, autoradiography and microscopy images. However, invasive fiduciary systems were not used in this study, to avoid tumor microenvironment disruption and interference with uptake of the PET tracer (30).
The most direct way to compare the intratumoral distribution of a PET tracer with designated biologic aspects on tumor section images would be to obtain all pertinent information from a single representative tissue section. Because this is practically unfeasible most of the time, the images of PET tracer distribution were obtained from 1 tissue section, and the adjacent sections were used to acquire microscopy images to complete the microenvironmental map of the tumor. The novelty of the proposed approach is the use of Hoechst image–based registration, in which the features of 2 Hoechst images acquired from adjacent tissue sections were used to establish spatial correspondence between these 2 tissue sections and then obtain the deformation needed to coregister all images acquired from these sections. As a result, even though the images were acquired from adjacent sections, the misregistrations caused by inevitable deformations that occur during tissue processing were minimized. An additional novel aspect of the coregistration methodology presented here is the elimination of manual registration of images obtained from different tissue sections, or from different modalities. In this study, we have demonstrated the feasibility of the proposed registration procedure and evaluated its accuracy.
The combined registration error of microscopy images to 18F-FLT autoradiography images was 44.86 μm. This registration error is smaller than values previously reported (between 100 and 200 μm) in studies using the same general imaging modalities (10–12,26). Furthermore, because the registration error is smaller than the inherent resolution of 18F autoradiography, further studies analyzing the colocalization between 18F-labeled tracers and targeted biologic pathways will be minimally influenced by image registration.
Some aspects of our methodology need discussion. The typical size of the marker dots placed around tissue sections using a mixture of fluorescent marker (Hoechst 33342) and the 14C ink was about 0.2–0.5 mm. This is similar to or larger than the typical size of the structures (microenvironment features) seen in the images. However, it is not the marker dots but rather their weighted centers of mass that were used for registration of autoradiography and microscopy images. Therefore, the actual size of the marker dots was not limiting the accuracy of registration. However, whereas the autoradiography images are characterized by linear response and wide dynamic range (16-bit), fluorescent Hoechst images do not have the same dynamic ranges. Because the point-set registration is based on aligning the weighted centroids of the masked marker dots, the mentioned difference in dynamic range may potentially induce inaccuracies in center-of-mass calculation. However, in the study presented here this issue was mitigated by creating marker dots as close to circular features as possible. We have conducted preliminary tests using a uniform mixture of fluorescent marker and the 14C ink to confirm that the weighted centers of mass calculated for both autoradiography images and microscopy images coincide.
In the deformable registration of distinct Hoechst images, the definition of corresponding landmarks between 2 images can be inaccurate. Because the landmark locations are used only as soft constraints in the registration algorithm, this uncertainty does not affect the final registration accuracy. However, during the deformable registration error evaluation, the uncertainty in landmark localization contributes to the final reported registration error. To minimize this effect, the final measurement point sets defined for each Hoechst image pair was manually processed and any observed inconsistencies were eliminated by manual removal of the corresponding landmarks.
Finally, the study presented here used specimens from a small-animal tumor model. However, the methodology can also be applied at the clinical stages of PET tracer validation to confirm concordance between the pattern of PET tracer uptake and the spatial distribution of its intended target in patient tumor specimens.
CONCLUSION
A comprehensive, semiautomated method for deformable coregistration of autoradiography and microscopy images acquired from sequential tissue sections was developed and evaluated. The registration method addresses significant nonlinear deformations induced by tissue processing and eliminates the need for potentially subjective manual coregistration of multimodality images acquired from adjacent sections. We demonstrated that this method is more accurate than the other currently available methods. The improvement in registration accuracy could further advance correlative studies of the microenvironmental factors governing PET tracer intratumoral distribution. Furthermore, it can aid studies aimed at investigation of spatial colocalization of different aspects of tumor biology that can be revealed by a combination of autoradiography and microscopy imaging.
DISCLOSURE STATEMENT
The costs of publication of this article were defrayed in part by the payment of page charges. Therefore, and solely to indicate this fact, this article is hereby marked “advertisement” in accordance with 18 USC section 1734.
Acknowledgments
This study was supported by funds from the Department of Radiation Oncology, VCU, and Massey Cancer Center support grant 2P30CA016059-28. We acknowledge fruitful discussions and help received from Peck-Sun Lin, Jeffrey Williamson, Ross Mikkelsen, John Wilson, Mitchell Anscher, Robert Cardnell, and Celina Thadigiri. We also acknowledge the authors of the utilized Fiji plug-ins, Stephan Saalfeld, Alberto Cardona, and Ignacio Arganda-Carreras, for their work and support involving Feature Extraction, Register Virtual Stack Slices, and Transform Virtual Stack Slices plug-ins, and Carlos Oscar Sanchez Sorzano and Philippe Thevenaz for UnwarpJ. No other potential conflict of interest relevant to this article was reported.
Footnotes
Published online Aug. 24, 2011.
- © 2011 by Society of Nuclear Medicine
REFERENCES
- Received for publication April 11, 2011.
- Accepted for publication July 5, 2011.


