


Abstract
The hippocampus is one of the best-known neural structures in the brain and has been of interest in observing the substructures and their metabolic functions. However, it has been difficult to distinguish its substructures and functions in vivo because of its small size. Methods: 18F-FDG PET and high-resolution MRI of the hippocampus were performed on 5 healthy subjects using a PET/MRI system. The metabolism of each hippocampal substructure was measured in vivo on the basis of the MR images. Results: The dentate gyrus and cornu ammonis 4 showed the highest glucose uptake in the healthy subjects. Conclusion: Measuring glucose metabolism in the substructures of the hippocampus could provide a new tool for the future investigation of related brain diseases or functional studies, such as Alzheimer disease or memory and learning studies.
The hippocampus, being involved with functions such as memory formation and spatial navigation, is one of the most important brain structures related to human behavior (1–3). Many studies have been conducted to explore the detailed structures and functions of the hippocampus (4–6). However, in vivo structural and functional imaging has been limited by the difficulty of achieving a resolution high enough to show the fine substructures of the hippocampus. Recent advances in ultra-high-field MRI for humans, such as 7.0-T MRI, have now begun to allow in vivo visualization of the anatomic substructures of the human hippocampus (7–9). Concurrently, in vivo human molecular imaging devices such as PET have also been improving, and their resolution has increased markedly. These two advancements, together with our new fusion technique, that is, combining the high-resolution anatomic images of a 7.0-T MRI scanner (Siemens) and the molecular images of a high-resolution research tomograph (HRRT; Siemens) (10), have begun to provide submillimeter-resolution images of the metabolic functions of the hippocampus in vivo, opening a new era in neuroscience research (11). Recently, two types of PET/MRI fusion systems have been developed (11,12). One (12) is an insertion-type device; the PET detectors are inserted into the MRI scanner. The other (11) is a system in which the PET and MRI scanners are near each other but not integrated. Although the former has the advantage of simultaneous data acquisition, it is difficult to integrate the PET scanner into an ultra-high-field MRI scanner, such as the 7.0-T MRI scanner, thereby limiting high-resolution imaging. The hippocampus is a potent candidate for high-resolution fusion imaging, because it has so many substructures with many diverse functions within such a small volume. The result reported here is for glucose metabolism of the hippocampal substructures using the high-resolution PET/MRI system developed recently (11).
MATERIALS AND METHODS
PET/MRI System
The HRRT is a head-optimized high-sensitivity and high-resolution brain-dedicated PET scanner with a transaxial diameter of 46.9 cm and an axial field of view of 25.2 cm. Most of the commercial PET scanners have a transaxial diameter of more than 80 cm with an axial field of view of only 17 cm. The HRRT adopted the smallest detector currently available, that is, 2.3 mm (width) × 2.3 mm (height), to support the highest resolution. The 7.0-T scanner is the highest-field MRI scanner currently in operation for whole-body imaging, with a clear bore of 90 cm. The gradient system operates at 2,000 V/650 A with gradient amplitude of 40 mT/m, a maximum slew rate of 200 mT/m/ms, and a minimum gradient rise time of 200 μs. In-house–manufactured 8-channel transmit and receive radiofrequency coils were used for the experiments. The combination of the high performance of the 7.0-T scanner and the HRRT provided us the highest-resolution images with the highest signal-to-noise ratio.
A shuttle system was used to physically combine the imaging coordinates between the PET and MRI systems. The shuttle bed (or table) is designed to rotate at the middle of the system by 180° clockwise or counterclockwise; because both the PET and the MRI gantries are designed for the brain only, the table cannot go through the scanners. All parts of the shuttle system are made of nonmagnetic components and materials that can withstand the high fringe field of the 7.0-T magnetic field.
Scanning Protocol
Five healthy volunteers were recruited for the study. All received the informed consent form approved by the internal review board of Gachon University of Medicine and Science and consented to participate in the study. A bolus injection of 18F-FDG (185 MBq) was administered immediately before the subject underwent 7.0-T MRI. MRI and 18F-FDG PET were simultaneously performed for 30 min. First, 2- and 3-dimensional T2*-weighted gradient-echo imaging was performed on the 7.0-T scanner. The scanning parameters for 2-dimensional coronal MRI were as follows: repetition time, 750 ms; echo time, 21 ms; flip angle, 30°; 0.18 × 0.18 × 1.5 mm; and 17 slices. The scanning parameters for 3-dimensional axial MRI were as follows: repetition time, 30 ms; echo time, 17 ms; flip angle, 10°; 0.3 × 0.3 × 0.3 mm; and 144 slices. After the MRI, the shuttle system transported the subject to the PET scanner and PET was conducted for about 30 min. In PET, an additional transmission scan using 137Cs was obtained for attenuation correction. PET images were reconstructed using the ordinary Poisson ordered-subsets expectation maximization 3-dimensional algorithm. The reconstructed image has a 256 × 256 × 207 matrix and 1.22 × 1.22 × 1.22 mm isovoxel resolution. After the completion of scanning, both sets of images were automatically fused by the system, which is precalibrated using a calibration phantom. In this study, no additional image processing or coregistration was performed for the image fusion.
Data Analysis
Standardized uptake value ratio was obtained by normalizing the uptake value of PET images by the uptake value of each subject's cerebellum. As shown in Supplemental Figure 1 (supplemental materials are available online only at http://jnm.snmjournals.org), 5 regions of interest, cornu ammonis (CA)1, CA2, CA3, CA4/dentate gyrus (DG), and subiculum, were chosen in the selected 6 slices among the acquired 2-dimensional gradient-echo MR images. The standardized uptake value ratio of each region of interest was then obtained from the corresponding PET image.
RESULTS
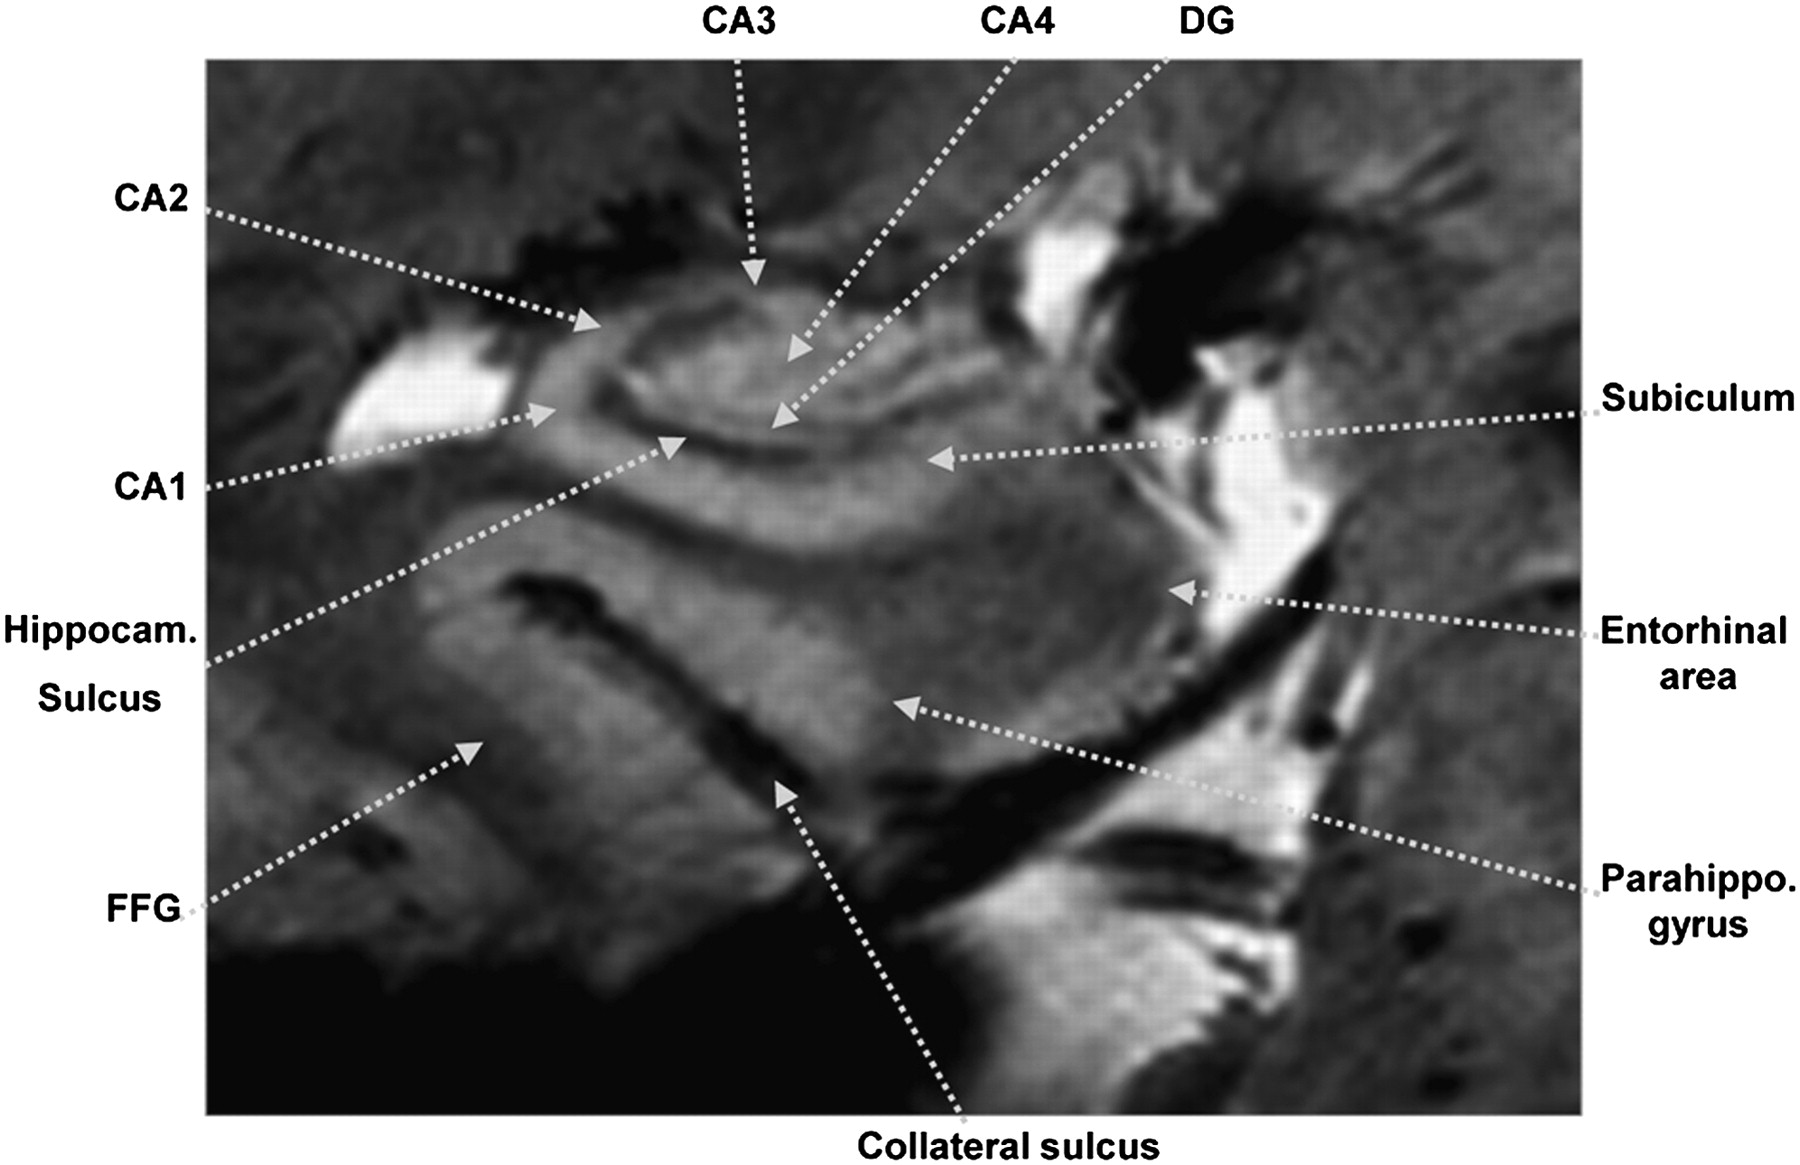
In the present study, we visualized the metabolic functions of the substructures of the hippocampus using the HRRT/7.0-T PET/MRI system developed by Cho et al. (11). In this system, MRI is performed after the administration of 18F-FDG. During the MRI scanning period, 18F-FDG uptake takes place. T2*-weighted 2- and 3-dimensional gradient-echo MRI was performed to obtain ultra-fine structural images of the hippocampus down to a few hundred microns. An example in vivo 7.0-T MR image of the hippocampus is shown in Figure 1. As is well known, the hippocampus is formed by many small substructures, such as the DG and the CA1, CA2, CA3, and CA4 (7).

Coronal 7.0-T MR image of hippocampus. Hippocampal substructures such as CA1, CA2, subiculum, and CA4/DG are clearly visible. Series of hippocampal images obtained by 7.0-T MRI is shown in Supplemental Figure 2. FFG = fusiform gyrus.
After completion of anatomic imaging on the 7.0-T scanner, functional imaging of 18F-FDG on the HRRT followed. The locations of glucose uptake on PET correlated well with the gray matter of the cortex on MRI (Fig. 2 and Supplemental Fig. 1). Glucose uptake in the white matter surrounding the hippocampus was clearly lower than that in most of the gray matter. The pattern of glucose metabolism within the hippocampus was also different along the axis of the hippocampal body, as expected (Fig. 2). As an example, regions of CA4 and DG showed the highest uptake in the anterior and middle parts of the hippocampal body, whereas regions of CA4 and the subiculum had the highest uptake in the posterior part of the hippocampal body.
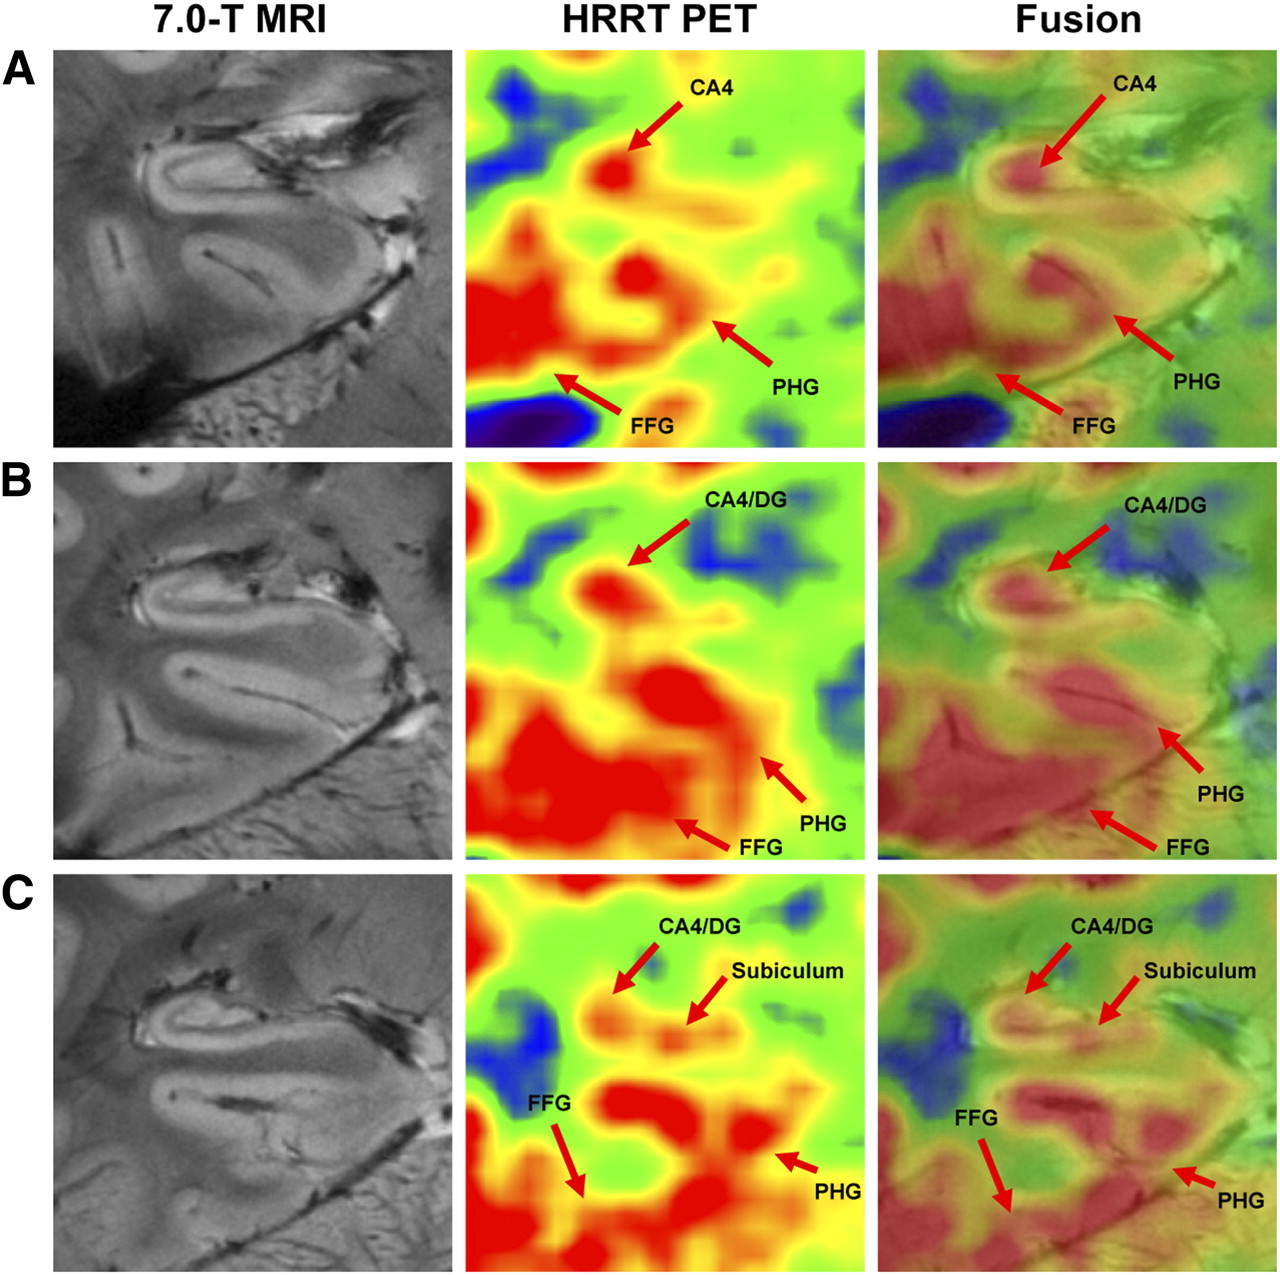
Consecutive coronal PET/MRI images of hippocampus in 1 subject: anterior aspect (A), middle aspect (B), and posterior aspect (C). Glucose metabolism was higher in CA4, DG, and subiculum than in other hippocampal regions. FFG = fusiform gyrus; PHG = parahippocampal gyrus.
Although not shown in Figure 2, most of the substructures of the hippocampus, such as CA1, CA2, CA3, CA4/DG, and subiculum, showed 18F-FDG (or glucose) uptake. To quantitate the glucose metabolism of substructures, we set 5 circular regions of interest along the 6 slices extending from anterior to posterior and then calculated their relative average glucose uptake in reference to the cerebellum (Supplemental Fig. 3). The calculated standardized uptake value ratios within the regions of interest are shown in Figure 3. Distinct glucose uptake among the subregions of the hippocampus was clear. The highest uptake among the selected regions was in the CA4 and DG, as well as in the subiculum. This finding was consistent for all 5 subjects (Supplemental Fig. 4).

Comparison of relative glucose metabolism in hippocampal subregions on different slices. Slice 1 is closest to head of hippocampus; slice 6 is toward hippocampal tail. Thickness of slice is 0.6 mm, and center-to-center distance between each slice is 6 mm. Sub = subiculum; SUVR = standardized uptake value ratio.
DISCUSSION
The present study provided a set of information important for understanding both the clinical and the cognitive aspects of the role of the hippocampus. From a clinical perspective, our approach may be valuable for investigating which areas within the hippocampus are affected as the related disease progresses. It is known that, among the hippocampal substructures, the CA1 region is most susceptible to stress. Recent 18F-FDG studies (13) reported that the hippocampal glucose metabolism of patients with Alzheimer disease showed a significant decrease in metabolic function, compared with the control group. It would be interesting to directly compare the substructural hippocampal glucose metabolism of the patient and control groups, especially at a resolution that can identify the substructures in the hippocampus. From a cognitive perspective, observation of the metabolism of the hippocampal substructures in vivo can be helpful for studying the function of the hippocampus in many related cognitive studies, such as studies of memory and learning. Different memory pathways—depending on the task—may activate different areas within the hippocampus. The DG and CA1 are the entrance of the hippocampus, where afferent signals enter the polysynaptic and direct pathways, respectively. In the polysynaptic pathway, some neurons synapse at CA3 before they enter the CA1 region via Schaffer collaterals, and the subiculum is the major output of the hippocampus for both pathways. Direct measurement of glucose metabolism in the previous in vivo studies, however, was not performed, because of the resolution limits. For instance, glucose metabolic activity in the CA4, DG, and subiculum are higher than in the other subregions, as shown in Figure 3. The present study indicates that the potential of quantitative analysis of subregions of the hippocampus using PET/MRI may play an important role in identifying various changes in glucose metabolism not only in subhippocampal regions but also in many other multifunctional organs, such as the thalamus.
CONCLUSION
To our knowledge, this work is the first of its kind visualizing metabolic function in the substructures of the hippocampus using the new PET/MRI system. In previous studies using conventional 18F-FDG PET, glucose uptake in the hippocampus was not distinguishable among the substructures. In addition, in the conventional software-based coregistration approach, coregistration of MRI and PET images with submillimeter precision was difficult because of the limited resolution of both PET and MRI. Our PET/MRI system, which uses a shuttle system to combine the HRRT and the 7.0-T scanner, does not have this limitation, because it is based purely on mechanical coregistration. As we have shown, PET/MRI has the capability of quantitatively differentiating the metabolic activities of the hippocampal substructures. We believe that this novel fusion of concurrently acquired high-resolution PET and 7-T MR images could open new avenues in neuroscience research and clinical applications.
Acknowledgments
This work was supported by the National Research Foundation (NRF) funded by the Ministry of Education, Science and Technology (2008-04159), South Korea.
- © 2010 by Society of Nuclear Medicine
REFERENCES
- Received for publication February 16, 2010.
- Accepted for publication June 29, 2010.


Jump to section
Related Articles
Cited By...
- Clinical and research applications of simultaneous positron emission tomography and MRI
- Reply: Horizontal Versus Longitudinal Axis of the Hippocampus: Metabolic Differentiation as Measured with High-Resolution PET/MRI
- Horizontal Versus Longitudinal Axis of the Hippocampus: Metabolic Differentiation as Measured with High-Resolution PET/MRI