


Abstract
The quality of 18F-FDG PET/CT images of overweight patients is often degraded. We evaluated the effect of optimizing injected dose or acquisition time on the quality of images of overweight patients using lutetium oxyorthosilicate PET/CT with high-performance detector electronics. Methods: We initially retrospectively measured radioactivity concentrations and signal-to-noise ratios (SNRs) in the liver relative to body weight for 80 patients who had undergone 18F-FDG PET/CT according to our standard protocol (injected dose, 3.7 MBq/kg; acquisition time, 2 min/bed position). The patients were grouped (n = 20 per group) according to baseline body weight as G1 (≤59 kg), G2 (60–69 kg), G3 (70–84 kg), and G4 (≥85 kg). We compared the SNRs of G1 with those of G2, G3, and G4 and calculated the ratio squared as a factor to correct the acquisition parameters for overweight patients. We then prospectively enrolled 120 patients according to the same body weight criteria. We multiplied the correction factors to optimize injected doses or acquisition times and defined dose-adjusted groups (n = 20 per group) and time-adjusted groups (n = 20 per group). G2 dose was defined as 5.59 ± 0.19 MBq/kg, G3 dose as 7.29 ± 0.33 MBq/kg, and G4 dose as 8.88 ± 0.43 MBq/kg. G2 time was defined as 3 min/bed position, G3 time as 4 min/bed position, and G4 time as 5 min/bed position. Results: Although liver activities did not significantly differ among G1 through G4 irrespective of patient weight, SNR progressively decreased as patient weight increased. The liver activities of G2 dose, G3 dose, and G4 dose were, respectively, 1.4-, 1.9-, and 2.5-fold higher than those of the baseline counterparts. Nevertheless, the increased liver activities of G2 dose, G3 dose, and G4 dose did not significantly affect SNR, compared with the baseline groups. In contrast, the SNR of G4 time was significantly higher than that of G4. Conclusion: Our findings suggest that the quality of images acquired from heavier patients can be maintained only by scanning for longer periods. Increasing the dose per kilogram of body weight did not improve the quality of lutetium oxyorthosilicate PET/CT images.
PET has been widely used with 18F-FDG as an important modality for cancer imaging. The image quality of 18F-FDG PET is critical to correctly diagnosing cancer (1). Recent advances in PET/CT technology have led to better image quality than can be obtained with conventional PET, because of less noisy CT-based attenuation correction and the excellent performance of scintillator crystals and detector electronics, such as lutetium oxyorthosilicate detectors and Pico-3D electronics (Biograph Sensation 16; Siemens Medical Solution) (2,3). However, the quality of even PET/CT images of overweight patients often is degraded (4). Several studies have suggested the importance of optimizing acquisition times or the injected doses of radiopharmaceuticals to improve the quality of images of overweight patients (1,5,6). Halpern et al. reported that extended PET is required for overweight patients (1). Several others have also suggested that a higher administered dose per kilogram of body weight (>8 MBq/kg) can maintain the quality of diagnostic images (5,6). However, because these studies were performed retrospectively with a fixed injected dose, which factor (higher injected dose/kg or lighter body weight per se) is more important for determining image quality remains unknown. Furthermore, recommended doses of 18F-FDG per kilogram of body weight are inconsistent among countries. In the United States and Europe, doses are usually between 5 and 8 MBq/kg (1,5–9), whereas the standard injected dose in Japan is 2.0–5.0 MBq/kg (usually 3.7 MBq/kg) according to the guidelines published by The Japanese Society of Nuclear Medicine (10). Thus, whether a higher injected dose is really necessary, and which approach (longer scan time or higher dose) better improves the quality of PET images of overweight patients, have remained unclear.
The present study used a prospective standardized protocol to evaluate the effects of injected dose and acquisition times on the quality of 18F-FDG PET/CT images of overweight patients.
MATERIALS AND METHODS
This study had 2 parts. In the first, we acquired baseline data about image quality in relation to body weight from patients who had undergone clinical PET/CT examinations according to our standard protocol (injected dose, 3.7 MBq/kg; acquisition time, 2 min/bed position). The 80 patients for the baseline study were retrospectively selected from our PET center database and categorized into 4 groups (n = 20 each) according to body weight. We measured radioactivity concentrations and signal-to-noise ratios (SNR) in the liver and calculated the ratios of the SNR in the lightest group with those in each heavier group. We then calculated the ratio squared and applied this value as a factor to correct the acquisition parameters for overweight patients. In the second part of the study, we prospectively examined the effects of injected doses or acquisition times on the quality of images in an additional 120 patients according to the body weight–matched protocol for injected doses or acquisition times.
This study was performed with institutional review board approval and written informed consent from the subjects who participated in the second part of the study. Patients with cancerous lesions in the liver, paravenous injections, and fasting blood sugar concentration greater than 170 mg/dL at the time of the examination were excluded from participating in any part of the study.
We assumed that the SNR of PET images can be determined primarily by count statistics dominated by the Poisson rule (11). In this situation, SNR can be expressed as follows (12): where NECR is the noise-equivalent counting rate and Δt is acquisition time. This relationship suggests that, under the conditions that noise-equivalent counting rate is linearly proportional to an injected dose, baseline to some target SNR can be improved by multiplying the acquisition time or injected dose by the target-to-baseline SNR ratio squared. The SNR in clinical whole-body PET images was defined as the mean of the standardized uptake values divided by the SD in the liver (4). A spheroid region of interest (ROI) was placed over a large area of liver parenchyma in any of the 3 orthogonal planes. A mean value of volumes of the spheroid ROI for this study was 257 ± 57 cm3, indicating that the average diameter of a sphere should be around 8 cm. This size is sufficiently larger than the limits for the value to be considered for partial-volume effects (<2 cm in diameter) for a clinical PET scanner.
Eighty individuals (50 men) who had undergone clinical oncologic 18F-FDG PET/CT between June 2005 and August 2006 were selected in the first part of the study from our database according to the following body weight criteria. The baseline study population was grouped as G1 (n = 20, ≤59 kg), G2 (n = 20, 60–69 kg), G3 (n = 20, 70–84 kg), and G4 (n = 20, ≥85 kg). The ratios of SNR for G1 to G2, G3, and G4 were obtained and squared, equalling 1.55, 1.89, and 2.82, respectively. We then applied values of 1.5, 2.0, and 2.5, respectively, as correction factors for the injected dose or acquisition time for G2, G3, and G4 in the second part of the study.
We estimated that the appropriate number of subjects for each group was 20 by comparing G1 and G2 and obtaining the following findings. The difference in mean SNR between G1 and G2 was 2.7. The within-group SD for SNR was 1.8 for G1 and G2. The ratio of number of subjects from G1 and G2 was 1. We set α at a Bonfferoni-adjusted level (P < 0.0011) for a nonpaired t test applied to multiple comparisons between groups from a total of 10 groups. At a statistical power (1 − β) of 0.90, the required number of patients was estimated to be at least 21.
We prospectively enrolled 120 patients (89 men) from among those referred for 18F-FDG PET cancer studies between September 2006 and August 2008 according to the body weight criteria described for the second part of the study. Groups of 20 patients each were imaged according to the protocol of correction for acquisition time or administered dose. G2 dose was 5.59 ± 0.19 MBq/kg, G3 dose 7.29 ± 0.33 MBq/kg, and G4 dose 8.88 ± 0.43 MBq/kg. G2 time was 3 min/bed position, G3 time 4 min/bed position, and G4 time 5 min/bed position. Table 1 summarizes demographic data for each group.
Demographic Data of Study Population
Images were acquired with a lutetium oxyorthosilicate PET/CT scanner with Pico-3D detector electronics. All patients fasted for at least 5 h before receiving an intravenous injection of 18F-FDG and then rested for approximately 60 min. All patients were positioned on the imaging table with their arms up so as to avoid beam-hardening artifacts in the liver. During the scan, patients were asked to maintain shallow respiration. After an imaging field had been determined with an initial scout scan, a whole-body CT acquisition was performed using the following parameters: 100 mAs, 120 kV(p), 5-mm collimation, a gantry rotation speed of 0.42 s, and a table feed of 18 mm per rotation. We also used an automatic exposure control system for CT with a resultant average radiation dose of 7 mSv per scan. Subsequent 3-dimensional PET data were acquired at 8 bed positions from the top of the skull to the middle of the thigh. The CT-based attenuation-corrected 18F-FDG PET images were reconstructed with an ordered-subset expectation maximization algorithm (3 iterations, 8 subsets) and smoothed with a gaussian filter. Mean absorbed radiation doses, including the CT exposure for the injected-dose–adjusted groups (G2 dose, G3 dose, and G4 dose), were estimated as 14, 17, and 19 mSv, respectively. The estimated radiation dose for the baseline and the acquisition-time–adjusted groups (G1, G2 and G2 time; G3 and G3 time; and G4 and G4 time) was 12 mSv.
Data are expressed as mean ± SD unless otherwise indicated. We acquired imaging data only once for each patient. We then repeated 3 measurements of SNR for each patient by 2 examiners. Two of the 3 measurements were done by 1 examiner to determine intraobserver reproducibility. The other measurement was done by the other examiner to determine interobserver reproducibility. We then averaged the 3 sets of SNR measurements for each patient, and the averaged value was used for further analysis. The intra- and interobserver variabilities of SNR measurements were determined using the coefficient of variation, which was calculated by dividing the SD by the mean of the 2 repeated measurements. The root-mean-square values of these coefficients of variation represented the overall intra- and interobserver variabilities. Intra- and interobserver coefficients of variation for all datasets in this study were 10.0% and 15.8%, respectively. Because variances across groups differed significantly in any datasets of injected doses, liver activities, and SNRs in the liver, nonparametric independent group comparisons (Kruskal–Wallis test) were applied. Multiple comparisons for all pairs of each group were performed by the Dunn test (13). A P value of 0.05 was considered significant.
RESULTS
Figure 1 shows the liver radioactivity per unit volume in the baseline groups, injected-dose–adjusted groups, and acquisition-time–adjusted groups. Regardless of body weight, liver activities did not significantly differ among the groups injected with the same dose of 3.7 MBq/kg, including the baseline and the time-adjusted groups. On the other hand, the liver activities of G2 dose, G3 dose, and G4 dose were 1.4-, 1.9-, and 2.5-fold higher than those of the respective baseline groups.
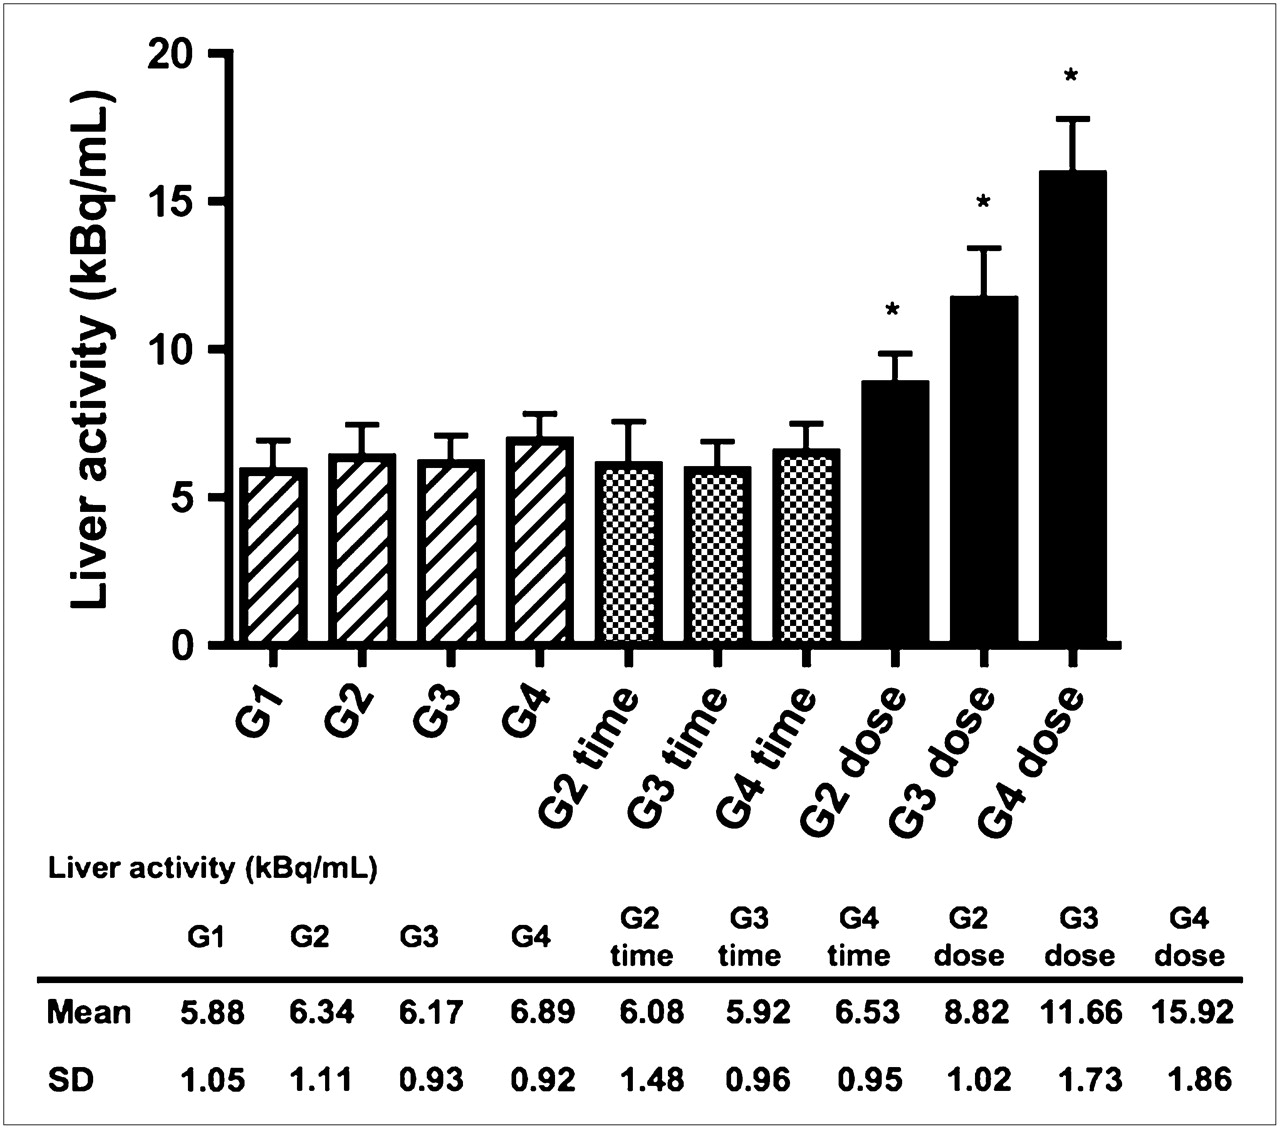
Liver radioactivity concentration of groups categorized according to patient weight alone (G1 through G4), weight and acquisition time (G2 time through G4 time), and weight and administered dose (G2 dose through G4 dose). Results are presented as mean kBq/mL; error bars indicate SD. *P < 0.001, compared with baseline groups (G1 through G4) and time-adjusted groups (G2 time through G4 time).
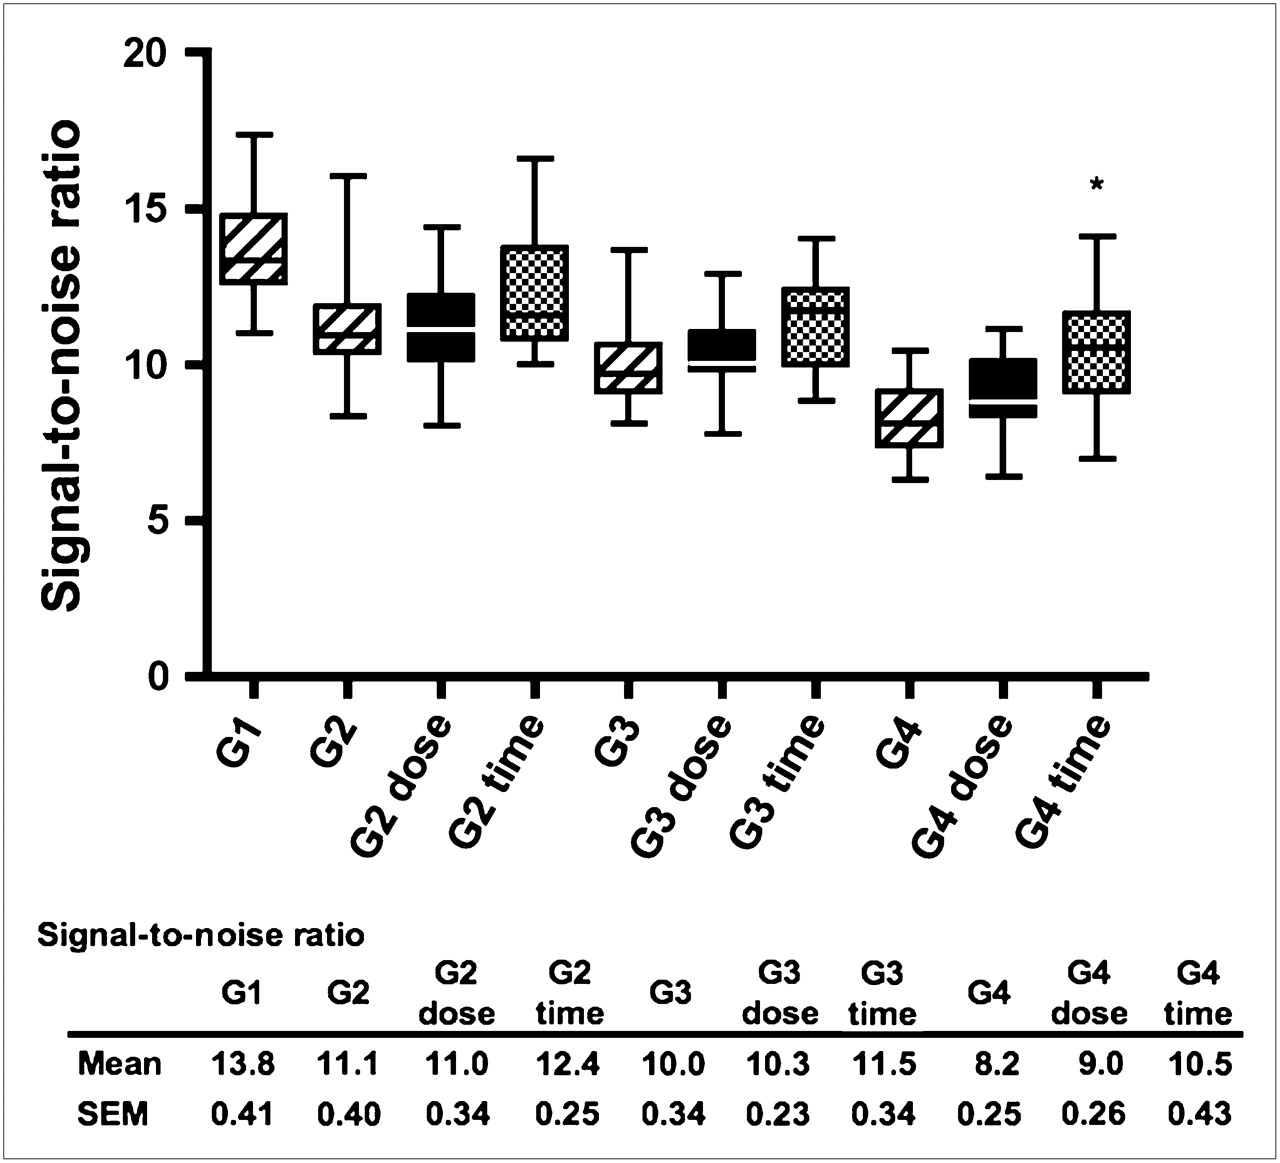
Figure 2 shows SNR in the liver according to the studied groups. The results of multiple comparisons for all pairs of each group are shown in Supplemental Table 1 (supplemental materials are available online only at http://jnm.snmjournals.org). Although hepatic activities did not differ between the groups at baseline, the SNR of the liver progressively decreased with increasing patient weight. The SNRs of the baseline groups significantly differed except for G2 versus G3 and G3 versus G4. Furthermore, the increased liver activity in the injected-dose–adjusted groups did not significantly affect the SNR, compared with the baseline groups. In contrast, the SNR of G4 time was significantly higher than that of G4 after adjustment of the acquisition time. Figure 3 shows PET/CT axial images of the liver representative of G1, G4, G4 dose, and G4 time. Although the trend was the same between other pairs of baseline and time-adjusted groups (G2 vs. G2 time, and G3 vs. G3 time), the differences did not reach statistical significance. We also found a progressive decline in SNRs as body weight increased even after the time adjustment. The SNRs significantly differed between G1 and G4 time.

Box plots of SNR in liver of studied groups categorized according to patient weight alone (G1 through G4), weight and acquisition time (G2 time through G4 time), and weight and administered dose (G2 dose through G4 dose). Statistical significance is shown only between heaviest groups (G4, G4 time, and G4 dose). *P < 0.001, compared with G4.
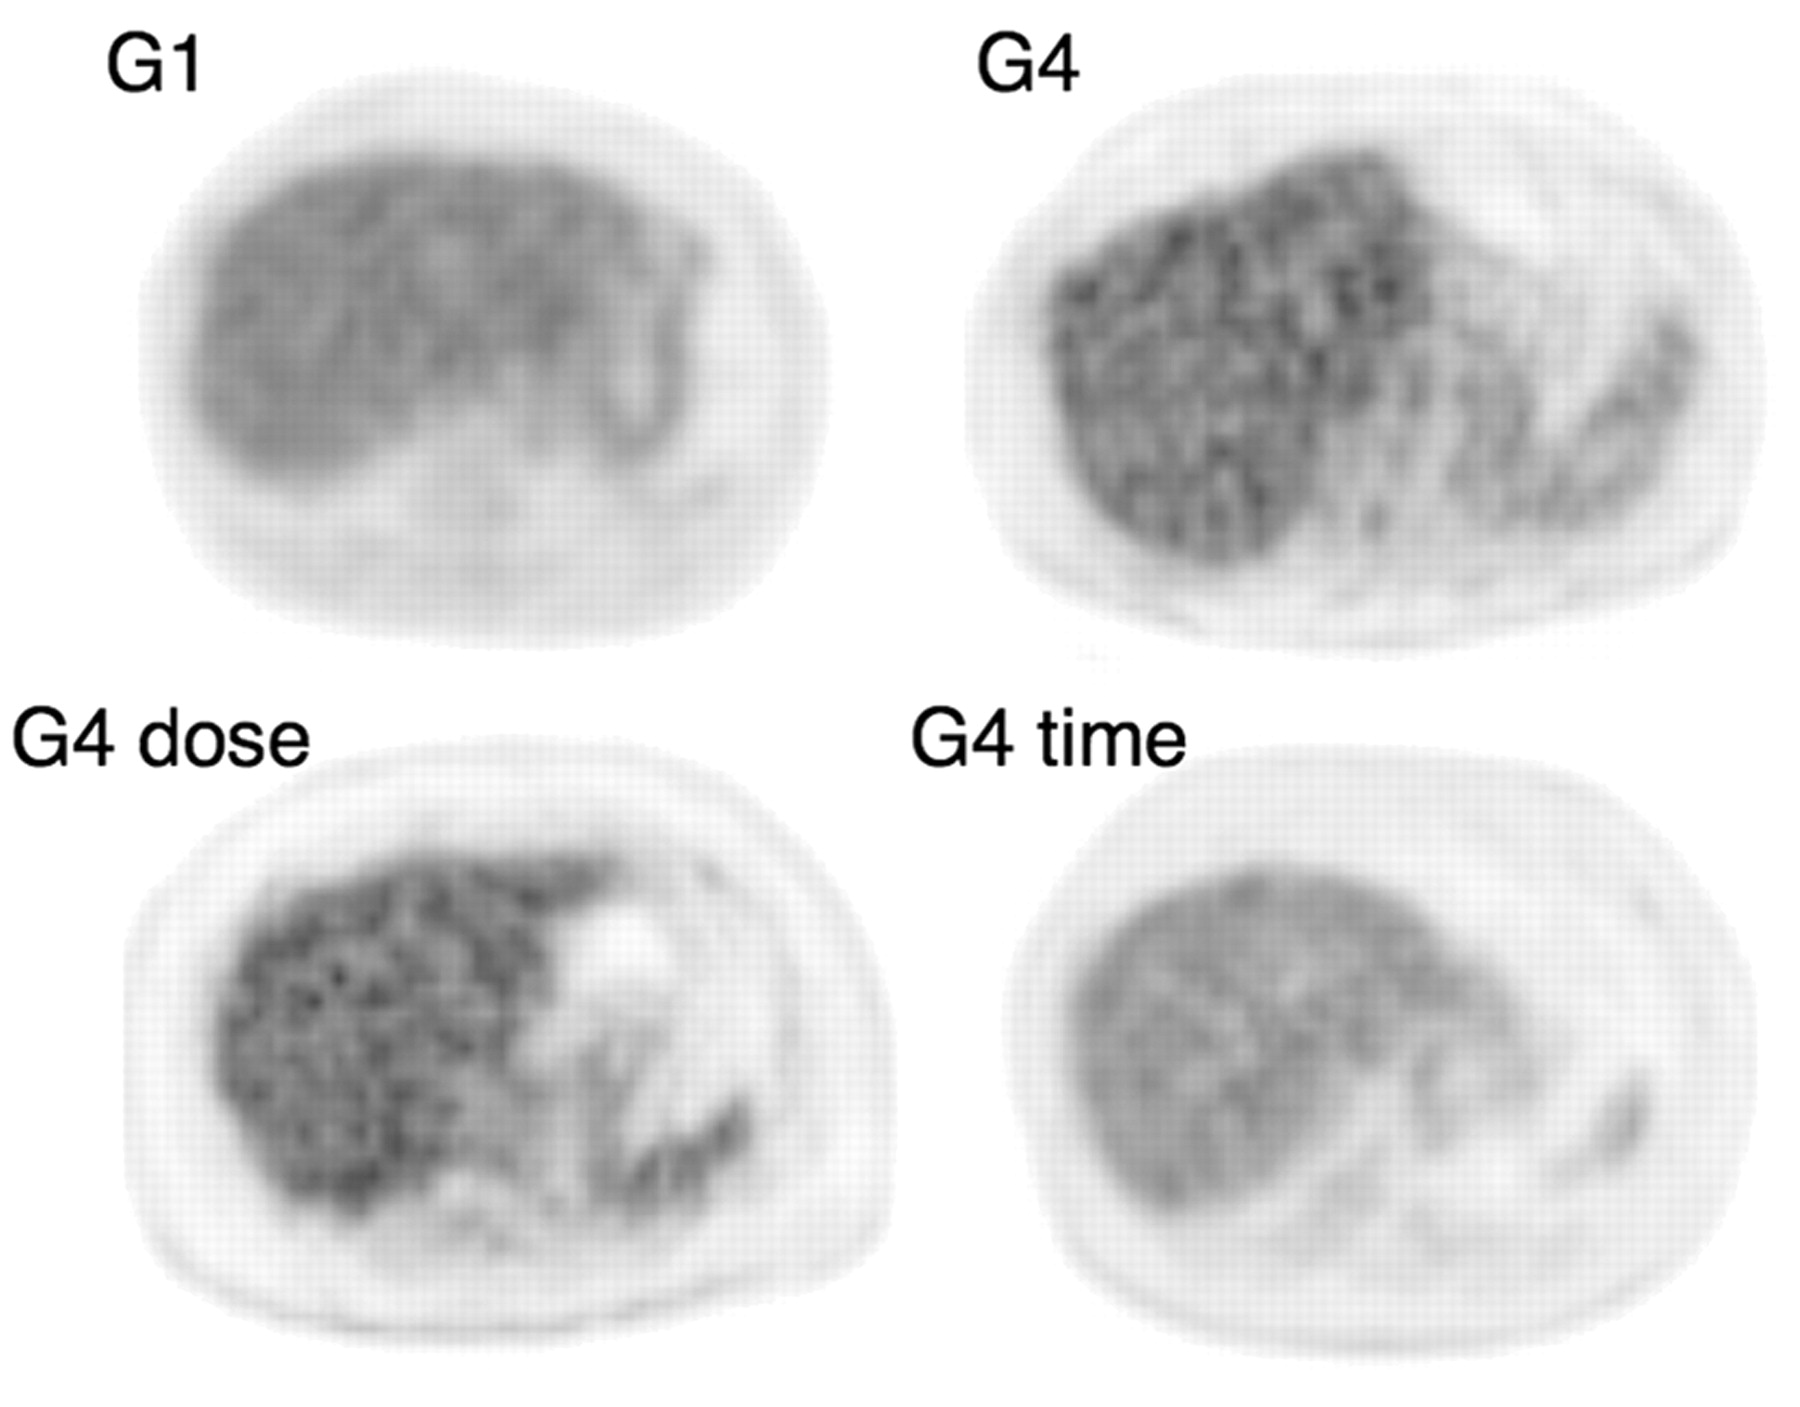
PET/CT axial images of liver. Representative image quality is shown with average SNR for each group. SNRs of G1, G4, G4dose, and G4 time were 14.8, 8.5, 9.0, and 10.6, respectively.
DISCUSSION
The major finding of this study was that an extended acquisition time effectively maintained the quality of 18F-FDG PET/CT images of overweight patients. In contrast, an increased dose of up to 2.5-fold higher than 3.7 MBq per kilogram of body weight did not improve image quality. Our findings suggest that only scanning for prolonged periods can maintain the quality of images of heavier patients.
Liver activities were consistent among patients administered the same dose per kilogram of body weight. Nevertheless, image quality became degraded as body weight increased. Furthermore, additional increases in dose did not affect image quality. These findings suggest that, as body weight increases, the more significant components of total coincidence relate to noise rather than to signal (14). These findings are consistent with those of a computer simulation study of counting rate response using pseudo noise-equivalent counting rate, which suggested that fractions of random and scatter coincidences increase with increasing body weight (12,15).
According to a recent study with computer simulation (12), the optimal dose for attaining 90% of peak SNR in 90-kg subjects was estimated to be 529 MBq. In the current study, the 2.5-fold–corrected dose for 90-kg subjects was 832 MBq. Thus, an administered dose with a 2.5-fold correction is excessive and likely to saturate counting rates and place a limit on improving SNR.
According to a recent study on relationships between CT dose and PET image noise, varying the current from 160 mA (full diagnostic dose) to 10 mA (ultra low dose) does not affect PET image noise if used with the segmentation method presented in that study (16). We used 100 mAs (240 mA as the tube current) and the segmentation method for attenuation correction of PET images. Therefore, although we did not directly measure relationships between CT exposure and PET noise in the current study, it is unlikely that CT exposure variability due to automatic exposure control at a full diagnostic dose affects PET noise.
This study had several limitations. First, the image quality at baseline was not compared with that of the time- or dose-adjusted conditions in the same individuals. The SNRs of all the patient groups tended to improve after the time adjustment but reached statistical significance only in the heaviest group. A study protocol that repeatedly examines the same individuals might more accurately detect slight increases in SNR before and after the time or dose adjustments in patients of standard weight. However, the primary objective of the present study was to compare the effects of time- and dose-adjusted protocols on image quality in overweight patients. Furthermore, to repeat PET examinations several times on patients referred for clinical cancer studies is difficult from the standpoint of radiation burden and ethical issues. Second, as a measure of image quality, we evaluated only SNR in the liver. In addition to SNR, soft-tissue contrast is important in determining image quality (4). However, according to our preliminary study, visual analyses of soft-tissue contrast between the chest wall and the lung according to Halpern et al. (4) yielded poor interobserver reproducibility with a κ-value of only 0.37 (data not shown). Additionally, semiquantitative methodology with which to determine the contrast-to-noise ratio of soft tissues on clinical PET images has never been established. Consequently, we confined our present analysis of image quality to SNR of the liver. Lastly, we used the SD of the pixel values inside the ROI as a marker of image noise. Although the ROI SD is widely used in clinical imaging studies, it has limitations as a marker of noise. Noise describes the extent of the variation (SD) in radioactivity in an image of uniform uptake. Several factors contribute to image noise. Stochastic noise is determined by the number of photons detected. Structured noise is generated from the reconstruction process and is affected by nonuniformity across the image field. The ROI SD is affected by several factors, including image uniformity, ROI location, and ROI size and thus is only a surrogate estimate of the stochastic noise.
CONCLUSION
Our findings suggest that the only way to maintain image quality for larger patients is to scan longer. Doses as much as 2.5-fold higher than 3.7 MBq per kilogram of body weight did not improve image quality even in a lutetium oxyorthosilicate PET/CT scanner with high-performance detector electronics. These results suggest that time adjustment is more appropriate than dose adjustment, and improved techniques to reduce random and scatter noise might also be important for acquiring images of overweight patients.
Footnotes
-
COPYRIGHT © 2009 by the Society of Nuclear Medicine, Inc.
References
- Received for publication December 1, 2008.
- Accepted for publication February 27, 2009.


Jump to section
Related Articles
Cited By...
- 18F-NaF PET/CT of Obese Patients on a Lutetium-Yttrium Oxyorthosilicate PET/CT System: Patient Dosimetry, Optimization of Injected Activity, and Acquisition Time
- Determining the Minimal Required Radioactivity of 18F-FDG for Reliable Semiquantification in PET/CT Imaging: A Phantom Study
- Influence of Statistical Fluctuation on Reproducibility and Accuracy of SUVmax and SUVpeak: A Phantom Study
- Improvement in PET/CT Image Quality with a Combination of Point-Spread Function and Time-of-Flight in Relation to Reconstruction Parameters
- Patient Weight-Based Acquisition Protocols to Optimize18F-FDG PET/CT Image Quality
- Variations in Clinical PET/CT Operations: Results of an International Survey of Active PET/CT Users
- Reply: Imaging Protocols for 18F-FDG PET/CT in Overweight Patients: Limitations
- Imaging Protocols for 18F-FDG PET/CT in Overweight Patients: Limitations