


Abstract
Everolimus downregulates glucose metabolism–associated genes in preclinical models. Inhibition of glucose metabolism measured by 18F-FDG PET was postulated to serve as a pharmacodynamic marker in everolimus-treated non–small cell lung cancer (NSCLC) patients. Methods: In 8 NSCLC patients treated with everolimus, the percentage change in 18F-FDG PET uptake (days 8 and 28 relative to baseline) was determined using a variety of summed standardized uptake value (SUV) measures. Both maximum and mean SUVs were used, with normalizations to body surface area and body weight and with and without correcting for plasma glucose levels. Results: In 5 patients, a reduction of 18F-FDG PET uptake on day 8 was observed with all methods, ranging from −12.8% to −72.2%. Conclusion: These observations demonstrate that inhibition of glucose metabolism is an early effect of everolimus treatment in NSCLC patients and can be assessed using 18F-FDG PET.
Everolimus (RAD001) is a novel oral inhibitor of the mammalian target of rapamycin (mTOR), a downstream component of the PI3K/AKT pathway involved in the regulation of cell proliferation, angiogenesis, and metabolism. Recently, everolimus has been approved by the Food and Drug Administration for advanced renal cell carcinoma after failure of first-line treatment (1). In relapsed non–small cell lung cancer (NSCLC), everolimus also showed clinical activity and was well tolerated (2).
In a murine model of prostate intraepithelial neoplasia, treatment with everolimus resulted in the downregulation of genes involved in glucose metabolism through the downregulation of the transcription factor hypoxia-inducible factor 1 (3). It was postulated that a rapid response in 18F-FDG PET analysis might reflect mTOR inhibition as a pharmacodynamic response.
The purpose of the present pilot study was to demonstrate the downregulation of glucose metabolism in everolimus-treated NSCLC patients as an early pharmacodynamic effect using 18F-FDG PET.
MATERIALS AND METHODS
Patient Selection and Treatment
Eighty-five patients were recruited into a multicenter phase II study investigating everolimus monotherapy in advanced relapsed NSCLC (2,4). A subgroup of 8 patients from 2 study centers (Cologne and Amsterdam) was evaluated by sequential 18F-FDG PET. Standard CT scans were obtained of all patients. The study was approved by the ethics committees of both centers, and informed consent was obtained from all patients. Everolimus was administered orally as a continuous once-daily dose of 10 mg until disease progressed or unacceptable toxicity developed.
Imaging Procedures
18F-FDG PET was performed before the start of therapy (baseline) and on days 8 and 28 of treatment. ECAT EXACT 47 (CTI/Siemens) and ECAT EXACT HR+ (CTI/Siemens) scanners were used in Cologne and Amsterdam, respectively.
Before being scanned, patients fasted for at least 6 h. The acquisition of PET scans was started 60 min after injection of 370 MBq of 18F-FDG. The attenuation-corrected scan trajectory covered 90 cm (6 bed positions, 5-min emission, 3-min transmission). All scans were normalized; corrected for decay, dead time, scatter, and randoms; and reconstructed using ordered-subset expectation maximization. To allow exchangeability of standardized uptake value (SUV) measures, reconstruction settings and image resolution need to be matched (5). Therefore, datasets collected at both sites were reconstructed using the same reconstruction algorithms and settings, that is, ordered-subset expectation maximization using 2 iterations and 16 subsets, zoom 1, an image matrix size of 128 × 128, and gaussian postsmoothing of 5 mm in full width at half maximum (FWHM). Using these settings, we determined final image spatial resolution primarily by voxel size and postreconstruction filtering. For both scanners, the resulting image resolution was approximately 7 mm FWHM near the center of the field of view. CT results were assessed using a 16-slice multidetector CT scanner (Brilliance 16; Philips Medical Systems) at baseline, every 4 wk until week 16, and every 8 wk thereafter. CT scans (collimation, 16 × 1.5 mm) were obtained 60 s after the start of a 100-mL intravenous contrast material injection (Accupaque 350; GE Healthcare Buchler GmbH und Co.). Disease status was assessed by local radiologic evaluation of all lesions. All 18F-FDG PET studies and CT scans were additionally evaluated centrally in a masked fashion by an independent nuclear medicine physician and radiologist, respectively.
18F-FDG PET Evaluation and Response Assessment
Up to 5 evaluable lesions with a baseline tumor-to-background ratio greater than or equal to 2 were selected and analyzed. Local background values were determined as follows. First, an initial estimate of the edge of the metabolic tumor volume was made using a 70% of maximum uptake 3-dimensional isocontour (i.e., a 3-dimensional volume of interest [VOI]). Next, all voxels located between 1.5 and 2.0 cm from this edge were assigned to a local background VOI. The average voxel value of the latter VOI was then defined as local background.
For each lesion, both localization and whether 18F-FDG uptake was homogeneous or heterogeneous were noted. The longest diameter of the lesion (on the PET image) and the orthogonal diameter were measured and reported. For each lesion, the maximum SUV normalized to injected activity and body surface area (SUVBSA[max]) was determined. This is the measured tracer concentration of the hottest voxel within the lesion, normalized to injected dose and body surface area, as recommended by the European Organization for Research and Treatment of Cancer (EORTC) (6). The hottest voxel within each lesion was defined using dedicated standardized in-house (VUmc)–developed software (7). In addition, maximum SUV normalized to body weight (SUVBW[max]) was determined. Furthermore, mean SUV estimates based on a 70% isocontour (SUVmean) were determined, again normalized to both body surface area and body weight, respectively. All SUV parameters were calculated both with and without a correction for plasma glucose level. For each patient, all SUV parameters were summed (sSUV) for all identified lesions, resulting in a total of 8 sSUV estimates per patient (sSUVBSA[max], sSUVBSA-Glu[max], sSUVBW[max], sSUVBW-Glu[max], sSUVBSA[mean], sSUVBSA-Glu[mean], sSUVBW[mean], and sSUVBW-Glu[mean]). For each method, metabolic response was defined as percentage change of sSUV at days 8 and 28 compared with baseline.
CT Scan Response Assessment
In the independent radiologic review, longest diameters in the horizontal plane of up to a maximum of 5 lesions per organ and a maximum of 10 lesions in total (including the lesions noted for 18F-FDG PET) were measured using Response Evaluation Criteria in Solid Tumors (8). The sum of the longest diameters (sCT) of all selected patient lesions and the percentage change in the sCT on day 28, compared with baseline, were calculated.
Time to Progression (TTP)
Time to progression was defined as time from the date of start of treatment to the date of an event defined as the first documented progression of the disease or death due to underlying cancer. If a patient had no event, time to progression was censored at the date of the last adequate tumor assessment.
RESULTS
Patient Characteristics
Eight patients with advanced NSCLC were evaluated by sequential 18F-FDG PET (patient characteristics are shown in Table 1). All patients received 10 mg of everolimus continuously, once daily. Everolimus was well tolerated, and only mild to moderate adverse events were observed (2).
Demographic Data and Pathology
18F-FDG PET
In all 8 patients, 18F-FDG PET studies were performed at baseline and day 8 of treatment, and in 5 patients also on day 28. Assessment on day 28 in the remaining 3 patients was not performed, either because of progressive disease and discontinuation from the study (2 patients) or because of refusal by the patient (1 patient). At baseline, patients had between 2 and 5 lesions that qualified for evaluation (total, 28 lesions). Lesions were localized in lung (15), mediastinum (6), and extrathoracic sites (total, 7; 3 bone and 4 soft tissue). Examples of 18F-FDG scans are shown in Figures 1 and 2.

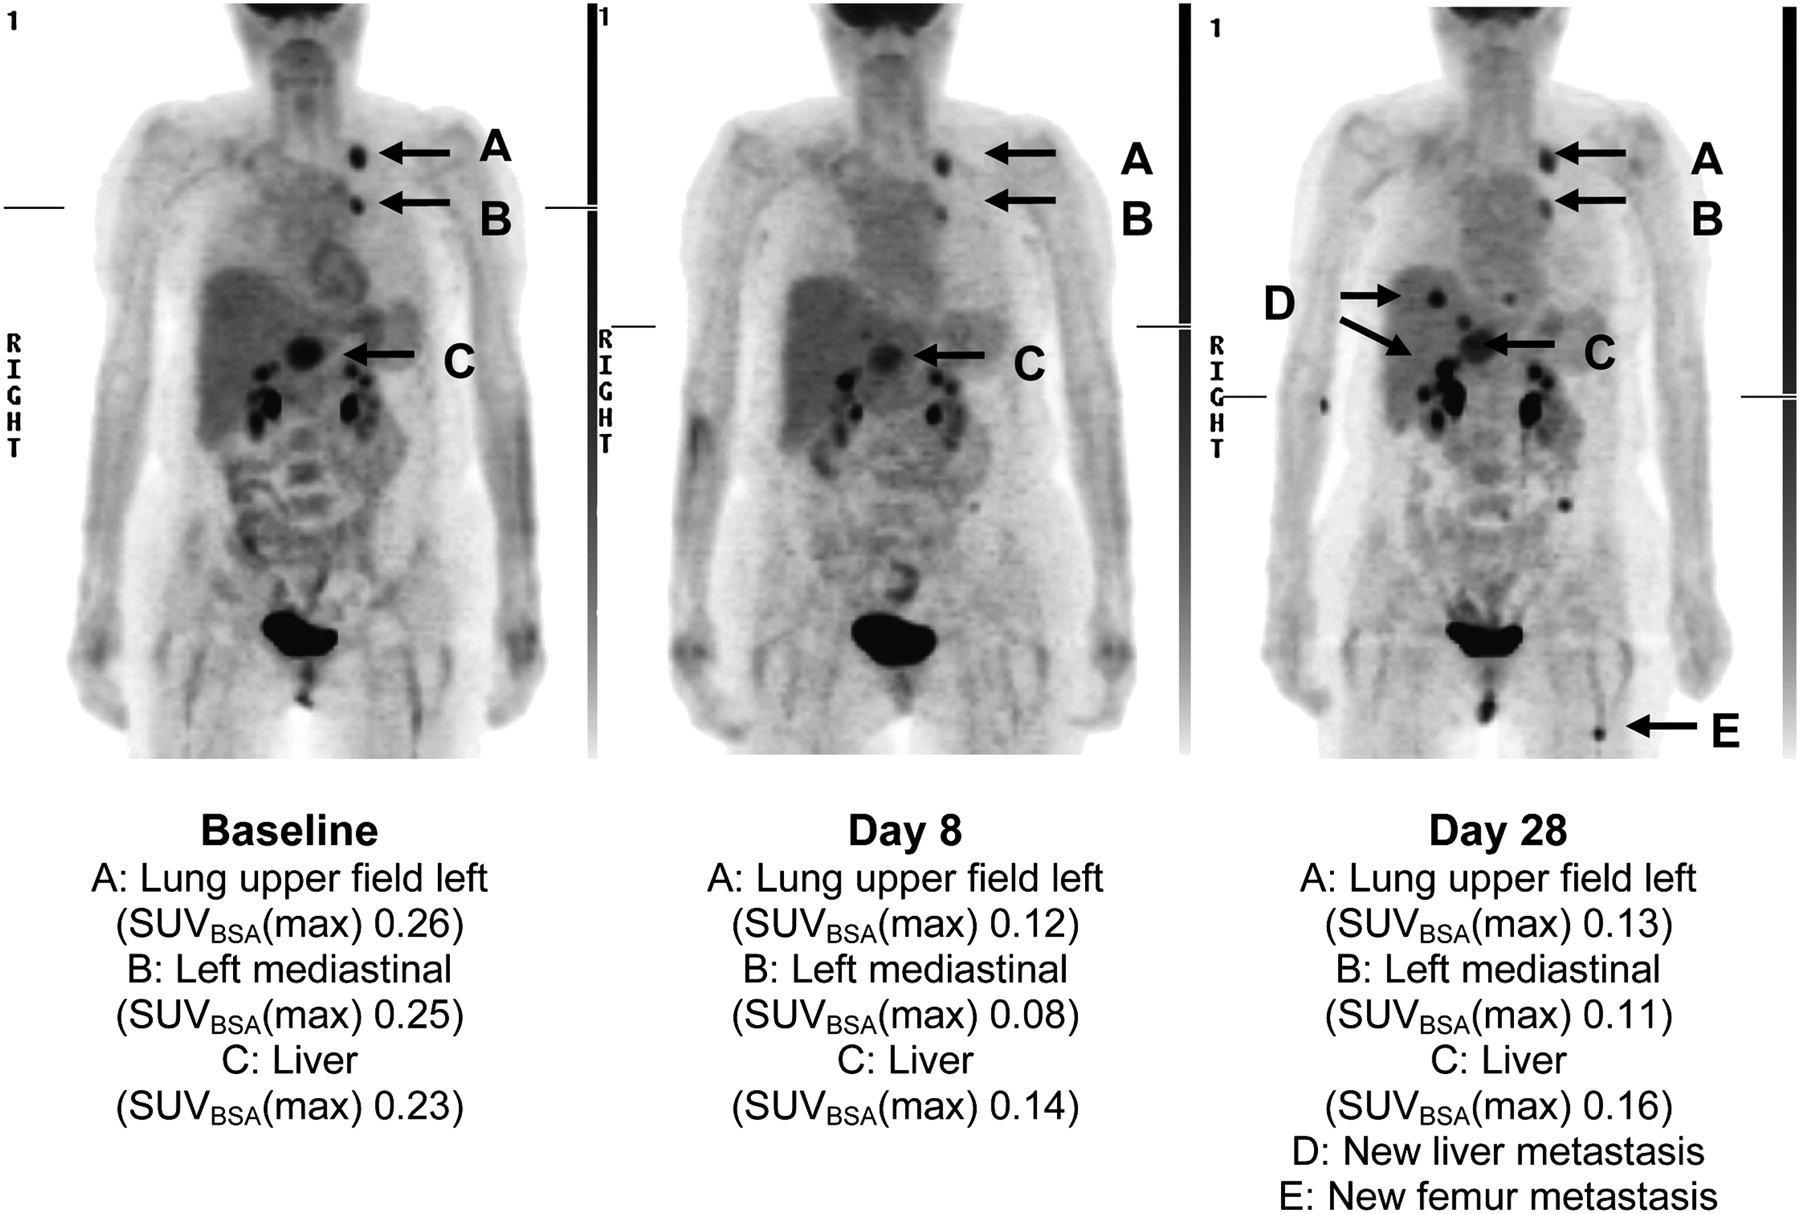
SUVBSA(max) at baseline and on days 8 and 28 for patient 0601-0001.

SUVBSA(max) at baseline and on days 8 and 28 for patient 0701-0004.
In 5 patients, a reduction in 18F-FDG uptake on day 8 was observed using all methods, ranging from −12.8% in sSUVBW-Glu(max) (patient 0601-0009) to −72.2% in sSUVBW(mean) (patient 0701-0004) (Table 2). In 1 patient (0601-0007) increased 18F-FDG uptake was observed with all methods, ranging from +29.3% in sSUVBW(max) to +77.1% in sSUVBSA-Glu(mean).
Results of sSUV(max) and sSUV(mean)
Inconsistent results between data with and without plasma glucose correction were observed in 2 patients. This finding can be explained by altered or elevated plasma glucose levels (patient 0701-0005, 11.9 mmol/L at baseline and 14.2 mmol/L on day 8; patient 0601-0003, 4.7 mmol/L at baseline and 6.5 mmol/L on day 8).
A reduction in 18F-FDG uptake on day 28 was shown in 2 patients (0701-0004 and 0701-0002) using all methods. Two patients (0601-0001 and 0601-0009) showed inconsistent results between methods on day 28, because of elevated glucose plasma levels (7.4 and 13.5 mmol/L, respectively). The fifth patient (0601-0007) showed a further increase of 18F-FDG uptake already observed on day 8.
The sCT changes at day 28 ranged from −26.6 to +77.9%; time to progression ranged from 12 to 191 d (Table 2).
DISCUSSION
This study shows, for the first time to our knowledge, that the inhibition of glucose metabolism is an early event in everolimus treatment of NSCLC and can be measured by 18F-FDG PET already after 1 wk of therapy.
The use of 18F-FDG PET as a pharmacodynamic tool in cancer patients treated with mTOR inhibitors was suggested not only by preclinical experiments (3) but also by recent clinical data. In solid tumors treated with the mTOR inhibitor rapamycin, 18F-FDG PET response after 4 wk of therapy correlated with inhibition of Akt and glycolysis independent from antiproliferative activity (9). For the application of 18F-FDG PET as a pharmacodynamic tool, however, the evaluation of the pharmacodynamic response as early as possible after initiation of therapy, that is, after reaching the serum steady-state level, is preferable.
The present evaluation using sSUV revealed a reduction of glucose uptake in 5 of 8 patients on day 8 of everolimus monotherapy, independent of the method of normalization of SUV, of whether maximum or mean voxel values were used, and of whether a correction for plasma glucose levels was applied. Formally, EORTC criteria for a partial metabolic response in 18F-FDG PET assessment (6) were met in 4 of these patients. The goal of this proof-of-principle study, however, was to explore 18F-FDG PET as a pharmacodynamic tool for everolimus therapy in NSCLC rather than to evaluate early metabolic response as a predictor of outcome. No standardized criteria for assessing pharmacodynamic endpoints in such a setting exist. On the basis of the 28-h half-life of everolimus, the steady state is reached after 4–5 d of treatment (10). Thus, it cannot be excluded that 18F-FDG uptake on day 8 of treatment is already too late to assess the maximal pharmacodynamic effect. Increased 18F-FDG uptake on day 8 in 1 patient, as observed with all methods, may be a reflection of the contributions of both drug effect and tumor growth. Discrepancies in 18F-FDG changes between different methods observed in 2 patients are due to elevated and varying plasma glucose levels between baseline and follow-up scans.
The results presented show that inhibition of glucose metabolism is an early pharmacodynamic effect of everolimus treatment in lung cancer patients and can be assessed by 18F-FDG PET. Future confirmatory studies should be aimed at establishing 18F-FDG PET as a pharmacodynamic tool for optimizing everolimus therapy. In view of the present results, both SUV(max) and SUV(mean) seem to be appropriate for such analyses. A correction for plasma glucose level seems to be necessary in the case of elevated or varying plasma glucose levels. Further studies, however, should include a formal comparison between SUV and glucose metabolism using a dynamic scanning protocol to exclude the possibility that this relationship is perturbed by everolimus. In addition, future studies are needed to assess the optimal time point after the start of everolimus therapy.
The low patient number in this pilot study does not allow drawing any valid statistical conclusion on the predictive value of day-8 PET. However, the most pronounced sSUVBW(mean) on day 8 (patient 0701-0004, −72.22%) was maintained on day 28 (−72.25%) and correlated with the longest time to progression (191 d).
CONCLUSION
Results of this study translate the observations from preclinical experiments on the effect of mTOR inhibition on glucose metabolism in cancer cells into a clinical context and suggest that 18F-FDG PET could be a valuable tool for evaluating early pharmacodynamic effects of mTOR inhibition in NSCLC patients.
Footnotes
-
COPYRIGHT © 2009 by the Society of Nuclear Medicine, Inc.
References
- Received for publication April 28, 2009.
- Accepted for publication July 29, 2009.


Jump to section
Related Articles
Cited By...
- A Translational, Pharmacodynamic, and Pharmacokinetic Phase IB Clinical Study of Everolimus in Resectable Non-Small Cell Lung Cancer
- Biological Correlation of 18F-FDG Uptake on PET in Pulmonary Neuroendocrine Tumors
- Lessons Learned From Lung Cancer Genomics: The Emerging Concept of Individualized Diagnostics and Treatment
- Everolimus Induces Rapid Plasma Glucose Normalization in Insulinoma Patients by Effects on Tumor As Well As Normal Tissues