


Abstract
Near-infrared imaging such as fluorescence reflectance imaging (FRI) and fluorescence-mediated tomography (FMT) yields high signal-to-noise ratios (SNRs) and should thus be well suited for cell-tracking studies. Extravasation of monocytes or macrophages (Mϕs) is one of the earliest events in inflammation. The purpose of this study was to assess whether FRI and FMT allow for the visualization and quantification of early inflammatory processes by tracing the migration of fluorescence-labeled murine Mϕs in a cutaneous granuloma model. Methods: Mϕs were labeled with a membrane-selective carbocyanine dye (1,1-dioctadecyl-3,3,3,3-tetramethylindotricarbocyanine iodide [DiR]). Cellular viability and function (nitric oxide production, phagocytosis, adherence) were assessed in vitro. Local inflammation was induced in mice by the subcutaneous injection of polyacrylamide gel pellets including or excluding a strong inflammatory stimulus (lipopolysaccharide). Labeled Mϕs were injected intravenously, and FRI and FMT were performed up to 7 d. SNRs were calculated for the pellets, and the 3-dimensional distribution of Mϕs was assessed using FMT. Cells were harvested from gel pellets and analyzed by flow cytometry. Results: DiR labeling did not affect cell viability or cell function. FRI revealed the migration of labeled Mϕs into gel pellets and the homing of Mϕs to different body compartments. The lipopolysaccharide-containing pellets exhibited significantly higher SNRs than did pellets without lipopolysaccharide. FMT showed that Mϕs distributed mainly in the periphery of the pellets. The cellular infiltrates extracted from the harvested pellets revealed the presence of approximately 10%−23% DiR-positive Mϕs-expressing typical markers, confirming the transendothelial migration of injected Mϕs. Conclusion: The tagging of Mϕs with DiR allows the noninvasive tracking of inflammatory cells for several days in vivo. FRI and FMT are versatile techniques to monitor and quantify cellular inflammatory responses in vivo.
Optical imaging is an appealing concept for studying cell migration in vivo. Specifically, in the near-infrared range (NIR) background fluorescence is minimal, yielding excellent signal-to-noise ratios (SNRs) and thus high sensitivity of the technique for detecting even small amounts of cells. Further, fluorophores emitting in the NIR can sufficiently penetrate the tissue, even from deeper sections, and allow detection over a longer time (1). Moreover, imaging techniques for optical imaging are rapidly developing, ranging from simple surface-weighted reflection (fluorescence reflectance imaging [FRI]) to fluorescence-mediated tomography (FMT) approaches. The latter technology is capable of delivering quantitative information on 3-dimensional fluorochrome distribution in vivo.
The recruitment of immune cells and especially monocytes from the blood into tissue is crucial for the development and maintenance of inflammation (2). Interference with the mechanisms of monocyte extravasation represents an emerging new therapeutic strategy (3,4). After extravasation, monocytes can differentiate into macrophages and dendritic cells. They are crucial for nearly every step of an immune reaction including the initiation of inflammation, clearance of infectious agents or tumor cells, initiation of an adaptive immune response, and resolution of inflammation (5,6).
Thus, the noninvasive tracing and monitoring of monocytes or macrophages (Mϕs) in vivo by optical imaging could allow for the better localization, visualization, and quantification of these processes for both scientific and clinical applications.
Therefore, in this work we thought to adapt a commercially available cell-tracker dye for in vivo migration studies of murine Mϕs (thus enabling the imaging of early inflammatory processes). For this purpose, a new labeling protocol for rapid and safe Mϕs labeling was developed, and the feasibility of the project was tested in a granuloma inflammation model in mice. Imaging results were correlated to flow cytometry analysis of harvested Mϕs, and dose-response experiments were performed to assess the system sensitivity.
MATERIALS AND METHODS
Preparation of Bone Marrow–Derived Macrophages
Mϕs were cultured in vitro from bone marrow progenitor cells as described previously (7).
Labeling Protocol
The commercially available lipophilic tracer 1,1-dioctadecyl-3,3,3,3-tetramethylindotricarbocyanine iodide (DiR; Molecular Probes Inc.) (8) was used in all experiments. The substance has its excitation or emission spectrum in the NIR (excitation spectrum, 750 nm; emission spectrum, 782 nm) and can be solved in ethanol (0.98 mmol/L). In preliminary experiments, the labeling efficiency of DiR was determined in a phantom, using increasing concentrations of DiR (0.98–197 nmol/L).
For the following experiments, monocytes (1 × 10⁵/mL of medium) were transfected with 2 μL of DiR-labeling solution (19.7 μmol/L final concentration) for 5 min, washed 3 times with phosphate-buffered saline (PBS), and resuspended in medium. The labeling efficiency was controlled by flow cytometry. Because of some variability in the labeling intensity between different preparations of primary murine Mϕs, cells from the same labeling reaction were used for every set of in vivo experiments.
Imaging Experiments
In Vitro Microscopy
For microscopic examination of stained cells, Mϕs were labeled and allowed to adhere on sterile cell plates for at least 12 h. Microscopy was performed after replacing medium by PBS using an inverted fluorescence microscope.
FRI
The whole-body multichannel small-animal imager is a prototype reflectance imager and was already described elsewhere (9). Before in vivo experiments, the detection threshold of the imager was tested in vitro. Different numbers of labeled cells (ranging between 1,000 and 250,000 cells per phantom) were resuspended in 5 mL of agarosis (1.5%) and placed in transparent plastic tubes. Image acquisition times were 1 s for white-light images and 3 s for fluorescent images.
FMT
All tomographic optical imaging studies were performed by a planar small-animal FMT system (FMT 2500; VisEn Medical Inc.) that has been described in detail elsewhere (10,11). Animal scan times were in the range of 2–5 min; tomographic reconstruction times on a standard desktop PC were about 1–3 min.
Vitality and Functionality Assays
To exclude any interference of DiR labeling on functional properties of Mϕs, we measured the labeling stability, apoptosis, cell adhesion, immunophagocytosis of Leishmania major parasites, and production of reactive nitric-oxide (NO) species in response to classic activation with interferon (INF)-γ and lipopolysaccharide.
Testing of Labeling Stability
To test the stability of DiR labeling, Mϕs were stained with DiR and cultured with T cells (1:1 ratio) in plastic culture dishes (1 × 10⁵ cells/mL). After 2 d of coculture, the nonadherent T cells were removed and stained with a fluorescein isothiocyanate (FITC)–coupled anti-CD3 antibody (Immunotools). Mϕs were detached by incubation for 30 min at 37°C in a 1:1 mixture of 0.5 mM ethylenediaminetetraacetic acid and culture medium. Mϕs and T cells were subsequently analyzed by flow cytometry.
Measurement of Cell Death
Apoptosis of DiR-stained and control Mϕs was visualized after a 16-h culture period by staining with annexin V–FITC (early marker for apoptosis) and Nicoletti assay (late marker for apoptosis) as described previously (12,13).
Adhesion Assay
In contrast to other leukocytes, Mϕs strongly adhere to plastic surfaces. To determine adherence, macrophages (2 × 10⁵ cells) were seeded into untreated plastic tissue culture dishes and allowed to adhere for 30 min. Nonadhered cells were washed away, and the remaining cells were fixed with 2% glutaraldehyde for 10 min. After washing, cells were stained with 0.5% crystal violet in 200 mM boric acid (pH 8.0) for 15 min. Cells were washed and lysed with 10% acetic acid. The optical density was determined at 560 nm. To check linearity of the signal-to-cell ratio and calculate cell numbers, a dilution series ranging from 0.25 to 5 × 10⁵ cells was performed using unstained Mϕs as reference. The results were corrected by subtraction of background staining of the underlying matrix (14).
Phagocytosis Assay
L. major (World Health Organization nomenclature MHOM/IL/81/FE/BNI) was cultivated in Schneider Drosophila medium as described previously (15). The phagocytosis assay was performed as described previously (16,17). In short, Mϕs were incubated for 4 h with labeled parasites, and the percentage of cells that had engulfed labeled parasites was determined using flow cytometry.
NO Release
Stimulation of Mϕs with INFγ and lipopolysaccharide results in classic Mϕs activation. Production of highly active NO is one of the hallmarks of Mϕs activation. NO release was measured as nitrite concentration in the medium by a microplate assay using Griess reagent as described (18).
In Vivo Experiments
Cutaneous Granuloma (CG) Model
CG formation was induced by the subcutaneous injection of 1 mL of polyacrylamide gel (PAG) in the flank region as previously described (19). To induce inflammation, lipopolysaccharide was added to PAG pellets (10 μg of lipopolysaccharide/mL). DiR-labeled Mϕs or control Mϕs were injected intravenously 24 h before pellet implantation. The mice were examined daily for 7 d after injection using FRI and FMT. For imaging studies, mice were anesthetized by intraperitoneal administration of ketamine (125-mg dose per kilogram of body weight) and xylazine (12.5-mg dose per kilogram of body weight). All experiments were approved by the institutional animal care committee.
For signal quantification, the contrast-to-noise ratio was determined by region-of-interest analysis (∼900 pixels) in the region of the pellet. Regions of interest of the same size were placed in nontarget tissue (over the neck) and in the background beside the mouse. The SNR was calculated as SNR = SIpellet/SDnoise.
Analysis of Cell Infiltration of Biogel Pellets
To verify extravasation and to quantify the number of DiR-stained Mϕs inside the pellets, mice were sacrificed; the biogel pellets were recovered, and infiltrated cells were separated from the gel through a 70-μm filter in cold PBS. Cells were washed with PBS, counted, stained for surface antigen expression, and analyzed using a FACScan flow cytometer equipped with CellQuest software (Becton Dickinson). The antibodies used were as follows: FITC-conjugated F4/80, phycoerythrin-conjugated CD11b, and CD115 monoclonal antibodies purchased from Becton Dickinson.
Statistical Analysis
Data are presented as mean ± SE of the mean. Differences between 2 experimental groups were statistically evaluated by Student t test, and differences between multiple experimental groups were evaluated by ANOVA test with Bonferroni adjustment for multiple comparisons. A P value of less than 0.05 was considered to indicate significant differences.
RESULTS
The results of the in vitro experiments are listed in Supplemental Figures 1–3 (supplemental materials are available online only at http://jnm.snmjournals.org).
Labeling Protocol
The labeling of Mϕs with DiR in increasing concentrations showed a gradual increase of fluorescence up to a dose of 2.0 μL of DiR/1 × 105 cells (corresponding to a final concentration of 19.7 μmol/L), with a slight drop of fluorescence at the higher dye concentrations, probably because of cell saturation or quenching, respectively) (preliminary studies, results not shown). On the basis of these results, the standard dose of DiR used for further experiments was set to 2.0 μL/1 × 105 cells. Supplemental Figure 1 demonstrates distribution of the dye in Mϕs with incorporation of DiR in virtually all cells. In preliminary phantom experiments, as few as 10,000 cells distributed in 1 mL of agarose gel could be easily detected using the NIRF scanner and a 3-s acquisition time. As expected, increasing numbers of cells in the phantom resulted in a linear increase of signal intensity (preliminary studies, results not shown). To verify the stability of cell labeling, we cocultured DiR-labeled monocytes in a 1:1 ratio with T cells for 2 d. We did not detect any relevant transfer of the dye from monocytes to T cells (Supplemental Fig. 2).
Vitality and Cell Functionality Assays
The results of vitality and functionality assays are summarized in Supplemental Figure 3. DiR staining did not result in higher rates of apoptosis (Supplemental Fig. 3C) or reduced ability of Mϕs to adhere to plastic surfaces (Supplemental Fig. 3D). The phagocytosis of complement opsonized L. major parasites was not compromised in labeled Mϕs, compared with control cells (Supplemental Fig. 3A). Likewise, the activation of Mϕs after DiR staining was not affected, as reflected by the equal NO production in response to INFγ and lipopolysaccharide (Supplemental Fig. 3B).
In Vivo Experiments
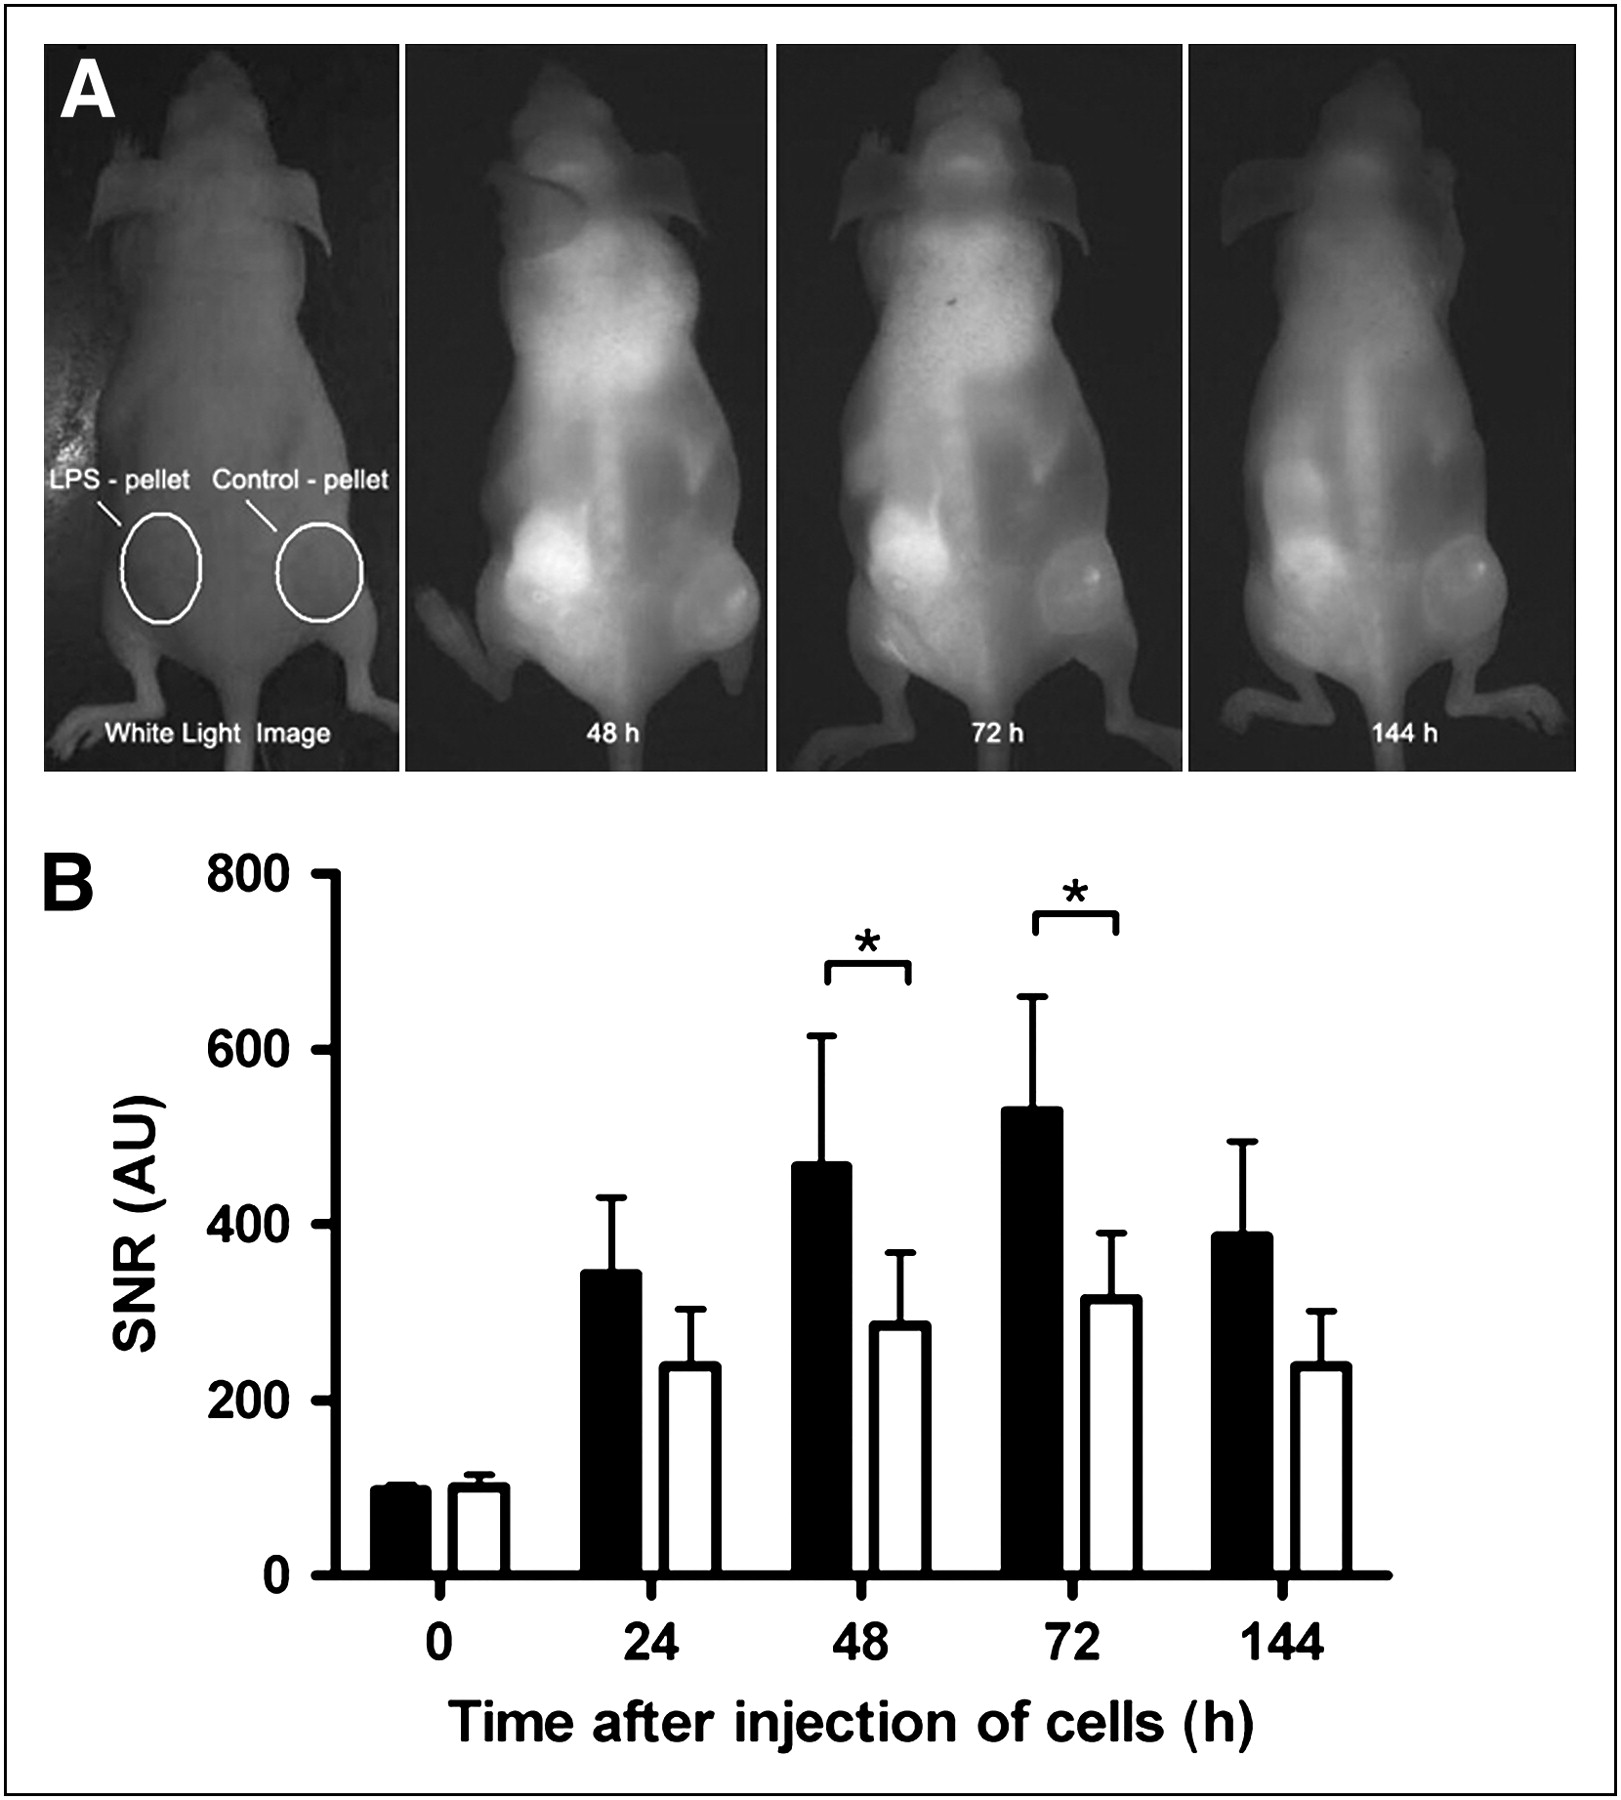
NIRF imaging revealed the homing of labeled Mϕs in different body compartments including liver, lung, and bone marrow and infiltration into gel pellets (Fig. 1). The biogel pellets displayed slightly higher fluorescence signals, with SNRs up to 314 ± 168, than did the reference tissue (skin neck area) (Fig. 1). However, an inclusion of lipopolysaccharide in the pellets resulted in significantly higher SNRs (e.g., 72 h after injection: 529 ± 292 vs. 314 ± 168; P < 0.05, n = 5, Fig. 1).

Contrast enhancement of biogel pellets after injection of labeled Mϕs. (A) Fluorescence reflectance images were repeatedly acquired up to 144 h after injection of labeled Mϕs (5 × 10⁶). (B) Note stronger enhancement of lipopolysaccharide (LPS) pellets (right flank, ▪), compared with control pellets without lipopolysaccharide (left flank, □). Lipopolysaccharide pellets showed increasing conspicuity over first 72 h, with slight drop of signal intensity at 144 h. Means ± SEMs are shown (n = 5). *P < 0.05, Student t test. AU = arbitrary units.
To visualize the spatial distribution of Mϕs, FMT was performed. The tomographic scans showed that Mϕs distributed mainly in the periphery of the pellets, with an approximately 2.7 times higher fluorescence signal in lipopolysaccharide-containing pellets than in controls (459 ± 295 vs. 253 ± 168; P < 0.05, n = 10) (Fig. 2). As seen in the reflectance imaging studies, the remaining cells distributed mainly to the lungs, bone marrow, and liver.
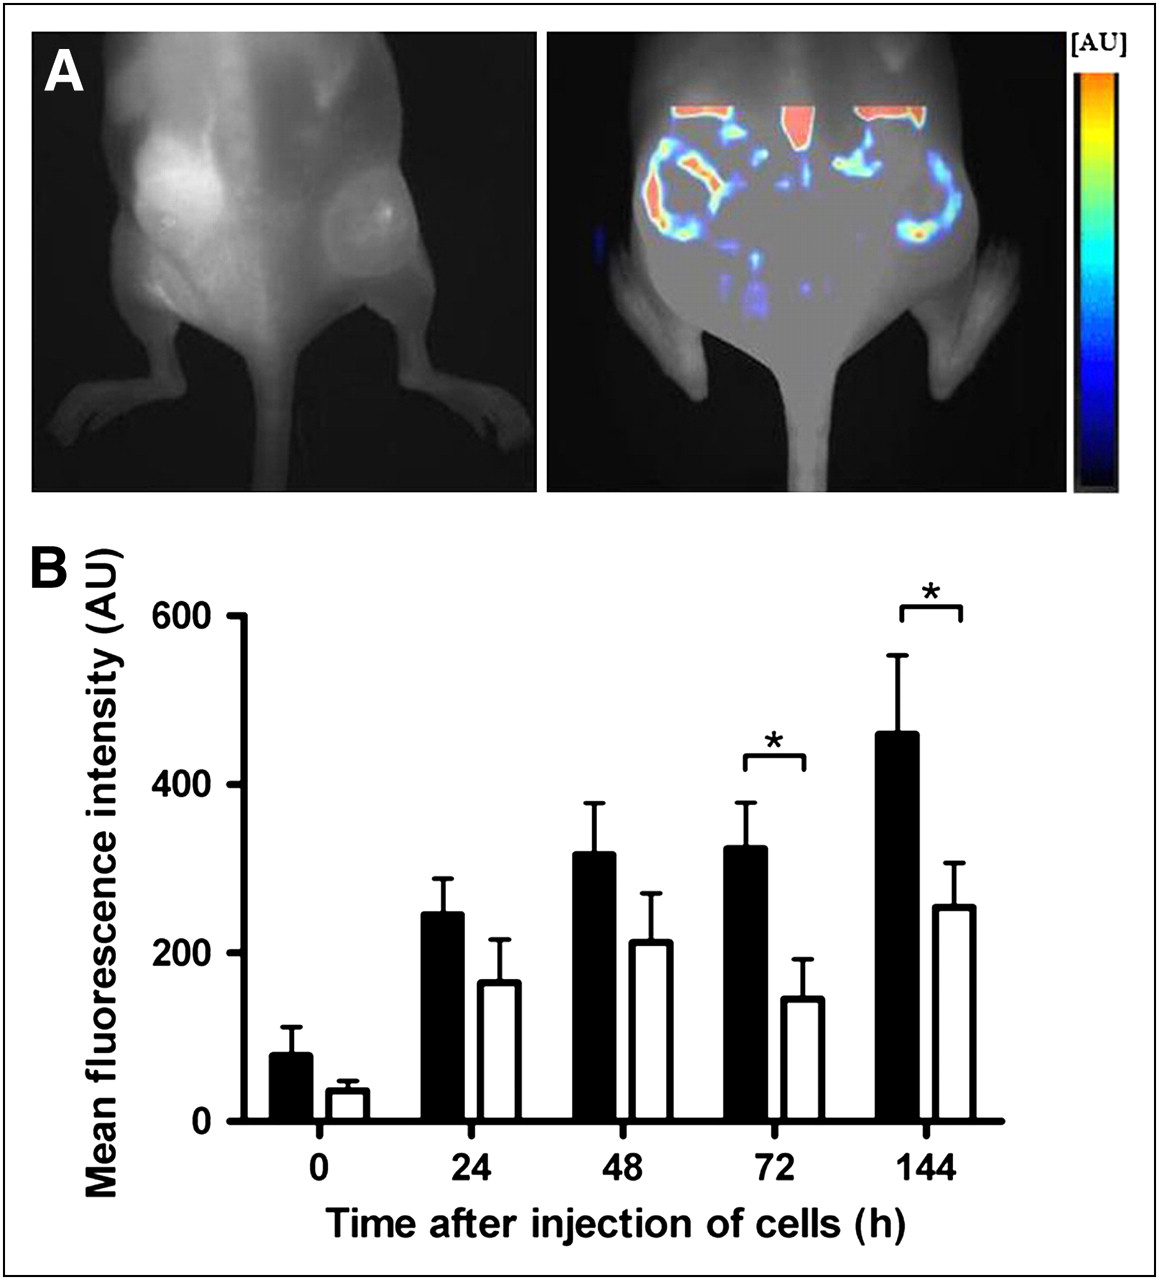
FMT of mice showed distribution of Mϕs inside pellets. (A) FMT was performed 72 h after injection of labeled Mϕs (5 × 10⁶) to resolve 3-dimensional distribution of Mϕs in target tissue (left, NIRF image; right, color-encoded FMT). FMT confirmed FRI results and showed that Mϕs distributed mainly in periphery of pellets. (B) Fluorescence quantification by FMT showed approximately 2.7 times higher signal in lipopolysaccharide-containing pellets (▪) than in controls (□). Means ± SEMs are shown (n = 10). *P < 0.05, Student t test. AU = arbitrary units.
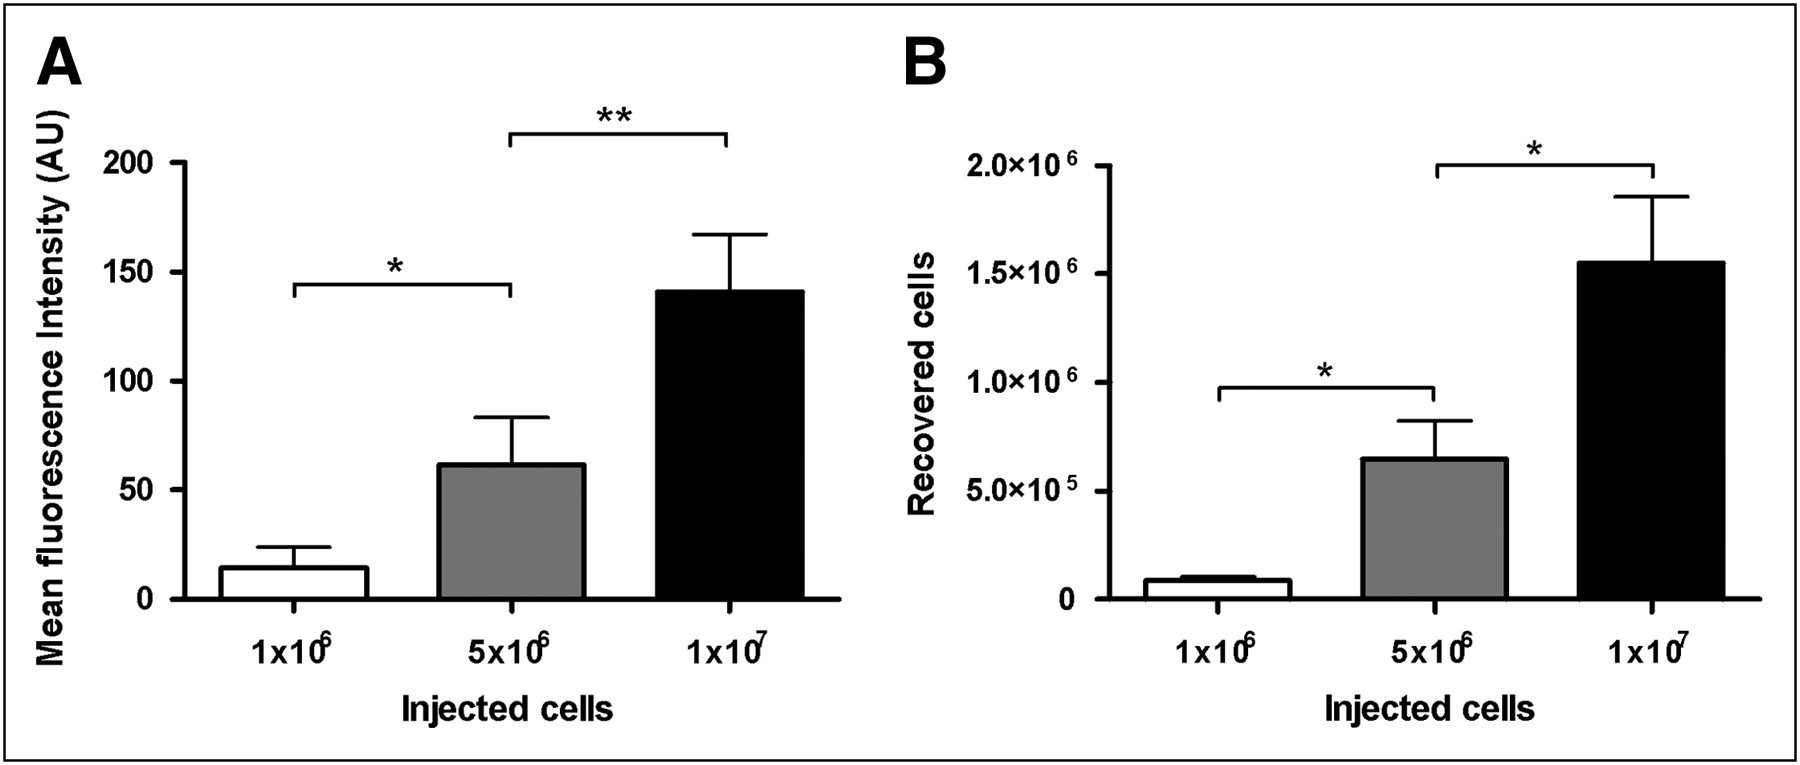
For the dose-response experiments, mice were injected with lipopolysaccharide-containing biogel pellets. The injection of increasing numbers of labeled Mϕs resulted in a significantly increased FMT signal intensity. We detected an almost-linear correlation between FMT signal intensity and the number of injected cells (Fig. 3A). These data were additionally supported by counting the DiR-positive cells recovered from the pellets. In agreement with the FMT data, the intravenous injection of increasing numbers of DiR-stained Mϕs resulted in increasing numbers of DiR-positive cells recovered from the pellets (Fig. 3B). DiR-positive cells recovered from the biogel pellets were uniformly positive for the macrophage differentiation marker F4/80 (Fig. 4) and the macrophage colony-stimulating factor receptor (data not shown). This clearly confirms that the fluorescence signals obtained from the biogel pellets are the result of physiologic extravasation and differentiation of the intravenously injected DiR-labeled Mϕs. In agreement with previously published data, we found that DiR- and F4/80-negative cells were exclusively granulocytes, as revealed by CD11b staining (marker for macrophages and granulocytes). There were no DiR-positive–F4/80-negative cells. Thus, in accordance with our in vitro data on labeling stability (Supplemental Fig. 2), there was no evidence that in vivo Mϕs lose their label to other cells (granulocytes) during the observation period.

(A) Signal intensity of pellets after injection of different numbers of labeled Mϕs. (B) Numbers of DiR-labeled Mϕs recovered from pellets. Lipopolysaccharide-containing biogel pellets were implanted into mice, and different amounts of DiR-labeled Mϕs were injected. FMT and cell recovery were analyzed 72 h after cell injection. FMT showed clear increase of signal intensity dependant on number of injected cells (A). There was also clear dependency between amount of injected cells and numbers of DiR-positive Mϕs recovered from pellets (B). Means ± SEMs are shown (n = 5). *P < 0.05. **P < 0.01, ANOVA. AU = arbitrary units.

Migration of DiR-stained Mϕs in vivo. Mice were injected with 5 × 10⁶ DiR-stained Mϕs. Biogel pellets were recovered 2 d after injection of Mϕs, and intensity of DiR fluorescence and surface antigen expression were measured by flow cytometry.
Up to 23% of the cells recovered from the biogel pellets were DiR-positive Mϕs (1 × 10⁷ cells injected intravenously), and up to 27% of 1 × 10⁷ injected cells could be recovered from the biogel pellets. The results of flow cytometry also allowed an approximate calculation of cell numbers necessary for the visualization of inflammation; in our case, approximately 5 × 10⁵ cells have to be distributed in the pellet to provide a strong signal for optical imaging (Fig. 3B).
DISCUSSION
Understanding the pathophysiology of inflammatory diseases on the cellular and molecular levels remains a major challenge. To elucidate cellular interactions after inflammatory stimuli, in vivo imaging tools—including efficient cell-labeling strategies and highly sensitive imaging techniques—are of major importance. An ideal experimental cell-labeling technique should not interfere with cell viability or cellular function and should provide a stable labeling procedure for the cells to be followed.
From a variety of imaging modalities, only few techniques such as radionuclide imaging or MRI seem to be appropriate to visualize inflammatory changes in tissue (20). Radiolabeling methods usually provide poor spatial resolution and are limited with respect to long-term follow-up experiments by radiation decay, whereas MRI is limited in sensitivity because of high background signal. Moreover, both techniques are cost- and time-consuming procedures and essentially lack the capability for direct ex vivo correlation. Thus, there is existing demand for new methods, ideally allowing an early detection of inflammation in tissue, the study of inflammatory process in a time course, the monitoring of inflammatory changes caused by the application of drugs or modulation of immune response, and a rapid and low-cost imaging process.
The imaging method described in this work responds to all of these criteria, providing a stable cellular label that can be detected with high sensitivity in vivo (over a long time) and correlated ex vivo (e.g., by flow cytometry analysis). We labeled Mϕs, because they represent a cell population that is crucial for basically every step of an immune reaction including the initiation of inflammation and an adaptive immune response, clearance of infectious agents or tumor cells, and resolution of inflammation (5,6,21).
The labeling of Mϕs with DiR proved to be a safe technique, providing flexible long-term monitoring of inflammation in tissues. The incubation of cells with only 20 nmol of DiR/105 Mϕs/mL for 5 min resulted in efficient fluorochrome uptake, and no cellular toxicity was observed. An increase of the DiR dose beyond 20 nmol of DiR/105 Mϕs/mL and an extension of the incubation time did not result in a higher fluorescence, as was probably due to saturation of the cell membranes with the dye or self-quenching of the dye, respectively.
The comprehensive tests regarding viability and functionality of DiR-labeled Mϕs did not show any side effects using 20 nmol of DiR/105 Mϕs/mL. However, higher doses (100 nmol of DiR/105 Mϕs/mL; 100 μmol/L) resulted in increased Mϕs death, indicating toxicity of the dye at this concentration.
Cell-tracker dyes were initially developed for in vitro cell-migration studies. With new imaging technology at hand, this approach can now be directly translated into in vivo imaging models. DiR has previously been used to label lymphocytes and erythrocytes and monitor the homing of these cells to different organs for up to 96 h after intravenous injection into mice using 2-dimensional reflectance imaging (22). The specificity of homing was verified, and no toxicity was observed in this study. However, to the best of our knowledge there are no reports on the labeling of Mϕs with NIR dyes and, more important, there are no reports on the use of cells labeled with NIR dyes for whole-body quantitative 3-dimensional imaging of inflammation in vivo.
Compared with other (alternative) tagging techniques, the labeling with DiR displays many advantages. For example, the application of fluorochrome-labeled NIR-emitting antibodies directed against cell surface marker proteins has been used for the labeling of Mϕs (23). However, Mϕs are not a homogeneous cell population but rather encompass distinct phenotypes. For this reason, the use of cell surface markers for the detection of Mϕs can be fault-prone. Besides, antibodies cannot selectively enter inflamed tissues, whereas labeled cells—if retaining their functional properties—can actively migrate to inflamed tissues and thus have a higher potential for the selective detection of inflammatory processes. Labeling of Mϕs with fluorescent reporter genes (such as green fluorescent protein or DsRed) was also not appropriate for our project, because this technique is a laborious procedure giving relatively low yields; this procedure is also difficult to standardize. Moreover, the expression of the green fluorescent protein can influence the cellular metabolism and is therefore less suitable for the labeling of Mϕs (24). Labeling with organic dyes and quantum dots still has several limitations and concerns regarding the safety of quantum dot bioconjugates for in vivo cellular imaging (25).
Reports about the use of optical tomography for cell-tracking studies are still rare. Recently, Nahrendorf et al. reported the successful visualization of cardiac infarction in mice using a multichannel FMT device (26). Compared with our group, the authors used an indirect labeling approach based on the intravenous injection of magnetofluorescent nanoparticles (CLIO-VT750) in mice with cardiac infarction. The Mϕs and neutrophiles, which are recruited in the infarction zone, phagocytose the particles, leading to a higher concentration of fluorescent particles inside the cells. The authors described robust fluorescence in the heart region 4 d after infarction. A high level of correlation of the results of optical imaging with the results of MRI and ex vivo heart imaging was observed. However, because of the indirect labeling approach this study does not measure inflammatory cell migration in vivo. Viability studies were also not performed.
To access the potential of DiR-labeled Mϕs to monitor and quantify inflammation using whole-body optical imaging in vivo, we used PAG-induced CG formation as a well-characterized model of inflammation (19). The model has the advantage that infiltrating cells can be recovered from the pellets after imaging and subsequently analyzed in vitro. The processes resulting in the influx of Mϕs into CG have been previously analyzed in detail. Thus, PAG induces the release of different mediators (such as complement, various lipid mediators, cytokines) on subcutaneous injection. The primary cells responsible for the initiation of CG formation seem to be tissue mast cells, which produce different mediators (e.g., TNFα). Mice deficient in mast cells showed an almost-complete lack of cellular influx in granuloma formation (19,27). The release of TNFα from mast cells induces an influx of neutrophilic leukocytes at the early stage (6–10 h), which produce Mϕs-recruiting chemokines, leading to recruitment of Mϕs at 24 h and later (19). In our study, we detected Mϕs infiltration into the pellets starting 24 h after the intravenous injection of the cells and peaking between 72 and 144 h. The enrichment of biogel pellets with lipopolysaccharide boosted the influx of labeled macrophages, resulting in SNR values up to 2.4 times significantly higher than for the pellets without lipopolysaccharide. This finding can be easily explained by the fact that lipopolysaccharide is a strong inductor of TNFα secretion in tissue mast cells (28).
The difference in fluorescence strength between lipopolysaccharide-containing and control CG measured by reflectance imaging and expressed in SNR was the highest 72 h after the injection of macrophages, with a slow decrease in the following days. The measurements conducted with optical tomography showed a slightly different result, with the highest fluorescence in lipopolysaccharide-enriched CG 144 h after the injection of Mϕs, which is probably due to a higher contribution of the background signal in reflectance imaging than in tomographic imaging. von Stebut et al. counted macrophages inside the biogel pellets and found the highest number 72 h after pellet implantation, with an approximately constant number of macrophages up to 120 h, which is in good agreement with our FRI and FMT results (19).
In our tomographic images, we saw a higher fluorescence rim surrounding both the biogel pellet with and the biogel pellet without the addition of lipopolysaccharide, indicating infiltration of labeled Mϕs into the peripheral area of CGs. This distribution resembles the microarchitecture seen in granulomatous diseases such as tuberculosis and sarcoidosis, in which macrophages are mainly located in the periphery of the granulomas.
More important, we clearly confirmed stability of Mϕs labeling as well as extravasation of labeled Mϕs by extracting cells from the pellet and analyzing the recovered cells by flow cytometry.
Most important, we also found a clear and linear correlation between fluorescence signals and the number of injected cells, which correlated well with the numbers of DiR-labeled cells recovered from the biogel pellets. This clearly indicates that the applied method yields quantitative results. Thus, we were able not only to localize inflammatory processes in vivo but also to quantify the extent of inflammation in vivo over 7 d. Interestingly, the results of flow cytometry analysis allow an approximate calculation of the cell number necessary for visualization of inflammation; in our case, approximately 5 × 10⁵ cells have to be distributed in the pellet to provide a strong signal for optical imaging.
A comparison with regard to sensitivity between different imaging modalities is difficult, because different model systems and acquisition times are used. Methods reporting the tracking of a single cell with MRI are available but with an image-acquisition time of 3 h or longer (29). With the NIRF scanner used by our group, we could detect a cluster of as few as 10,000 labeled cells with an acquisition time of only 10 s (preliminary experiments, data not shown). Acquisition times up to 30 min are possible using new-generation NIRF scanners, which would allow a detection of even fewer labeled cells. The data on sensitivity of optical tomographic devices are not yet available, and an achieved resolution of approximately 5 × 10⁵ cells distributed through the whole pellet by an acquisition time of 1 min in our experiments is thus only the first encouraging result.
The current study offers a solid basis for future projects. Besides its use in inflammation research, the methodology is potentially also applicable for the study of tumor biology, metastasis, stem cell homing, and more. In our case, the influence of pharmacologic agents (e.g., efalizumab and glucocorticoids) on the migration of Mϕs in vivo and the differential migratory behavior of pro- and antiinflammatory Mϕs subpopulations are under investigation.
CONCLUSION
To our knowledge, this is the first study using the optical imaging of labeled Mϕs to detect inflammation in vivo. Fluorescence cell tagging with DiR is an easy-to-use, inexpensive, and versatile technique, allowing rapid and safe cell labeling. The labeled cells preserve their viability and functionality. Using subcutaneous granuloma formation as an inflammation model, we demonstrated the practical applicability of the technique for the in vivo imaging of Mϕs migration. The method gives both rapid and detailed spatial information about inflammatory processes in living animals and moreover offers a possibility to quantify inflammation over a time of several days in vivo. This approach offers a great potential for both experimental and diagnostic applications. Moreover, the technique offers great potential for other in vivo applications such as stem cell, tumor, or transplantation studies.
Acknowledgments
We thank Eva Nattkemper, Janine Ring, and Wiebke Gottschlich for excellent technical support. This work was supported by grants from the Interdisciplinary Center for Clinical Research (Sun2/019/07), the German Research Foundation (VO 882/2-1, FO 354/2-2, SU 195/3-1, SFB 656), the German Ministry for Research (BMBF/DLR Fkz: 01KI07100), and the European Diagnostic Molecular Imaging Network (proposal 512146).
Footnotes
-
↵* Contributed equally to this work.
-
COPYRIGHT © 2009 by the Society of Nuclear Medicine, Inc.
References
- Received for publication December 7, 2008.
- Accepted for publication June 9, 2009.


Jump to section
Related Articles
Cited By...
- Reprogramming of Monocytes by GM-CSF Contributes to Regulatory Immune Functions during Intestinal Inflammation
- An In Vivo Spectral Multiplexing Approach for the Cooperative Imaging of Different Disease-Related Biomarkers with Near-Infrared Fluorescent Forster Resonance Energy Transfer Probes
- Trafficking Macrophage Migration Using Reporter Gene Imaging with Human Sodium Iodide Symporter in Animal Models of Inflammation