


Abstract
18F-FDG PET is often used to monitor tumor response in multicenter oncology clinical trials. This study assessed the repeatability of several semiquantitative standardized uptake values (mean SUV [SUVmean], maximum SUV [SUVmax], peak SUV [SUVpeak], and the 3-dimensional isocontour at 70% of the maximum pixel value [SUV70%]) as measured by repeated baseline 18F-FDG PET studies in a multicenter phase I oncology trial. Methods: Double-baseline 18F-FDG PET studies were acquired for 62 sequentially enrolled patients. Tumor metabolic activity was assessed by SUVmean, SUVmax, SUVpeak, and SUV70%. The effect on SUV repeatability of compliance with recommended image-acquisition guidelines and quality assurance (QA) standards was assessed. Summary statistics for absolute differences relative to the average of baseline values and repeatability analysis were performed for all patients and for a subgroup that passed QA, in both a multi- and a single-observer setting. Intrasubject precision of baseline measurements was assessed by repeatability coefficients, intrasubject coefficients of variation (CV), and confidence intervals on mean baseline differences for all SUV parameters. Results: The mean differences between the 2 SUV baseline measurements were small, varying from −2.1% to 1.9%, and the 95% confidence intervals for these mean differences had a maximum half-width of about 5.6% across the SUV parameters assessed. For SUVmax, the intrasubject CV varied from 10.7% to 12.8% for the QA multi- and single-observer datasets and was 16% for the full dataset. The 95% repeatability coefficients ranged from −28.4% to 39.6% for the QA datasets and up to −34.3% to 52.3% for the full dataset. Conclusion: Repeatability results of double-baseline 18F-FDG PET scans were similar for all SUV parameters assessed, for both the full and the QA datasets, in both the multi- and the single-observer settings. Centralized quality assurance and analysis of data improved intrasubject CV from 15.9% to 10.7% for averaged SUVmax. Thresholds for metabolic response in the multicenter multiobserver non-QA settings were −34% and 52% and in the range of −26% to 39% with centralized QA. These results support the use of 18F-FDG PET for tumor assessment in multicenter oncology clinical trials.
PET, with the tracer 18F-FDG, is used for tumor detection, staging, and follow-up studies for multiple neoplasms (1) and is increasingly becoming an integral part of multicenter clinical trials in oncology for the assessment of treatment effect. Accurate quantitative assessment of response as measured by changes in standardized uptake value (SUV) parameters over the course of treatment serves as an early surrogate for clinical benefit and facilitates drug development in oncology (2).
For the accurate assessment of tumor response using 18F-FDG PET, it is crucial to know the intrasubject variation in the measurement of semiquantitative parameters before the initiation of treatment (3). This study focused on the repeatability of 18F-FDG PET in a multicenter phase I study. For this study, repeatability is defined by the British Institution of Standards as the variation of repeated measurements in an experiment performed under the same conditions (4).
Repeatability results of quantitative parameters derived from 18F-FDG PET studies have been well published (5–9). Two single-center studies, focusing on double-baseline 18F-FDG PET studies, have reported up to 12% variation in relative absolute percentage difference (5,6) and a 15%−20% repeatability coefficient (RC) (6). Weber et al. (6) reviewed double-baseline 18F-FDG PET studies performed in a single setting with 16 patients and 50 separate tumor lesions including the primary tumor and liver, lung, and lymph node metastasis. Similarly, repeated baseline measurements of SUV showed an SD of the mean percentage difference of approximately 10%. In the review by Weber et al. (6)—although RCs (reference ranges) were calculated for SUV measurements with and without glucose correction—mean SUV (SUVmean), maximum SUV (SUVmax), peak SUV (SUVpeak), and the 3-dimensional isocontour at 70% of the maximum pixel value (SUV70%) parameters (SUV measurements derived using different region-of-interest [ROI] methods) were not evaluated individually for repeatability. Kamibayashi (5) reviewed double-baseline 18F-FDG PET studies in 45 patients with tumors of the lung on 2 different scanners in the same institution. SUVmean and SUVmax, tumor-to-mediastinum and tumor-to-liver ratios, and the relative absolute baseline difference in parameter values between the 2 PET images were calculated. No statistically significant differences between the 2 PET images were observed, except for SUVmax in the liver and tumor-related parameters, tumor to mediastinum and tumor to liver.
Hoekstra et al. (10) published data on SUV variability in a multicenter setting; however, in the study by Hoekstra et al., data were collected at 2 sites only. Studies assessing the repeatability of the SUV parameters SUVmean, SUVmax, SUVpeak, and SUV70% on double-baseline studies for 18F-FDG PET in a larger multicenter setting have not been previously reported.
The goal of this study was to assess the repeatability of select SUV measurements on double-baseline 18F-FDG PET studies and to assess the effect of site compliance with recommended methodologic guidelines, overall data quality, and reader setting on scan data collected in a multicenter setting. Different approaches to explore the variability of baseline SUV changes will be presented, to allow for a comparison with results in similar publications (6,8).
MATERIALS AND METHODS
Patient Population
Sixty-two patients (38 men, 24 women; mean age, 58 ± 11 y; range, 28–78 y) with advanced gastrointestinal malignancies (60 patients with colorectal carcinoma, 1 patient with esophageal carcinoma, and 1 patient with hepatocellular carcinoma), who failed prior therapy and had evaluable metastatic lesions, were included. A single patient was excluded from the dataset because of a limited field of view and the inability to identify suitable lesions for longitudinal assessment. The lesions selected for the remainder of the patients (n = 145) for repeatability assessment and longitudinal follow-up were primarily hepatic (65%) and lung (26%) metastases. The remaining 9% of lesions included lymph node, bone, gastric, intestinal, and kidney metastases. A total of 8 academic sites (5 in the United States, 2 in Canada, and 1 in The Netherlands) performed the 18F-FDG PET studies. At each site, for the 2 wk before the baseline 18F-FDG PET scan, no therapy (chemotherapy, radiotherapy, or surgical treatment) was administered to any of the patients. After patients signed the appropriate informed consent form, 18F-FDG PET was scheduled to be performed on all patients enrolled in the clinical trial. The study was approved by the medical ethics review board of each participating institution.
The patient 18F-FDG PET scans were grouped into 3 datasets for this study, defined as follows: full dataset (multiobserver), patients with double-baseline 18F-FDG PET studies analyzed with local software at each imaging site; quality assurance (QA) dataset (multiobserver), patients with double-baseline 18F-FDG PET studies analyzed with local software at each imaging site that passed a QA assessment on central review; and QA dataset (single-observer), patients with double-baseline 18F-FDG PET studies that passed a QA assessment and were analyzed at the central image-analysis laboratory using a single software platform on central review.
18F-FDG PET
Double-baseline 18F-FDG PET studies were performed within 7 d (4.1 ± 2.6 d) of each other and within 14 d of the start of therapy.
Protocol-specified 18F-FDG PET procedures were established from published recommendations for the use of 18F-FDG PET in the assessment of response to therapy in oncology trials (11–14) in conjunction with local institutional procedures and standards. The specifications included that the 18F-FDG PET studies should be performed at the same facility, with the same equipment and personnel and be processed with the same attenuation and reconstruction methods.
Patients were instructed to fast for a minimum of 4 h before the 18F-FDG PET study and refrain from strenuous activity. Serum glucose measurements were recorded before 18F-FDG administration. The time of the last insulin or hypoglycemic agent dose for diabetic patients was recorded. Acceptable serum glucose concentration levels were defined as less than 11.1 mmol/L.
The dose of administered 18F-FDG ranged from 185 to 740 MBq. The tracer dose, tracer dose assay time, and exact time of injection were recorded. Static emission images covering the area of tumor involvement were to be acquired between 50 and 70 min after 18F-FDG administration. The period between tracer injection and the start of the scan was documented, and subsequent studies were to be performed within a 30-min window (±15 min). In addition to the emission scan, a (low-dose) CT scan or a transmission scan was acquired for attenuation-correction purposes. Apart from the guidelines specified in the study protocol, PET or PET/CT studies were collected and reconstructed according to local guidelines.
PET Data Analysis
ROIs were drawn on up to 3 target lesions from a subset of lesions selected for anatomic measurement on the basis of modified World Health Organization criteria, based on a baseline CT scan. The recommended minimum tumor size was at least 2 times the spatial resolution of the PET scanner and was determined locally. The number of pixels in each of the ROIs was reported and reviewed to ensure selection of comparable areas of tumor and to assess variation in the ROI selection within a patient.
SUV measurements were corrected for lean body mass (15,16) based on the Hume method (17). SUVmean, SUVpeak, and SUVmax were calculated by each site using their respective software analysis packages. These SUV parameters, along with SUV70%, were also analyzed centrally by the VU University Medical Center. Specific SUV parameter definitions are outlined in Table 1.
SUV Parameter Definitions
Statistical Methods
SUVmax, SUVmean, SUVpeak, and SUV70% were measured in up to 3 lesions per patient on the 2 baseline studies. The same lesions were analyzed and compared for both studies. Analysis of repeatability of these parameters was performed on a patient-by-patient basis. Each patient's individual SUV parameters from the selected lesions were summarized across lesions using 2 derived measurements (average value defined as the average of the SUV parameter values across lesions, and maximum value defined as the lesion with the maximum SUV value).
For each SUV parameter and patient (i), the differences (di) between the 2 baseline scan (average or maximum) values were calculated. An initial assessment of variability of SUV percentage changes at baseline was based on the patient's absolute differences |di|, relative to the patient's average (μi) of the 2 baseline values, expressed as a percentage: Eq. 1
Eq. 1
As SUV is known to have a log normal distribution (18), the data was log-transformed before most analysis, and the results were expressed as percentage changes. To confirm the appropriateness of using percentage changes in this study, Kendall τ correlation statistic and diagnostic plots were used in the original and log-transformed (or percentage) scales.
For each parameter, to estimate the mean difference in 2 measurements from a sample of size n, point estimates and 95% confidence intervals (CIs) were calculated on log-transformed data. Exponentiation was applied to these results to express the differences as ratios on the original scale and report them as percentage differences: Eq. 2where
  ln is the mean difference, and SDdln is the SD of the difference on the log scale.
To calculate the RC for each parameter, the within-subject SD, wSDln, of the log-transformed measurements was determined. wSDln can be obtained from the SD of the differences, diln, assuming the repeated measurements are from a distribution with common variance (as described in the supplemental materials, which are available online only at http://jnm.snmjournals.org): Eq. 3
Eq. 3
Exponentiation was applied to the results on the log-transformed scale to calculate the within-subject coefficient of variation (wCV) (%), and the results were expressed as a percentage: Eq. 4
Eq. 4
The 95% RC for each parameter was then calculated as described by Bland and Altman (19); it was first obtained on the log-transformed data (RCln). Using the expression RCln = ±1.96·SDdln = ±2.77·wSDln, we applied exponentiation and multiplied by 100 to express it as a percentage: Eq. 5
Eq. 5
RCs from log-transformed data are nonsymmetric and presented as lower and upper RCs (LRC and URC, respectively). The precision of the RCs was also assessed by 95% CIs using the χ2 distribution (supplemental materials).
The results were visualized graphically for the parameters averaged across lesions by Bland–Altman plots on individual patients' percentage differences versus their average μi overlaid with the RC (LRC, URC) reference lines and with the 95% CIs for the mean percentage difference.
In the full dataset, the effect of clinical site, scan time relative to the dose (50–70 min), between-scan difference in relative time of scan (±15 min), and diabetic status on the SUVmax differences were explored by a general linear model 4-way ANOVA. The model estimated the effect of these parameters on the magnitude of the SUVmax differences.
In addition, for the QA multiobserver dataset, the mean (±SD) for absolute baseline percentage differences in each SUV parameter was tabulated by compliance status for the required scan time parameters. Distribution plots of absolute values of percentage differences were also presented by site for each of the SUV parameters using the average across lesions.
RESULTS
Compliance and QA
The patient-preparation procedures, such as length of fast, blood glucose concentration, and hypoglycemic control, are summarized as follows: the mean (±SD) blood glucose concentrations for each of the 2 baseline 18F-FDG PET scans were 5.7 ± 1.2 mmol/L (range, 3.2–8.6 mmol/L) and 5.7 ± 1.4 mmol/L (range, 2.8–11.6 mmol/L). One of the 8 diabetic patients had poor glycemic control on scan 2 (scan 1, 2.9 mmol/L; and scan 2, 11.6 mmol/L). Glucose values were not reported for 2 patients. All patients fasted for at least 4 h before scanning. The 3 patients with missing or elevated glucose values were considered QA failures. Tracer extravasation occurred in a single patient, resulting in the removal of this patient from the QA dataset.
In addition to the assessment of compliance with requested acquisition and patient-preparation parameters, a technical QA assessment was performed centrally (VU University Medical Center). Two patients did not have scans submitted for this analysis. Three patients had blank or unreadable compact disks. Seven patients had irresolvable issues resulting from changes in technology or Digital Imaging and Communications in Medicine inconsistencies during the trial. On the basis of compliance and technical quality, a set of 45 patients comprises the QA dataset (Fig. 1).
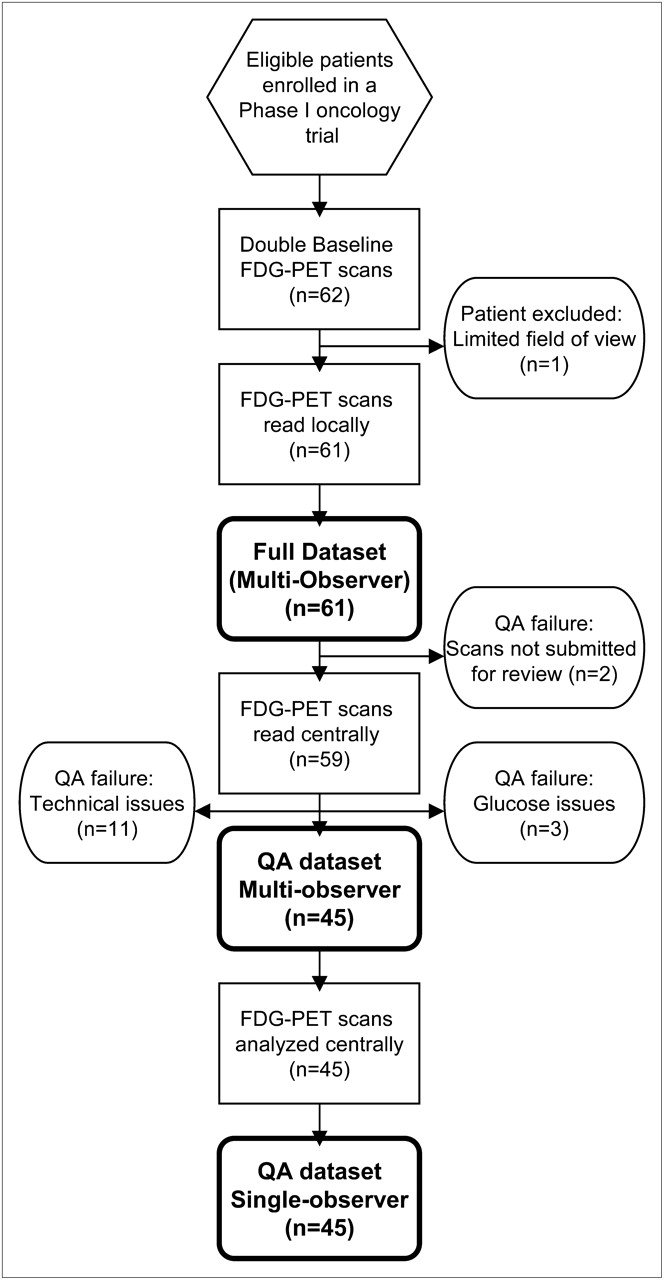
Standards for Reporting of Diagnostic Accuracy Studies–style diagram outlining patient image flow through acquisition and analysis process and resultant datasets based on compliance and QA standards.
Table 2 shows summary statistics and frequency of the scan acquisition parameters, 18F-FDG dose, scan start time relative to 18F-FDG dose administration (50–70 min), between-scan time difference in the relative scan times (required within ±15 min), number of days between the baseline scans (required within 7 d), and acceptable data passing QA assessment, by study site and overall.
Site Compliance with Select Image Acquisition Parameters and Overall Quality
Visual inspection of the baseline differences on the log scale, for example, by normal probability and distribution plots, indicated approximately normal distributions for the baseline differences in SUV parameters.
Results of the statistical analysis on SUV differences, assessing the effects of site, scan time relative to 18F-FDG dose, between-scan time difference, and diabetic status, demonstrated that the average size of SUVmax differences across sites varied from 8% to 24%. Patients without glucose control had SUV differences of 14%, versus 4% for patients with glucose control. This analysis excluded a patient who had an out-of-range glucose value in 1 scan. Overall, site, diabetic status, and scan time parameters did not appear to affect average SUV changes in this study.
SUV Parameters
Absolute baseline percentage differences were summarized by scan time relative to dose and between-scan-time relative differences for SUV parameters averaged across lesions (Table 3). In the QA and full datasets, for patients whose scans were not compliant with the timing recommendations, either outside the 50- to 70-min window (47% and 51%, respectively) or exceeding 15 min in relative time between the 2 scans (24% and 30%, respectively), the differences in SUVmean and SUVpeak were similar to those for scans meeting both criteria. Absolute percentage differences were larger in baseline SUVmax for patients outside the 50- to 70-min window and exceeding the 15-min relative time between scan recommendations, particularly in the full dataset.
Summary of Baseline Absolute Percentage Difference for SUV Parameters by Scan Time
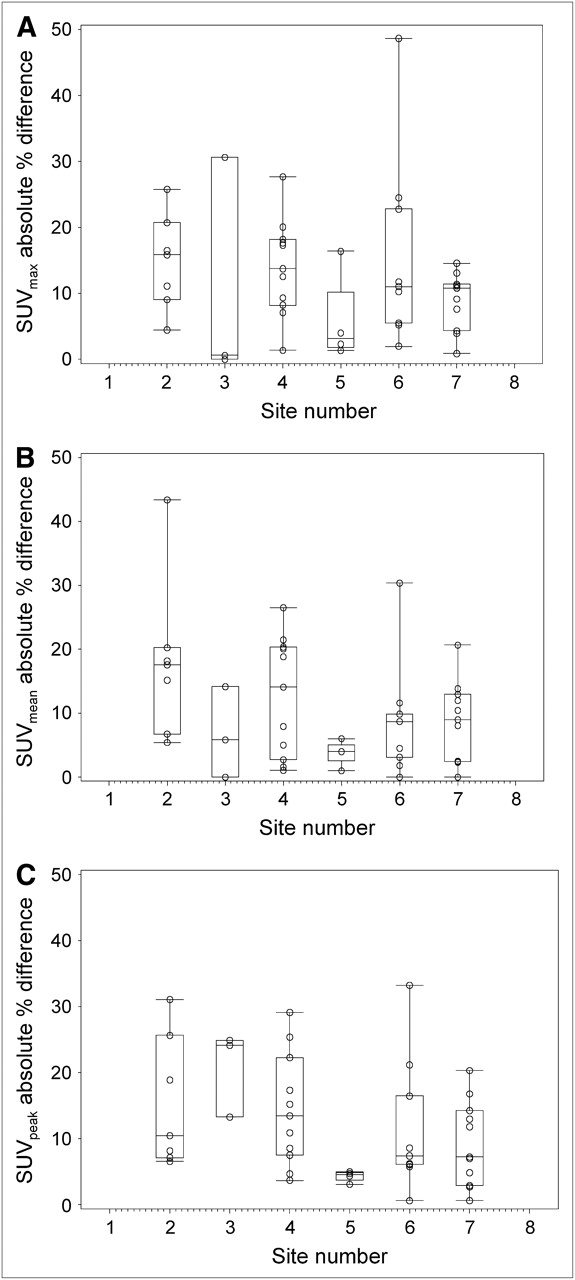
Figure 2 shows the distribution of the absolute values of percentage differences in the 2 baseline scans presented by study site, using averages across lesions. Some variability was noted across sites but was comparable among the 3 parameters in the QA multiobserver dataset (Figs. 2A and 2C) and only somewhat higher for SUVmean (Fig. 2B).

Distribution of absolute percentage differences at baseline by site and SUV parameter: (A) SUVmax, (B) SUVmean, and (C) SUVpeak. Boxes represent values between 25th and 75th percentiles; horizontal lines (within boxes) indicate median; and box plot whiskers (above and below boxes) represent values at 10th and 90th percentiles.
Repeatability Assessment
To assess the effect of the QA procedures, repeatability analysis was performed for SUVmax for the full dataset (n = 61) and for the datasets that passed the QA assessment (n = 45) in both the multi- and the single-observer settings. Summary statistics (means and SD) for absolute differences relative to the average of baseline values as in Equation 1, based on average and maximum across lesions, are presented in Table 4. These results reflect a reduction in both the absolute differences and the variability on central QA assessment (QA multiobserver) and a further subtle decrease in variability on central data analysis (QA single-observer).
SUVmax Relative Absolute Baseline Differences (RelAb_d*) (%)
The intrasubject precision of baseline measurements was assessed by RCs for the individual patient differences, by intrasubject CVs and by CIs on the mean differences. Analysis of SUVmax was performed for the full and QA datasets, in the multi- and single-observer settings. SUVmean, SUVpeak, and SUV70% were assessed for the QA multi- and single-observer datasets only (Table 5).
Summary of Repeatability Analysis Results* and Other Descriptive Statistics for SUV Parameters for All Datasets
A test of association using the Kendall τ rank correlation statistic for the absolute differences |di| and averages μi on the original scale showed statistically significant results for all parameters. This analysis and the diagnostic plots (Fig. 3A) indicated a dependence of the size of the SUV differences on the size of the parameter value. In contrast, Kendall τ statistic on log-transformed data showed a lack of statistically significant correlation of differences |diln| with the means, and scatter plots on percentage changes showed less dependence on the size of the measurements (Fig. 3B). This supports the selection of percentage changes in this study as a more appropriate measurement for assessing repeatability.

Scatter plot of absolute baseline SUVmax differences vs. average SUVmax based on QA dataset.
The mean percentage differences between baseline measurements ranged from −2.1% to 1.9% across the parameters, and the 95% CIs had a maximum half-width of 5.6% (Table 5). The intrasubject CV for SUVmax was approximately 16% for the full dataset and 10%−12% for patients in the QA datasets. Repeatability was similar for all SUV parameters across settings, with lower RCs for SUVmax for the QA datasets (up to −26.8% and 36.7% [single-observer] and −26.2% and 35.6% [multiobserver]) and for the full multiobserver dataset (up to −34.3% and 52.3%). There was somewhat smaller variability with the performance of a centralized single-observer QA assessment for the SUVmax calculated as mean of parameter values across lesions.
The individual patient percentage changes in the SUVmax parameter for the full multiobserver, QA multiobserver, and QA single-observer datasets, with the 95% RCs and CIs, are presented by Bland–Altman (19) plots based on averages across lesions (Figs. 4A–4C). Centralized QA has the largest impact, with some further, but smaller, improvement with single-observer data analysis.

Bland–Altman Plots of 18F-FDG PET SUVmax using average across lesions for full (n = 61) (A), QA multiobserver (n = 45) (B), and QA single-observer (n = 45) (C) datasets. Horizontal lines denote no-change line, 95% CIs for mean differences (LCI, UCI), and 95% RCs (LRC, URC), both expressed as percentages. Site symbols (A): 1 = z; 2 = ○; 3 = Δ; 4 = □; 5 = ◊; 6 = *; 7 = x; and 8 = Y. Site symbols (B and C): 2 = z; 3 = ○; 4 = Δ; 5 = □; 6 = ◊; and 7 = *.
DISCUSSION
18F-FDG PET studies are increasingly implemented as an objective method for response assessment in drug development. For accurate and reproducible quantitative assessment, standardization of 18F-FDG PET methodology, including patient preparation, image scan acquisition guidelines, and image analysis, is essential, particularly in the multicenter setting.
Site compliance with several common parameters used in the acquisition of 18F-FDG PET and basic QA were evaluated. Overall compliance with successful scan acquisition (123/124 expected scans) was excellent. Site-reported data for 61 patients revealed acceptable repeatability. An effort to corroborate the site-reported data by central review resulted in a smaller dataset, predominately because of QA issues.
Patient-Related Parameters
To account for changes in blood glucose concentration (20), which may affect SUV, it is recommended that patients fast for at least 4 h before the 18F-FDG PET study, that accurate blood glucose concentration be measured before the scan, and that the patient's diabetic status be documented. Fasting blood glucose concentration was within the 18F-FDG PET guideline recommendation, defined in this study as less than 11.1 mmol/L for both diabetic and nondiabetic patients with the exception of a single diabetic patient. High serum glucose concentration can diminish the accuracy of the SUV determination, and the single patient outlier with an elevated glucose value (11.6 mmol/L) did show large baseline differences in all SUV parameters. On the basis of the data from 5 diabetic patients included in this study, repeatability was not affected by a patient's diabetic status, as long as glucose concentration was controlled (within acceptable range for this study) at the time of the 18F-FDG PET scan.
Image-Acquisition Parameters
The consensus recommendation (11) for the collection of a static scan at 60 min after the intravenous injection of 18F-FDG and a ±15-min window between scans of a patient was used in this study. The lack of compliance with the study-recommended timing for scan performance had the greatest effect on SUVmax in the full dataset. In addition, deviation from consensus guidelines resulted in increased baseline absolute differences for all SUV parameters with a greater than 15-min scan-to-scan time. Because 18F-FDG continues to accumulate for 150 min, 18F-FDG uptake values can be variable at different times in the uptake period (21), thus ensuring scan performance within the recommended 50- to 70-min window; the interscan time frame of ±15 min is good practice.
QA Assessment
In an effort to corroborate site-reported SUV data, submission of scan data for central review was requested. In this study, overall quality was acceptable; however, to improve quality in a multicenter setting, the rescheduling of patients in specific instances is recommended (i.e., unacceptable blood glucose elevation or tracer extravasation). Assessing quality in real time, following stringent guidelines regarding the format of the image submission, and ensuring local system back-up of the data may prevent loss of data due to resolvable technical issues.
Image-Analysis Parameters
Ideally, a method for ROI definition should be simple, reproducible, generally applicable, and user-independent (7). In this study, the different SUV parameters (SUVmean, SUVpeak, and SUVmax) resulted in similar levels for repeatability. An additional parameter, SUV70%, generated using a 70% threshold of the maximum tumor SUV and isocontour-adapted for local background, was also assessed. The repeatability was similar for all studied SUV parameters, evaluated either by the lesion with the highest SUV or by the average SUV across lesions, showing only slight variation among the RCs. Use of a single software platform for defining ROIs and SUV calculation may further enhance test–retest variability, as suggested by the somewhat better test–retest data (Table 4) of single- (central) versus multiobserver analysis. This may be important in a response-monitoring setting and in avoiding incorrect SUV response assessments because of technical, data entry, or human error.
Approaches for Assessing Variability of SUV
In this study, various approaches for assessing the variability of SUV differences are presented, including RCs, intrasubject CV, and absolute percentage or relative changes allowing for interpretability with published results (6,8).
SUV percentage change, rather than absolute change, was used to assess repeatability, as this is appropriate in settings in which SUV differences increase with SUVs (Fig. 3) and was used broadly for assessing response (13). Clinical applications in which absolute SUV is used, that is, assessing residual SUV during or after treatment or when SUV is used as prognostic factor (22), and studies that have addressed assessment of an absolute SUV floor (23) are reported. Optimal measurements to assess response may depend on the tumors in combination with therapies being investigated or a combination of assessments, such as a defined relative change along with an absolute SUV change, as suggested by Wahl et al. (24).
The results of this study demonstrate variability to be somewhat larger for the non-QA multiobserver analysis (15.9%) than what was seen in single-center studies (10%−12%) (5,6), though still within a reasonable range, as single-center test–retest variability ranges from 6% to 10% to up to 42% (6,8,9,25). Performing centralized QA to assess protocol compliance resulted in variability (10.7%−12.8%). True response versus statistical fluctuation can be delineated, and standardized criteria for response assessment can be defined on the basis of test–retest repeatability and an accurate ROI definition and the SUV parameter in carefully selected lesions. Current European Organization for Research and Treatment of Cancer guidelines (13) for 18F-FDG PET response assessment delineate progressors and responders based on a ±25% deviation from baseline values. On the basis of the repeatability results of this study, the threshold for determining metabolic response may be on the order of up to −34% in a multicenter multiobserver non-QA setting and up to −25% to −27% in a multicenter centralized QA setting, allowing for increased confidence that a true change from baseline has occurred. In addition, these RCs show that increases in the ranges of 40%−50% in SUV from baseline values after treatment (39% for QA datasets to 52% for non-QA datasets) may be indicative of lack of treatment effect and therefore be deemed progression from baseline (Table 5).
CONCLUSION
Repeatability, defined as the variation of repeated measurements in an experiment performed under the same conditions, was similar for the studied SUV parameters (SUVmean, SUVmax, SUVpeak, and SUV70%) assessed with double-baseline 18F-FDG PET scans in a variety of analysis settings for this multicenter study. Although the variability in the absence of close compliance with consensus recommendations was comparable with reported single-center test–retest studies, centralized QA of data improved intrasubject CV from 15.9% to 10.7% for SUVmax and the threshold for determining metabolic changes from approximately −34% to −27% and from +52% to +37%, respectively. This study supports the use of 18F-FDG PET as a tumor-assessment tool in multicenter oncology clinical trials, provided a centralized QA assessment of the data is performed.
Acknowledgments
We acknowledge the patients who participated in this study and their families. We also thank the clinical and imaging teams at the 8 study sites included in this study: John Marshall and David Earl-Graef, Georgetown University Hospital, Washington, DC; Pierre Major and Carol Dunne, Juravinski Cancer Centre, Hamilton, Ontario; Patricia LoRusso and Anthony Shields, Karmanos Cancer Center, Detroit, Michigan; Chris Garrett and Claudia Berman, H. Lee Moffitt Cancer Center, Tampa, Florida; Lillian Siu and Dave Wilson, Princess Margaret Hospital, Toronto, Ontario; Caio Rocha-Lima and Hilton Gomes/Sylvester Comprehensive Cancer Center, Miami, Florida; Anthony el-Khoueiry and Peter Conti, USC/Norris Comprehensive Cancer Center, Los Angeles, California; and Jan Buter and Otto Hoekstra, VU University Medical Center, Amsterdam, The Netherlands. A special thanks to Nikie Hoetjes and Reina Kloet for their continued efforts. Consultation and central QA and data analysis performed by VU University Medical Center was sponsored by Bristol-Myers Squibb Co. Linda Velasquez, Georgia Kollia, Wendy Hayes, and Susan Galbraith are employees of Bristol-Myers Squibb Co.
Footnotes
-
COPYRIGHT © 2009 by the Society of Nuclear Medicine, Inc.
References
- Received for publication March 8, 2009.
- Accepted for publication July 10, 2009.


Jump to section
Related Articles
Cited By...
- Hot Spot Imaging in Cardiovascular Diseases: An Information Statement from SNMMI, ASNC, and EANM
- Standardized Uptake Value for 18F-Fluorodeoxyglucose Is a Marker of Inflammatory State and Immune Infiltrate in Cervical Cancer
- Performance of Digital PET Compared with High-Resolution Conventional PET in Patients with Cancer
- Quantitative Test-Retest Measurement of 68Ga-PSMA-HBED-CC in Tumor and Normal Tissue
- Test-Retest Reproducibility of 18F-FDG PET/CT Uptake in Cancer Patients Within a Qualified and Calibrated Local Network
- Variability and Repeatability of Quantitative Uptake Metrics in 18F-FDG PET/CT of Non-Small Cell Lung Cancer: Impact of Segmentation Method, Uptake Interval, and Reconstruction Protocol
- Use of a Qualification Phantom for PET Brain Imaging in a Multicenter Consortium: A Collaboration Between the Pediatric Brain Tumor Consortium and the SNMMI Clinical Trials Network
- The Influence of Minimal Misalignment on the Repeatability of PET Images Examined by the Repositioning of Point Sources
- Reproducibility of MR-Based Attenuation Maps in PET/MRI and the Impact on PET Quantification in Lung Cancer
- Novel Method to Detect and Characterize 18F-FDG Infiltration at the Injection Site: A Single-Institution Experience
- Repeatability of SUV in Oncologic 18F-FDG PET
- Repeatability of 18F-FLT PET in a Multicenter Study of Patients with High-Grade Glioma
- Quantitative Accuracy and Lesion Detectability of Low-Dose 18F-FDG PET for Lung Cancer Screening
- Repeatability of Quantitative 18F-NaF PET: A Multicenter Study
- Repeatability of Quantitative Whole-Body 18F-FDG PET/CT Uptake Measures as Function of Uptake Interval and Lesion Selection in Non-Small Cell Lung Cancer Patients
- A Method to Improve the Semiquantification of 18F-FDG Uptake: Reliability of the Estimated Lean Body Mass Using the Conventional, Low-Dose CT from PET/CT
- Molecular Imaging to Plan Radiotherapy and Evaluate Its Efficacy
- Repeatability of 18F-FDG PET/CT in Advanced Non-Small Cell Lung Cancer: Prospective Assessment in 2 Multicenter Trials
- The Value of Establishing the Quantitative Accuracy of PET/CT Imaging
- Repeatability of Quantitative FDG-PET/CT and Contrast-Enhanced CT in Recurrent Ovarian Carcinoma: Test-Retest Measurements for Tumor FDG Uptake, Diameter, and Volume
- Using FDG-PET to Measure Early Treatment Response in Head and Neck Squamous Cell Carcinoma: Quantifying Intrinsic Variability in Order to Understand Treatment-Induced Change
- Differences in the Biologic Activity of 2 Novel MEK Inhibitors Revealed by 18F-FDG PET: Analysis of Imaging Data from 2 Phase I Trials
- Prognostic PET 18F-FDG Uptake Imaging Features Are Associated with Major Oncogenomic Alterations in Patients with Resected Non-Small Cell Lung Cancer
- Noise Considerations for PET Quantification Using Maximum and Peak Standardized Uptake Value
- Repeatability of 18F-FDG Uptake Measurements in Tumors: A Metaanalysis
- Prospective Trial of Synchronous Bevacizumab, Erlotinib, and Concurrent Chemoradiation in Locally Advanced Head and Neck Cancer
- Computerized Method for Automatic Evaluation of Lean Body Mass from PET/CT: Comparison with Predictive Equations
- Need for Standardization of 18F-FDG PET/CT for Treatment Response Assessments
- Quantifying and Reducing the Effect of Calibration Error on Variability of PET/CT Standardized Uptake Value Measurements
- Reproducibility of 18F-FDG and 3'-Deoxy-3'-18F-Fluorothymidine PET Tumor Volume Measurements
- Nonlaxative PET/CT Colonography: Feasibility, Acceptability, and Pilot Performance in Patients at Higher Risk of Colonic Neoplasia