


Abstract
An autoradiography method revealed intratumoral inhomogeneity in various solid tumors. It is becoming increasingly important to estimate intratumoral inhomogeneity. However, with low spatial resolution and high scatter noise, it is difficult to detect intratumoral inhomogeneity in clinical settings. We developed a new PET system with CdTe semiconductor detectors to provide images with high spatial resolution and low scatter noise. Both phantom images and patients' images were analyzed to evaluate intratumoral inhomogeneity. Methods: This study was performed with a cold spot phantom that had 6-mm-diameter cold sphenoid defects, a dual-cylinder phantom with an adjusted concentration of 1:2, and an “H”-shaped hot phantom. These were surrounded with water. Phantom images and 18F-FDG PET images of patients with nasopharyngeal cancer were compared with conventional bismuth germanate PET images. Profile curves for the phantoms were measured as peak-to-valley ratios to define contrast. Intratumoral inhomogeneity and tumor edge sharpness were evaluated on the images of the patients. Results: The contrast obtained with the semiconductor PET scanner (1.53) was 28% higher than that obtained with the conventional scanner (1.20) for the 6-mm-diameter cold sphenoid phantom. The contrast obtained with the semiconductor PET scanner (1.43) was 27% higher than that obtained with the conventional scanner (1.13) for the dual-cylinder phantom. Similarly, the 2-mm cold region between 1-mm hot rods was identified only by the new PET scanner and not by the conventional scanner. The new PET scanner identified intratumoral inhomogeneity in more detail than the conventional scanner in 6 of 10 patients. The tumor edge was sharper on the images obtained with the new PET scanner than on those obtained with the conventional scanner. Conclusion: These phantom and clinical studies suggested that this new PET scanner has the potential for better identification of intratumoral inhomogeneity, probably because of its high spatial resolution and low scatter noise.
PET with 18F-FDG has been widely used in oncology studies. A high-resolution PET camera permits precise evaluation of tumor localization and treatment effects. Recently, CdTe semiconductors were used for the direct conversion of γ-rays without scintillator material (1,2). High energy resolution and flexibility in both the sizing and the fine arrangement of detectors are expected to improve image quality. These characteristics of semiconductor detectors may also lead to improved PET images because the high energy resolution offers a reduction in scatter noise, like that seen with γ-camera and SPECT applications (1,3).
A depth-of-interaction (DOI) detection system has already been used in some PET scanners, particularly in PET scanners dedicated to use for the human brain. This is because DOI information is very useful for reducing the parallax errors at the periphery of the field of view (FOV) (4,5). With both semiconductor detectors and a DOI system, high-quality PET images with low scatter noise and high spatial resolution are expected.
Intensity-modulated radiation therapy is an advanced mode of highly precise radiotherapy that uses computer-controlled x-ray accelerators to deliver precise radiation doses to a malignant tumor or specific areas within a tumor; intensity-modulated radiation therapy has become widely used in clinical settings (6–8). We reported that image fusion between 18F-FDG PET and MRI/CT was useful for gross tumor volume and clinical target volume determinations in conformal radiation therapy (11), and several other studies revealed the clinical impact of 18F-FDG PET/CT fusion on radiation planning (8–10). In radiation therapy, it is becoming increasingly important to estimate intratumoral inhomogeneity for more accurate radiation planning.
We developed a new PET scanner with CdTe semiconductor detectors and a DOI system. Both phantom images and patients' images obtained with this new PET scanner were compared with conventional bismuth germanate PET images to evaluate intratumoral inhomogeneity.
MATERIALS AND METHODS
Outline of Our New PET Scanner
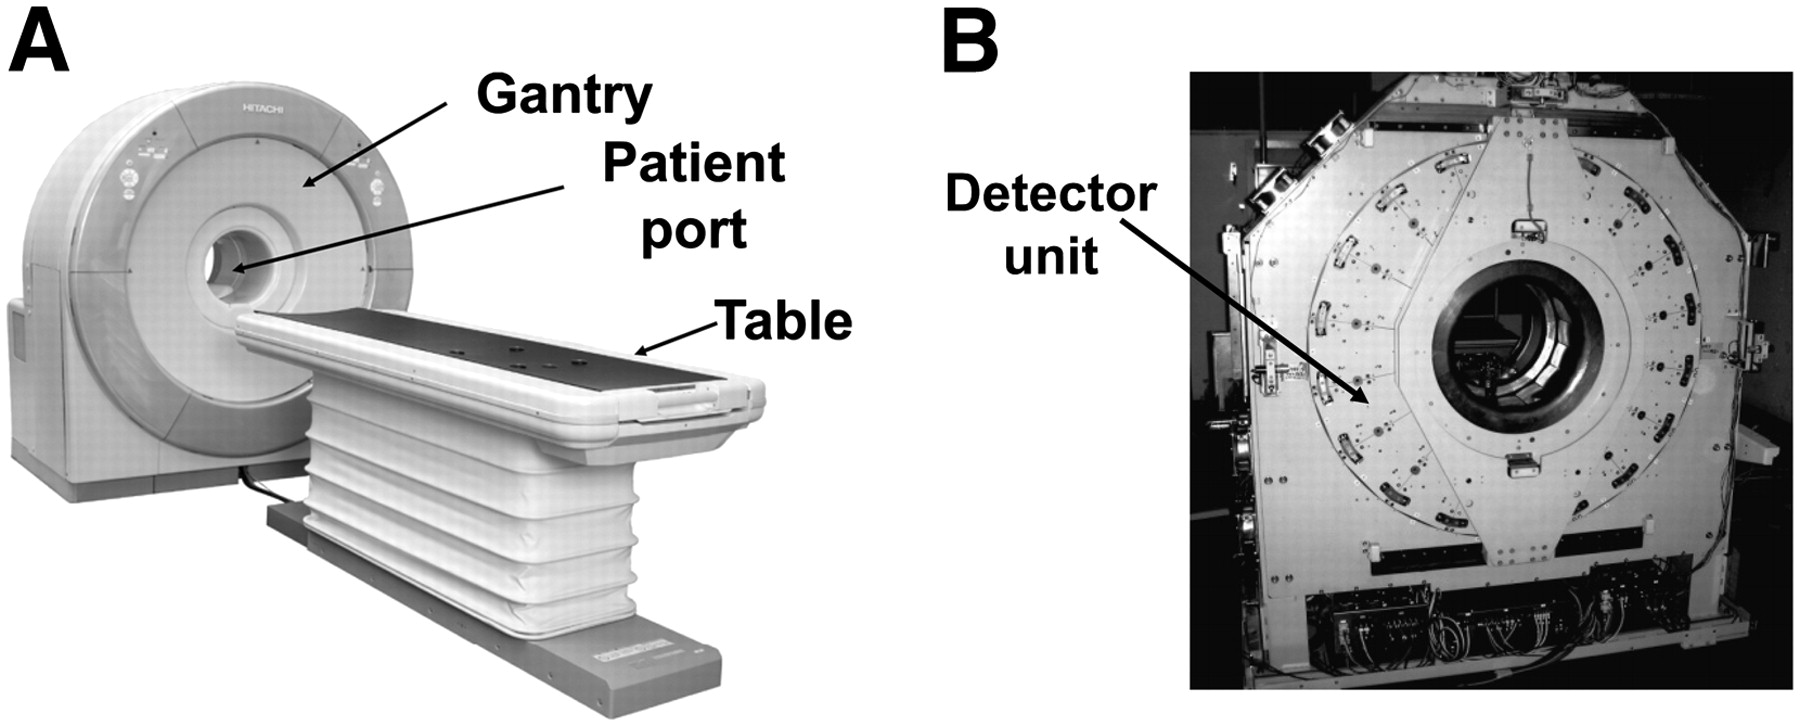
Figure 1 shows our prototype 3-dimensional (3D) PET scanner dedicated to human brain imaging. The diameter of the patient port is 350 mm, the transaxial FOV is 310 mm, and the axial FOV is 250 mm. There are 18 detector units radially arranged around the patient port.

(A) Prototype 3D PET scanner dedicated to human brain imaging. Diameter of patient port is 350 mm, transaxial FOV is 310 mm, and axial FOV is 250 mm. (B) Eighteen detector units are radially arranged around patient port.
Figure 2 shows the structure of the detector unit. The new detector size is 2 × 4 × 7.5 mm. The dimensions of the detector unit are 100 × 400 × 350 mm. In the unit, the detector boards are arranged in parallel, and the detectors are mounted on both sides of each board. A detector board has 96 detectors on each side (192 detectors in total) and signal processors. These processors include application-specific integrated circuits mounted along the incident direction of γ-rays. Signals are read by a 3-layer DOI system. Each unit has 22 boards and about 4,000 detectors. The entire system is cooled by forced air.
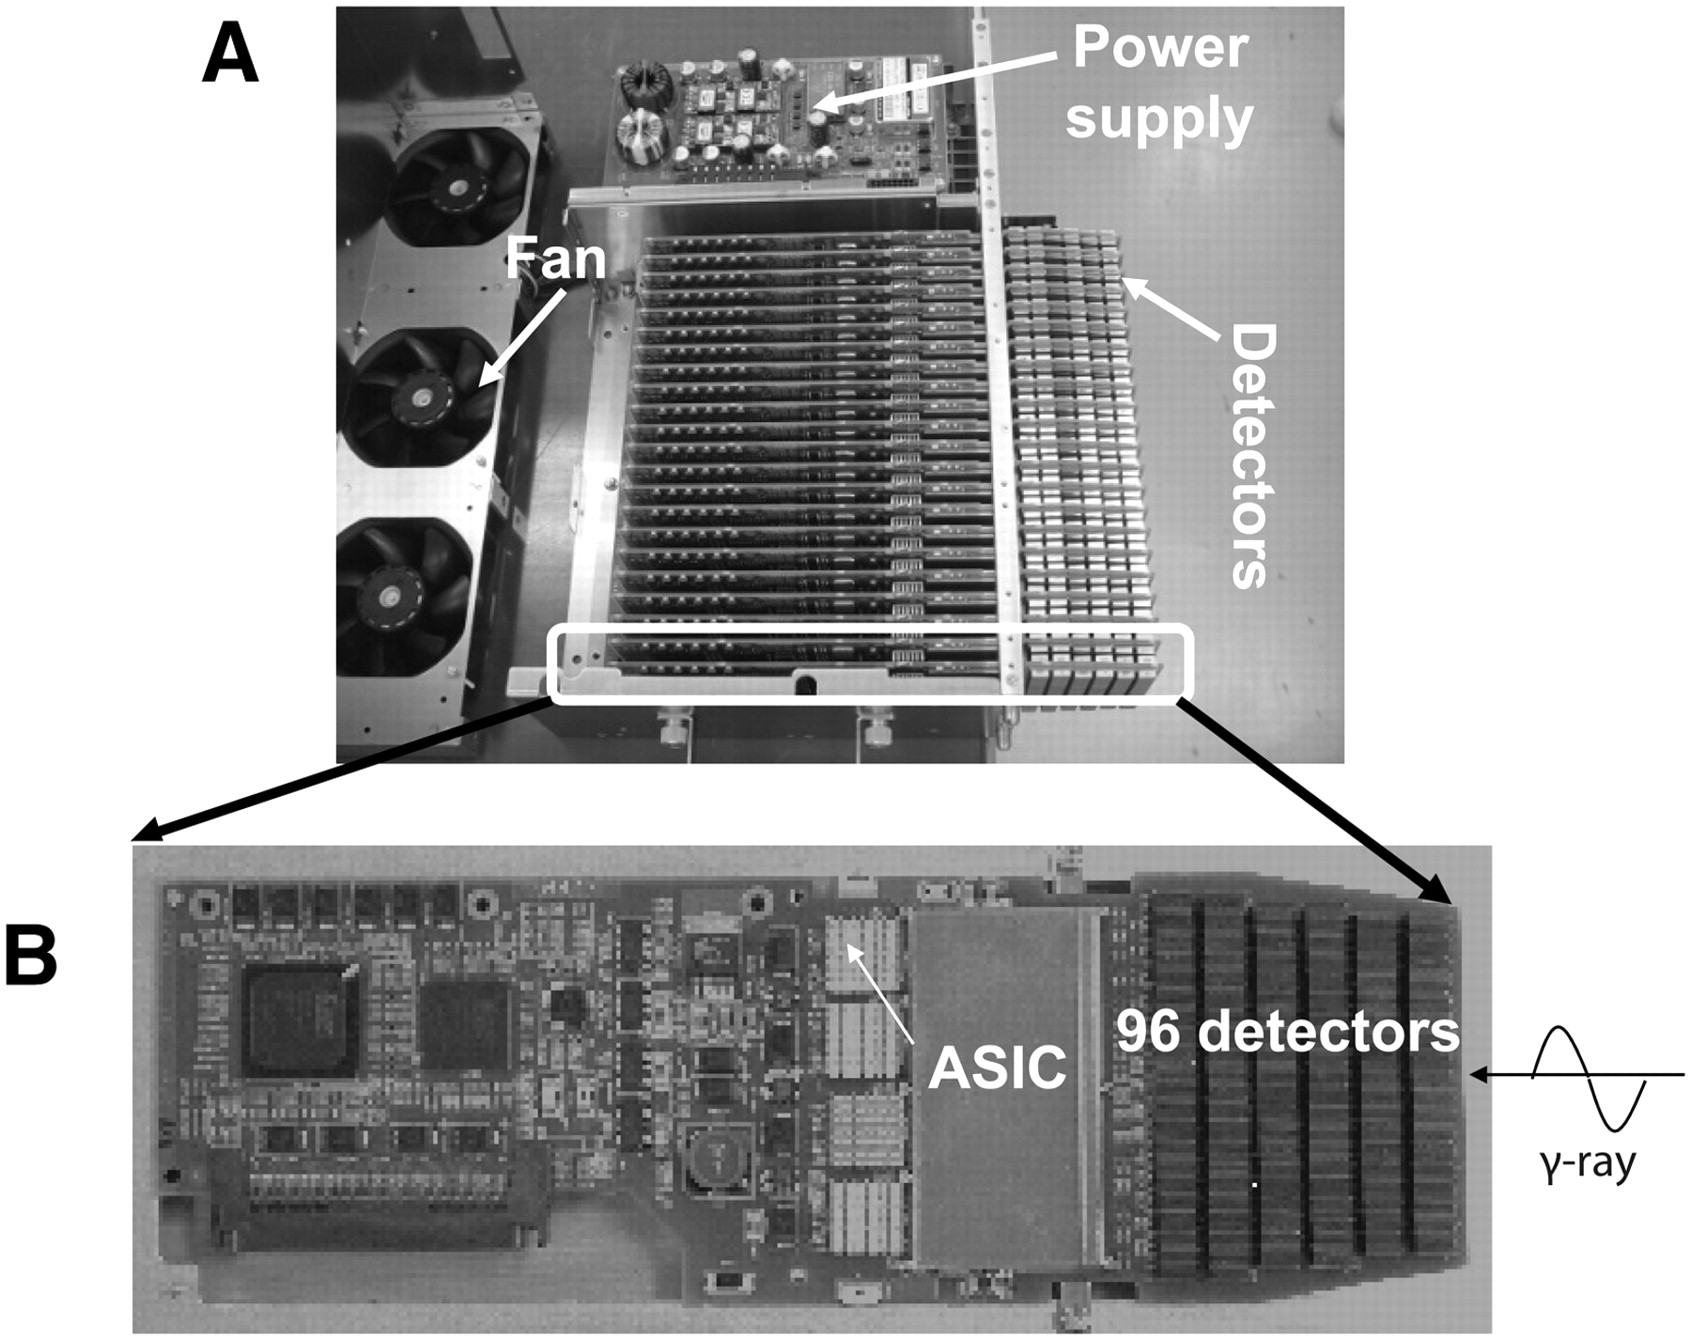
(A) Structure of detector unit. New detector size is 2 × 4 × 7.5 mm. Dimensions of detector unit are 100 × 400 × 350 mm. Detector boards are arranged in parallel, and detectors are mounted on both sides of each board. (B) Detector board has 96 detectors on each side (192 detectors in total) and signal processors. These processors include application-specific integrated circuits (ASICs) mounted along incident direction of γ-rays. Signals are read by 3-layer DOI system. Each unit has 22 boards and about 4,000 detectors. Entire system is cooled by forced air.
CdTe detectors have good energy resolution characteristics for use at room temperature. However, it is well known that the polarization effect deteriorates the energy resolution in several tens of minutes and then shifts the photopeaks. For stabilization of detector performance, an automatic periodic bias reset technique was developed for the scanner (12). The negligible reset duration (0.5 s) with a 5-min reset interval is sufficient to stabilize detector performance under normal operating conditions at room temperature.
Physical Performance of New PET Scanner
The energy resolution of the new scanner is 4.1% (full width at half maximum [FWHM]), which is superior to the energy resolution obtained with available scintillation detectors (e.g., 10%−20%). The timing resolution was evaluated with a 68Ge-Ga point radiation source with an activity of 3.7 MBq placed at the center of the FOV. Measurements were taken for 5 min. The timing resolution was found to be 6.8 ns (FWHM). This value was almost equivalent to that of conventional PET scanners; therefore, we set the time window at 14 ns, a value that is almost the same as that of the ECAT EXACT HR+ scanner (Asahi-Siemens) (13,14).
Physical performance characteristics, such as spatial resolution, sensitivity, and noise equivalent count rates, were measured with National Electrical Manufacturers Association (NEMA) standards. Table 1 summarizes the results of the evaluations. The transverse and axial resolutions near the center are 2.3 and 5.1 mm, respectively. The absolute sensitivity and the scatter fraction of the scanner evaluated with the NEMA NU 2-1994 phantom are 17.6 kcps/kBq/mL and 23%, respectively. These estimates are for a lower-energy threshold of 450 keV. The NEC2R value is 41 kcps at 3.7 kBq/mL (15).
Performance of New PET Scanner
Study of Phantoms
Three different phantom studies were performed.
To estimate PET image uniformity, a pool phantom filled with 18F at 74 kBq/mL was used. The acquisition time was set at 10 min for both scanners.
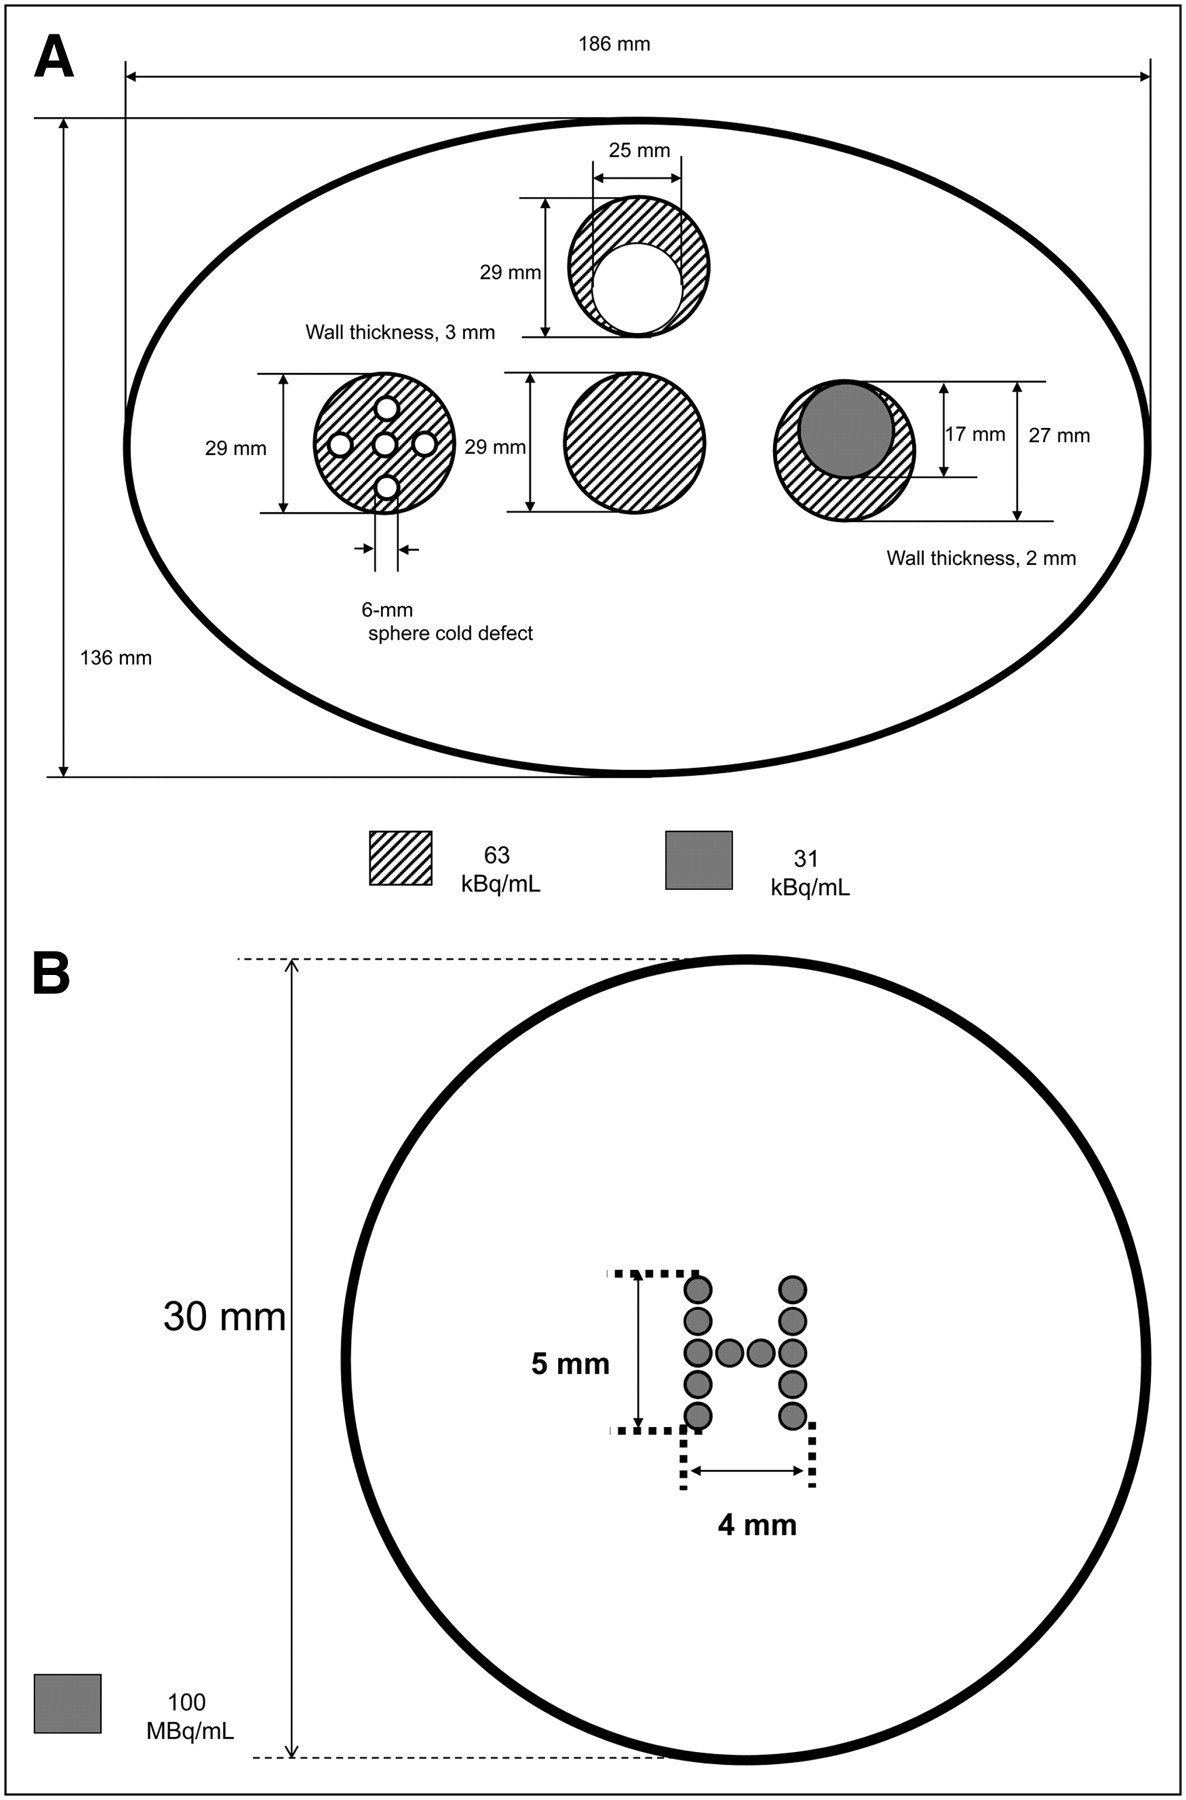
The second phantom, an elliptic phantom measuring 136 × 188 mm, consisted of 4 small compartments containing water. The first compartment was a uniform cylinder in the middle, the second compartment had a cylinder with five 6-mm-diameter cold spots, the third compartment had a cylinder with a 25-mm-diameter cold region, and the fourth compartment had a cylinder filled with half the radioactivity of the remaining compartments (Fig. 3A). All of the small compartments were filled with 18F at 63 kBq/mL. This tumor phantom was used to evaluate image contrast and inhomogeneity.

Scheme of second elliptic phantom (136 × 188 mm) consisting of 4 small compartments (A) and H-shaped hot phantom (B). First compartment had uniform cylinder in middle, second compartment had cylinder with five 6-mm-diameter cold spots, third compartment had cylinder with 25-mm-diameter cold region, and fourth compartment had cylinder filled with half the radioactivity in remaining compartments.
The third phantom was designed as a tumor phantom containing small hot spots. This “H”-shaped hot phantom was made of 1-mm-diameter capillary tubes filled with 18F at 198 MBq/mL. The H shape was 5 mm high and 4 mm wide. This phantom was surrounded with water (Fig. 3B).
Images of these phantoms were acquired with our semiconductor PET scanner and with a conventional high-resolution bismuth germanate PET scanner (EXACT HR+; Asahi-Siemens). Profile curves for the phantoms were determined from images obtained with both scanners for quantitative assessment of the cold-spot and hot-spot lesions by calculating the contrast between peak and valley activities. The energy windows of the semiconductor PET and HR+ PET scanners were 490–530 and 350–650 keV, respectively.
Study of Patients
We studied 10 patients with nasopharyngeal cancer before treatment or suspected of having a local recurrence. The characteristics of the patients are shown in Table 2. The patients gave written informed consent according to the Helsinki II Declaration, and this study was approved by the Ethics Committee of the Hokkaido University School of Medicine.
Characteristics of Patients
Before the PET study, all patients fasted for at least 6 h. Serum glucose levels were checked in all of the patients before the administration of 18F-FDG. The dose of 18F-FDG for each patient was 370 MBq. Images of the patients were acquired with the semiconductor PET and HR+ PET scanners. Two time courses were used in this study. In one time course, the protocol for image acquisition was as follows: HR+ PET in whole-body mode, HR+ PET in brain mode, and semiconductor PET. In the other time course, the protocol for image acquisition was as follows: semiconductor PET, HR+ PET in brain mode, and HR+ PET in whole-body mode (Fig. 4). The time course protocols were randomly selected.

Time course protocols. Order in time course protocol 1: HR+ PET in whole-body mode, HR+ PET in brain mode, and semiconductor PET; order in time course protocol 2: semiconductor PET, HR+ PET in brain mode, and HR+ PET in whole-body mode. I.V. = intravenously.
Tumor edge sharpness was evaluated with profile curves.
Two experienced nuclear physicians visually interpreted the images. In addition, intratumoral inhomogeneity was scored from 0 to 4, as expected from MRI or CT findings, as follows: 0, no uptake; 1, most homogeneous; 2, intermediate; and 3, most inhomogeneous. First, 2 nuclear physicians independently scored the images to determine interobserver variability. Then, these 2 physicians discussed their interpretations to determine a final score.
In addition, an MRI scan was obtained with a 1.5-T scanner (Magnetome Vision or Magnetome Symphony; Asahi-Siemens). Transaxial T1-weighted, T2-weighted, gadolinium-enhanced T1-weighted, and fluid-attenuated inversion recovery images were acquired. All images were acquired with a 5-mm slice thickness and no slice gap. Coronal and sagittal images were also acquired in some cases. The findings from 18F-FDG PET and MRI were compared.
HR+ PET in Whole-Body Mode
Whole-body static emission scanning was performed 60 min after 18F-FDG administration in the 3D acquisition mode for 3 min per bed position. The energy window was 350–650 keV. Thereafter, transmission scanning with externally rotating 68Ge rod sources was performed for attenuation correction. The acquired 3D sinograms were converted into 2-dimensional (2D) sinograms with the Fourier rebinning algorithm, and attenuation-corrected data were reconstructed iteratively by use of an ordered-subset expectation maximization algorithm with 32 subsets and 1 iteration.
HR+ PET in Brain Mode
Images were acquired with a 3-min transmission scan and a 10-min emission scan. Ten-minute regional static scanning with the nasopharynx centered was performed with the HR+ PET scanner in the 3D acquisition mode, and images were reconstructed with the brain mode of the manufacturer's software. The energy window was 350–650 keV. The acquired 3D sinograms were converted into 2D sinograms with the Fourier rebinning algorithm. The images were reconstructed by direct-inversion Fourier transformation. The reconstruction filter was a Hanning filter with 4-mm FHWM. The reconstruction matrix was 256 × 256, and the FOV was 33 cm in diameter. The FWHM was 6.4 mm after reconstruction.
Semiconductor PET
Images were acquired with a 3-min transmission scan and a 12-min emission scan. Twelve-minute emission scanning was performed in the 3D acquisition mode. Because of the high energy resolution, achieving a reduction in scatter noise required the energy window to be set at 490–530 keV (double FWHM of energy resolution). To compensate for the relatively low sensitivity derived from the narrow window setting and the low level of interaction of 511-keV γ-rays and CdTe materials, we developed a new reconstruction algorithm by application of the median root prior (MRP), known to be useful for edge preservation. In addition, for the recovery of resolution, a measured point spread function was convolved with images and the system matrix in the maximum a posteriori (MAP) iterative process. The effects of reducing noise and recovering resolution can be controlled by choosing the degree of prior contribution. The proposed reconstruction method improved image quality in terms of statistical noise and resolution. With the choice of a suitable degree of prior contribution, this method can improve the quality of images reconstructed from noisy or sparse data (16). The FWHM was about 2.5 mm at 1 cm or 2.9 mm at 10 cm in a transaxial slice.
Statistical Analysis
The means and SDs for intratumoral inhomogeneity values were calculated. The Wilcoxon matched-pair signed rank test was used to determine the significance of score differences between the 2 techniques. A P value of less than 0.05 was considered significant.
RESULTS
Study of Phantoms
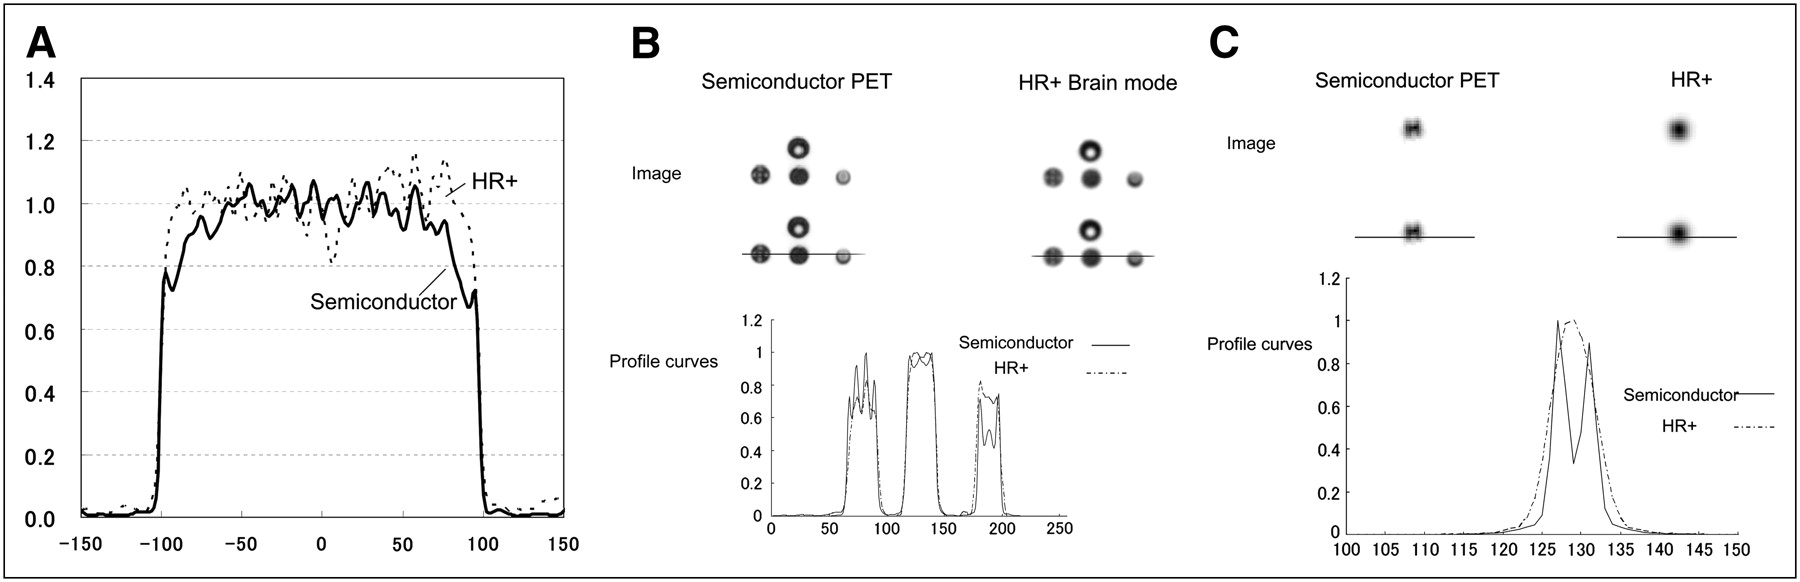
The profile curves showing the uniformity of phantom images obtained with the semiconductor PET and HR+ PET scanners are shown in Figure 5A. The uniformity of the reconstructed images was evaluated on the basis of the SD per average value in a cylindric region of interest (ROI). Cylindric ROIs were set at the center of the phantom. The diameter and height of the ROI were 180 and 120 mm, respectively. The uniformity of the images obtained with the HR+ PET scanner was 0.15, and that of the images obtained with the semiconductor PET scanner was 0.13. Thus, uniformity was well maintained, and the values were similar for both scanners.

Phantom images and profile curves obtained by semiconductor PET and HR+ PET. (A) Pool phantom. (B) Tumor phantom. (C) H-shaped hot phantom. Upper parts of B and C show PET images, middle parts show positions of profile curves, and lower parts show profile curves. Profile curves were normalized to maximum counts.
The images of the second phantom showed a 25-mm cold spot clearly for both the semiconductor PET and the HR+ PET scanners. However, the profile curves for the second phantom indicated better contrast for the 6-mm cold sphenoid phantom as well as the dual-cylinder phantom on images obtained with the semiconductor PET scanner. The contrast obtained with the semiconductor PET scanner (1.53) was 28% higher than that obtained with the HR+ scanner (1.20) for the 6-mm-diameter cold sphenoid phantom. The contrast obtained with the semiconductor PET scanner (1.43) was 27% higher than that obtained with the HR+ scanner (1.13) for the dual-cylinder phantom (Fig. 5B).
The 1-mm hot rods in the H-shaped hot phantom were detected only by semiconductor PET and not by HR+ PET. Similarly, the 2-mm cold region between small hot rods was also identified. The profile curves confirmed the detection of the small hot rods and the cold spot in between because of the increased contrast of the small structures revealed by semiconductor PET (Fig. 5C).
Study of Patients
For qualitative analysis, semiconductor PET identified intratumoral inhomogeneous glucose metabolism in more detail than HR+ PET in 8 of 10 patients (Table 3). In all 6 of these patients, intratumoral inhomogeneity or small structures in the tumor were confirmed by MRI.
The profile curves were sharper for semiconductor PET than for HR+ PET in both the brain mode and the whole-body mode for all images from the 8 patients who showed abnormal uptake (Figs. 6 and 7).

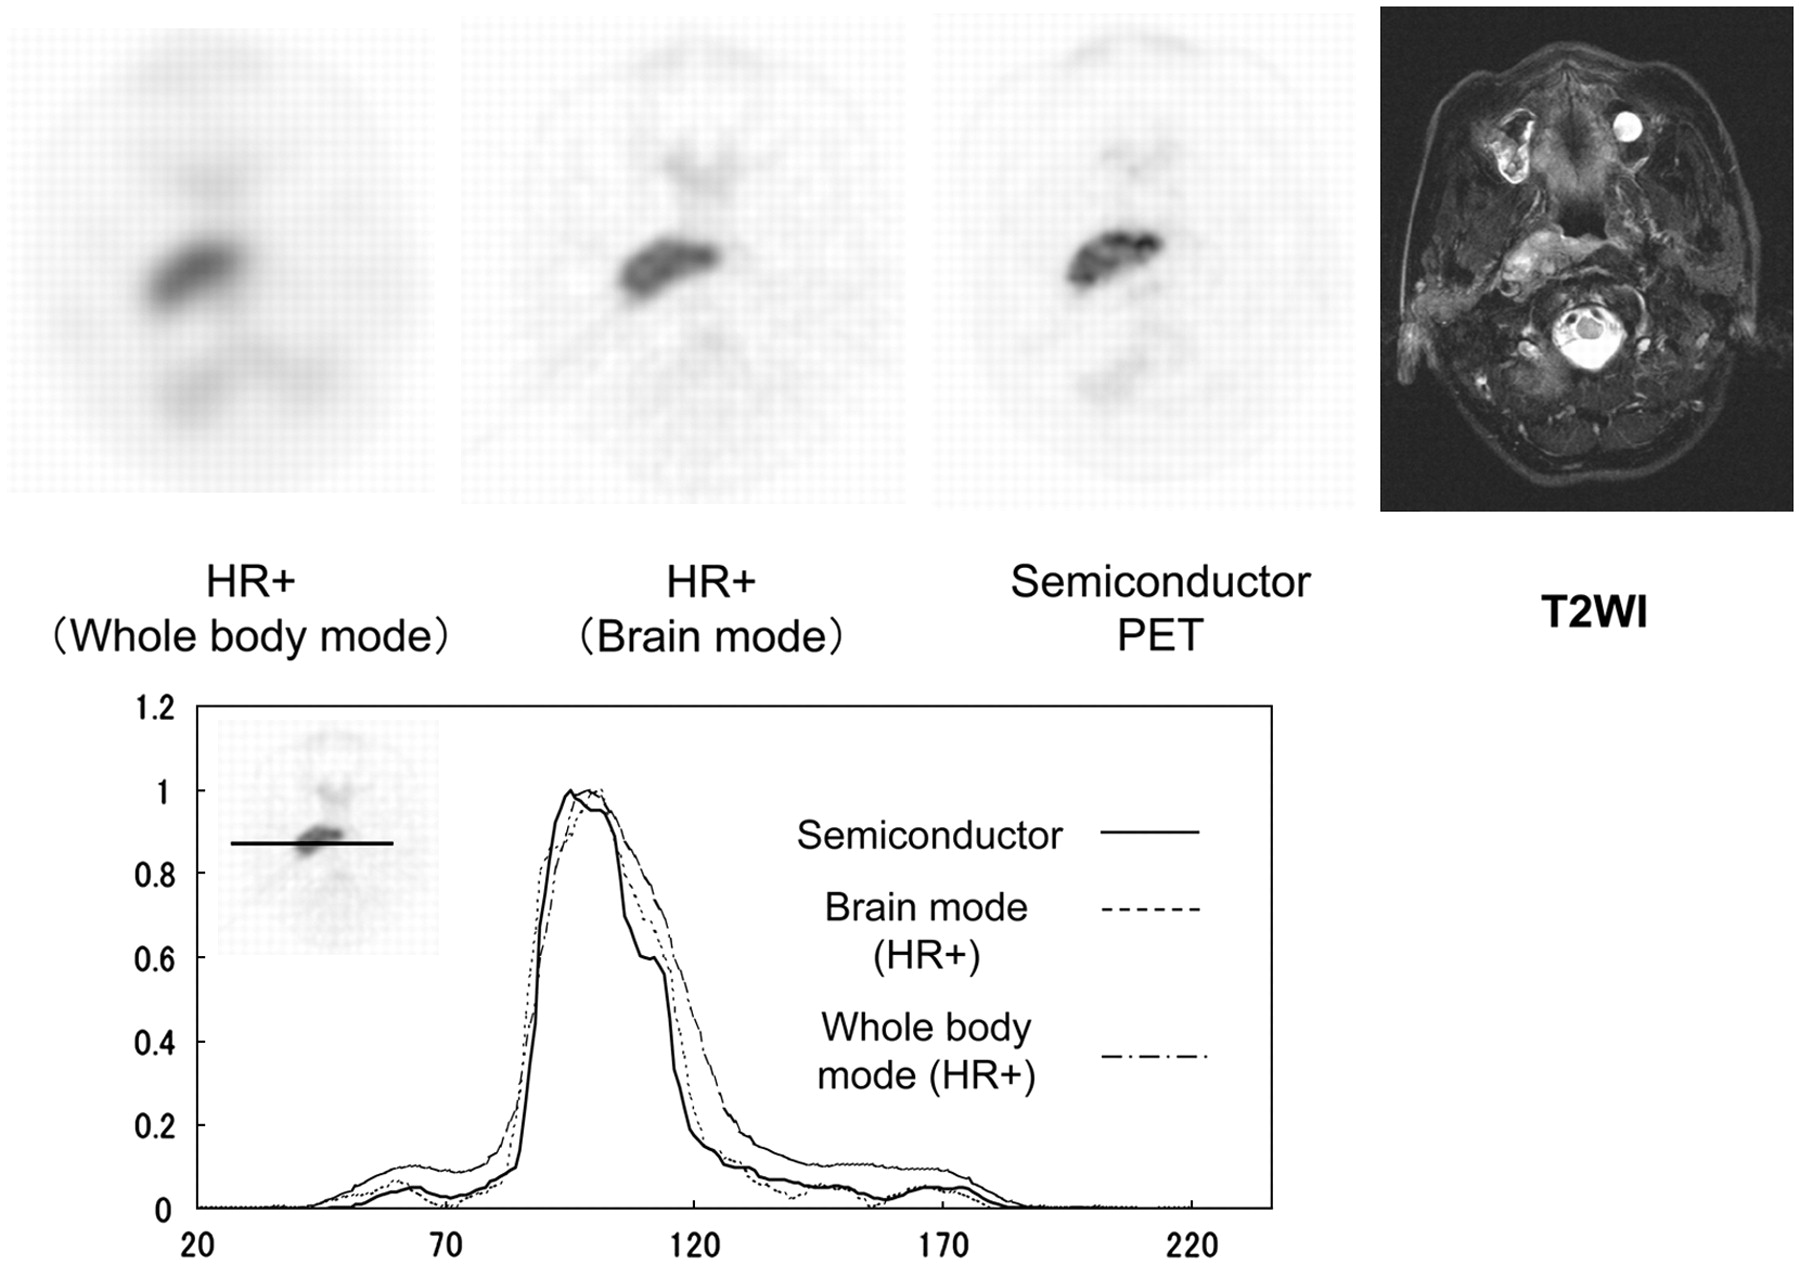
Whole-body mode (left) and brain mode (middle) scintillator-based PET images and semiconductor PET image (right) of 61-y-old man with nasopharyngeal squamous cell cancer. Semiconductor PET identified intratumoral inhomogeneous glucose metabolism in more detail than HR+ PET. T2-weighted MRI (T2WI) also revealed inhomogeneous intensity in primary lesion (far right). Diagrams show profile curves. Profile curves were normalized to maximum counts. Profile curve for tumor obtained by semiconductor PET was sharpest among 3 images.

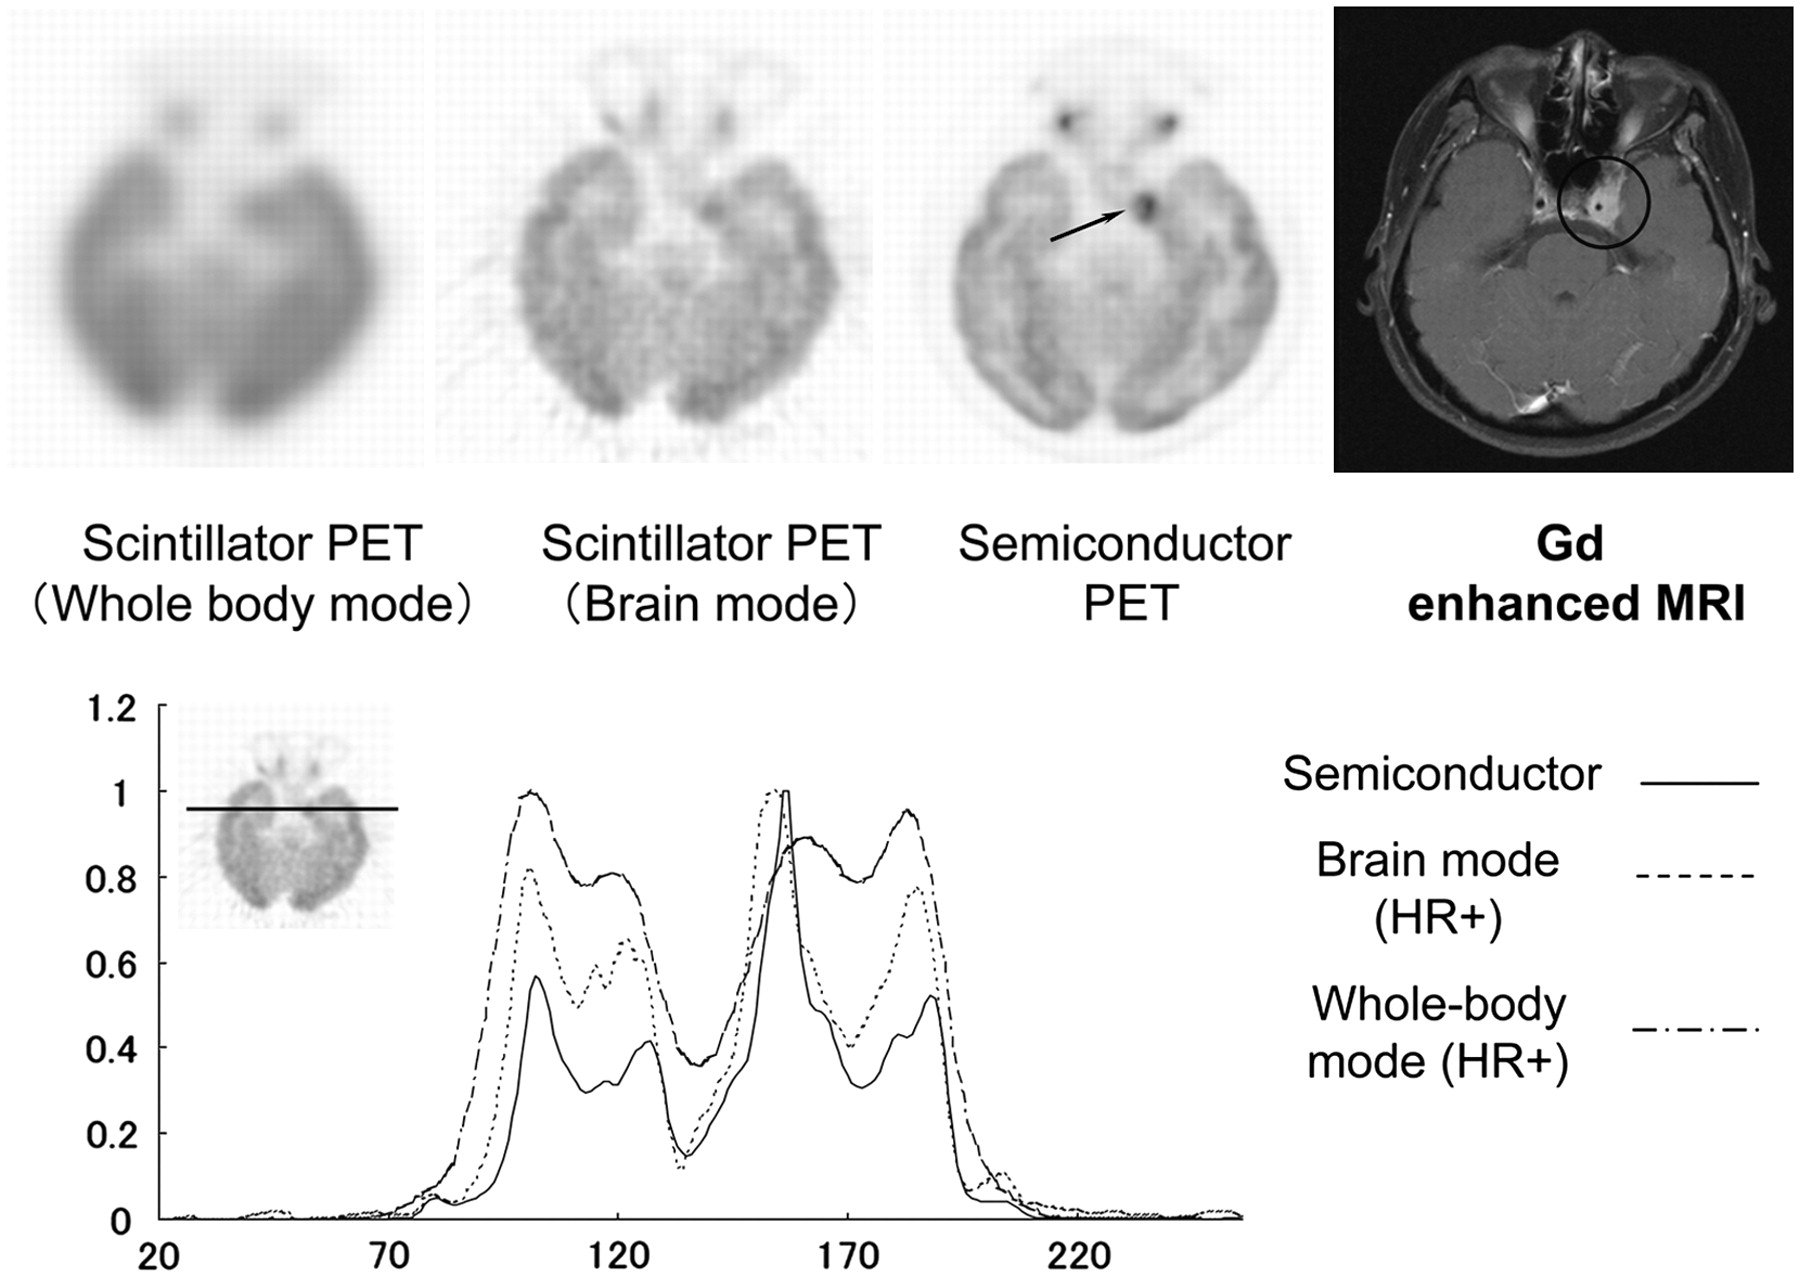
Whole-body mode (left) and brain mode (middle) scintillator-based PET images and semiconductor PET image (right) of 35-y-old woman with nasopharyngeal squamous cell cancer. Semiconductor PET revealed low uptake in tumor, which corresponded to internal carotid artery (arrow). Gadolinium-enhanced MRI showed that left internal carotid artery penetrated tumor (far right). Diagrams show profile curves. Profile curves were normalized to maximum counts. Profile curve of tumor obtained by semiconductor PET was sharpest among 3 images.
Interobserver agreement on the inhomogeneity scores was 100%. The scores for inhomogeneity were higher in the brain mode than in the whole-body mode; however, those for semiconductor PET were significantly higher than those for HR+ PET in the brain mode (P < 0.01) (Table 3).
Intratumoral Inhomogeneity
The results for representative patients are shown in Figures 6 and 7. Figure 6 shows the results for a 61-y-old man with nasopharyngeal squamous cell cancer. Semiconductor PET identified intratumoral inhomogeneous glucose metabolism in more detail than HR+ PET. T2-weighted MRI also showed inhomogeneous signal intensity in the primary lesion. The profile curve obtained for the tumor with semiconductor PET was the sharpest among the 3 images shown.
Figure 7 shows the results for a 35-y-old woman with nasopharyngeal squamous cell cancer. The tumor reached the left cavernous sinus in this patient. Semiconductor PET revealed an area of low uptake in the tumor that corresponded to the internal carotid artery. Gadolinium-enhanced MRI showed that the left internal carotid artery penetrated the tumor. The profile curve obtained for the tumor with semiconductor PET was sharper than those obtained with HR+ PET in the brain mode and the whole-body mode.
DISCUSSION
This is the first clinical report of the application of semiconductor PET. Because this PET scanner provides high spatial resolution and low scatter noise, it has the potential for better delineation of intratumoral inhomogeneity in studies of nasopharyngeal cancer. The phantom study confirmed higher contrast obtained for small cold and hot spots with semiconductor PET, with uniformity similar to that obtained with conventional (HR+) PET. In the study of our specially designed H-shaped hot-rod phantom, a 2-mm defect between 1-mm hot rods was identified by semiconductor PET. In a clinical setting, intratumoral inhomogeneity and edge sharpness were better delineated by semiconductor PET than by HR+ PET. This better delineation of intratumoral inhomogeneity is considered to be attributable to the higher spatial resolution and lower scatter noise of our semiconductor PET scanner and not to higher statistical noise.
A semiconductor detector should have 2 significant advantages when it is used as a PET detector. The first advantage is energy resolution. The photopeak of a semiconductor detector is generally sharper than that of a scintillation detector (4). Our new semiconductor PET detectors had an energy resolution of only 4.1% (FWHM), and our CdTe detectors had almost the same timing resolution (6.8 ns [FWHM]) as scintillator-based PET detectors (15,17). The limited energy window set permits the collection of true signal counts with lower noise counts. Therefore, our PET scanner with semiconductor detectors provides high contrast with less scatter noise. As shown in Table 1, the scatter fraction was 23%, which was lower than those of other, scintillation-based PET scanners (14).
The second advantage is superior individual readout. With a semiconductor detector, it is easy to fabricate densely packed detectors that are composed of a large number of small crystal arrays and their amplifiers. Thus, one detector is connected to one amplifier individually. The semiconductor provides a digital signal for each position (18). That is, a separate detector corresponds to each line of response at each position. Consequently, the intrinsic spatial resolution of a semiconductor detector unit is higher than that of a traditional PET detector unit with a positional computer (19). A DOI detection system, which has been used in some scintillator-based PET scanners, may reduce parallax errors at the periphery of the FOV in PET scanners dedicated to human brain imaging (4,5). A DOI system and our small detectors were applied to our PET scanner to obtain a higher spatial resolution. In fact, the intrinsic spatial resolution of our PET scanner was 2.3 mm at 1 cm or 4.8 mm at 10 cm. This spatial resolution was higher than that of a conventional PET camera and almost same as that of EXACT HRRT (Siemens Medical Solutions) in a transaxial slice (14,20). Our PET scanner with semiconductor detectors and the DOI system has a high spatial resolution and low scatter noise.
Various components, including nonmalignant components, are involved in most solid tumors (21–28). Various properties of tumor tissues also show intratumoral heterogeneity, which may originate from the diverse phenotypic properties of tumor cells or may be induced by their metabolic microenvironment. In this regard, intratumoral heterogeneity assessed by 18F-FDG distribution has been well demonstrated by autoradiography (23–28). Intratumoral 18F-FDG distribution has been described at the cellular level by several investigators. Using a malignant tumor mouse model, Kubota et al. showed that 18F-FDG preferentially accumulates in macrophages and young granulation tissues surrounding necrotic foci rather than in tumor cells (25). In contrast, Brown et al. observed relatively less 3H-FDG accumulation in necrotic or inflammatory infiltrates than in tumor cells (26). Semiconductor PET with the DOI system may reveal intratumoral heterogeneity even in a clinical setting.
One of the major limitations of semiconductor PET is the relatively low sensitivity of the semiconductor detector. Low sensitivity is mainly attributable to a narrow energy window setting (490–530 keV) and a low interaction of 511-keV γ-rays and CdTe materials. To increase the system sensitivity, we used 6-layer detectors in a 3-layer DOI system. In addition, we introduced a new reconstruction algorithm based on MRP and the MAP iterative process. The proposed reconstruction method improved image quality with a high spatial resolution and low statistical noise (16). One may argue that the results for inhomogeneity were attributable to high statistical noise. The uniformity phantom study confirmed that uniformity was well maintained and that uniformity values were similar between semiconductor PET and conventional PET.
It is rather difficult to assess intratumoral inhomogeneity. We applied a 4-point scoring system for objective assessment. Our scoring system showed good interobserver agreement. In addition, our scoring system indicated better identification of intratumoral inhomogeneity by semiconductor PET than by conventional PET. Furthermore, the results for 2 representative patients confirmed the better delineation of intratumoral inhomogeneity corresponding to MRI findings.
Another limitation is that we did not compare our new PET system with a state-of-the-art PET system but rather compared it with a relatively old camera, the HR+ system, with standard ordered-subset expectation maximization and direct-inversion Fourier transformation reconstruction. However, the HR+ system provides relatively high-resolution PET images with the current reconstruction algorithm. We consider it necessary to compare a state-of-the-art lutetium oxyorthosilicate PET scanner with our new PET scanner in the future.
Furthermore, the current brain-dedicated PET camera is a relatively small-aperture instrument. We performed tumor imaging in patients with nasopharyngeal cancer. However, a whole-body scanner is required for most oncologic studies, particularly for assessment of tumor inhomogeneity. We are now planning to develop the next prototype PET camera, with a wide aperture and high sensitivity.
If a whole-body scanner with semiconductor detectors is developed, then application to radiation therapy is expected. Several studies have shown the impact of 18F-FDG PET on radiation treatment volumes (8–11). Using a PET scanner with semiconductor detectors and the DOI system, we may be able to perform precise radiation planning to accurately deliver high-dose radiation to lesions with high tumor cell activity.
CONCLUSION
The phantom and clinical studies suggested that the semiconductor PET scanner has the potential for better identification of intratumoral inhomogeneity because of its higher spatial resolution and lower scatter noise.
Footnotes
-
COPYRIGHT © 2009 by the Society of Nuclear Medicine, Inc.
References
- Received for publication June 2, 2008.
- Accepted for publication September 8, 2008.


