


Abstract
Increased cellular proliferation is an integral part of the cancer phenotype. Several in vitro assays have been developed to measure the rate of tumor growth, but these require biopsies, which are particularly difficult to obtain over time and in different areas of the body in patients with multiple metastatic lesions. Most of the effort to develop imaging methods to noninvasively measure the rate of tumor cell proliferation has focused on the use of PET in conjunction with tracers for the thymidine salvage pathway of DNA synthesis, because thymidine contains the only pyrimidine or purine base that is unique to DNA. Imaging with 11C-thymidine has been tested for detecting tumors and tracking their response to therapy in animals and patients. Its major limitations are the short half-life of 11C and the rapid catabolism of thymidine after injection. These limitations led to the development of analogs that are resistant to degradation and can be labeled with radionuclides more conducive to routine clinical use, such as 18F. At this point, the thymidine analogs that have been studied the most are 3′-deoxy-3′-fluorothymidine (FLT) and 1-(2′-deoxy-2′-fluoro-1-β-d-arabinofuranosyl)-thymine (FMAU). Both are resistant to degradation and track the DNA synthesis pathway. FLT is phosphorylated by thymidine kinase 1, thus being retained in proliferating cells. It is incorporated by the normal proliferating marrow and is glucuronidated in the liver. FMAU can be incorporated into DNA after phosphorylation but shows less marrow uptake. It shows high uptake in the normal heart, kidneys, and liver, in part because of the role of mitochondrial thymidine kinase 2. Early clinical data for 18F-FLT demonstrated that its uptake correlates well with in vitro measures of proliferation. Although 18F-FLT can be used to detect tumors, its tumor-to-normal tissue contrast is generally lower than that of 18F-FDG in most cancers outside the brain. The most promising use for thymidine and its analogs is in monitoring tumor treatment response, as demonstrated in animal studies and pilot human trials. Further work is needed to determine the optimal tracer(s) and timing of imaging after treatment.
Uncontrolled cell proliferation is the primary hallmark of cancer. The rate of cell division is an important prognostic characteristic of malignancies, and some important anticancer treatments are aimed specifically at inhibiting tumor cell growth. The ability to assess cell proliferation in tissue samples was first developed in the 1950s and remains central to the pathologic characterization of tumors. In vitro assays have limited utility, however, for nonresectable or disseminated cancers. The ability to measure tumor cell proliferation by noninvasive imaging could improve the diagnosis, grading, and staging of cancer. More important, perhaps, is the possibility that such imaging could be used to predict the treatment response in individual patients soon after the initiation of antitumor therapy, as illustrated in Figure 1 (1).

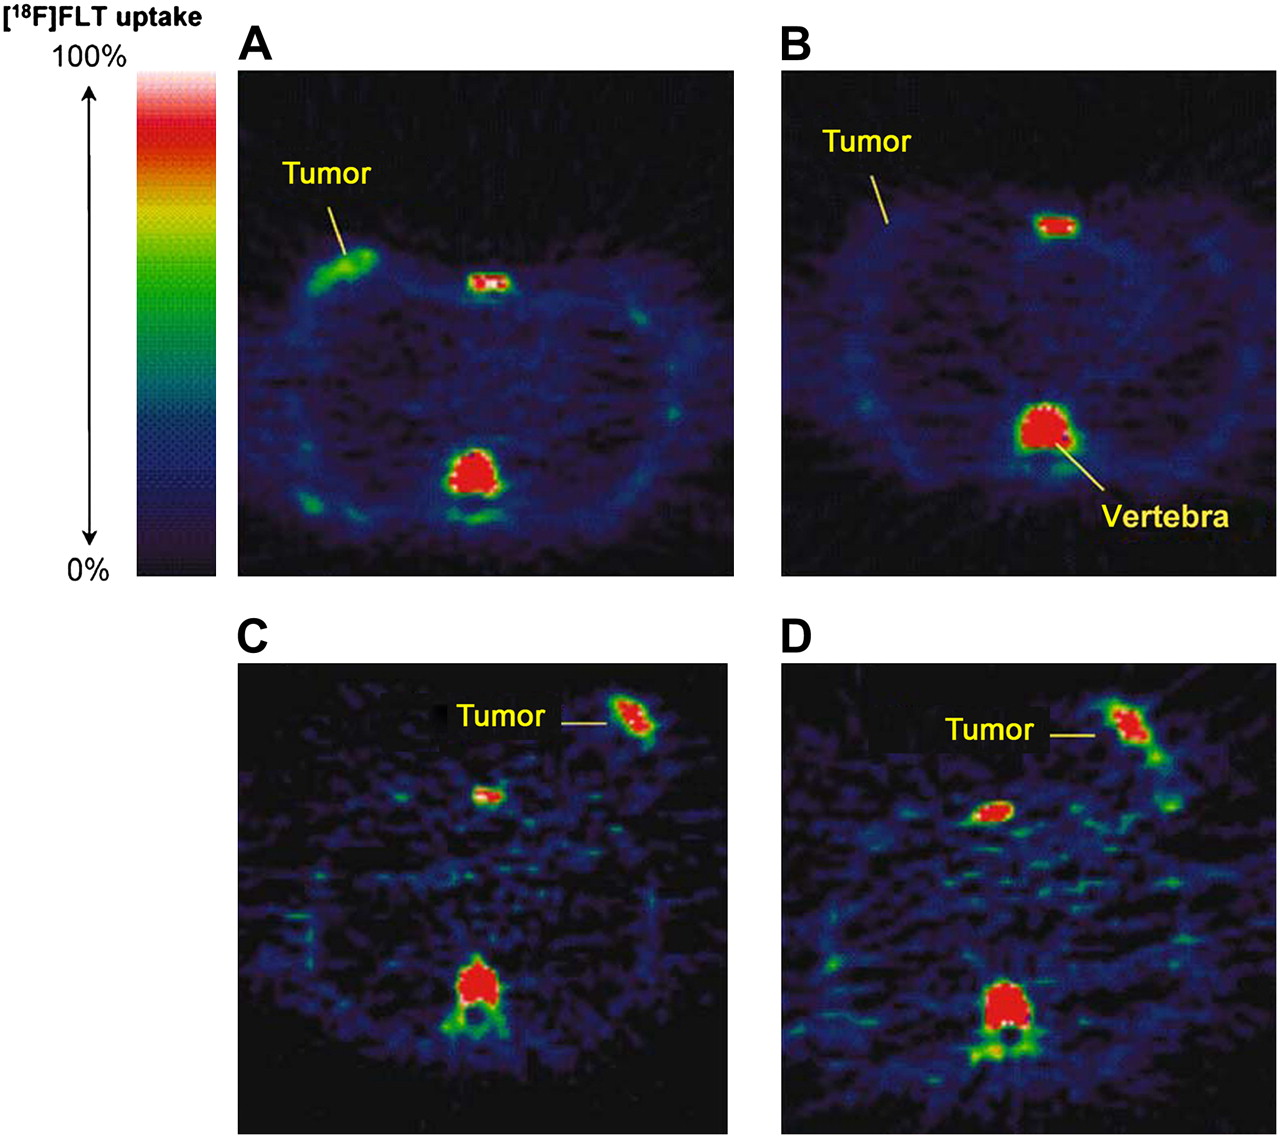
18F-FLT PET images in responding and nonresponding patients 1 wk after administration of combination chemotherapy. Pretreatment (A) and posttreatment (B) transaxial images of patient with grade II lobular breast cancer that responded to treatment. Pretreatment (C) and posttreatment (D) transaxial images of patient with grade II invasive ductal breast cancer that did not respond to treatment. (Reprinted with permission of (1).)
Cell proliferation imaging has long been a goal of nuclear medicine research, and most of the effort has focused on radiotracers of DNA synthesis. In vivo assessments of cell proliferation in humans were performed as early as 1960 with [3H-methyl]thymidine ([3H-methyl]TdR) (2). The synthesis of [11C-methyl]thymidine ([11C-methyl]TdR) for in vivo imaging was first reported in 1972 (3). Although a great deal of research has been performed in the intervening years and some very promising PET radiotracers are now available, an effective and clinically practical means for the imaging of cell proliferation is still an unrealized objective.
The literature contains several reviews of cell proliferation imaging. The present article includes a concise summary of the material covered in 2 of those reviews, which focused mainly on PET radiotracers for the salvage pathway of DNA synthesis (4,5). We provide an update on recent research with those tracers as well as a brief review of alternative methods for the imaging of tumor cell proliferation in vivo. We also summarize methods for evaluating cell division in tissue samples (the gold standards against which in vivo imaging methods must be validated); outline the potential clinical uses of cell proliferation imaging for the detection, grading, and staging of cancer; offer some considerations regarding the use of cell proliferation imaging to assess responses to anticancer therapies; and offer recommendations on scan acquisition and interpretation methods for 18F-labeled 3′-deoxy-3′-fluorothymidine (18F-FLT), currently the most widely used radiotracer for tumor cell proliferation. Finally, we offer our view of the current status of cell proliferation imaging and list what we consider to be the most important questions yet to be answered.
IN VITRO ASSAYS OF CELL PROLIFERATION
Good reviews of this topic can be found in articles by Colozza et al. (6) and van Diest et al. (7). Cells exist either in the resting (G0) or active phase. With appropriate stimuli, cells move from G0 to the first gap (G1) phase, where they prepare for the synthesis (S) phase, in which nuclear DNA is synthesized and the genome is doubled. Next comes a delay (second gap [G2] phase) and then the mitotic (M) phase, in which the DNA separates into chromatids and the cell divides. Daughter cells can proceed into either the resting (G0) or the active (G1) phase. The longest portion of the active cycle, called the interphase, comprises the G1, S, and G2 phases.
One of the first methods used to evaluate proliferative activity was the so-called incorporation method, which initially used [3H-methyl]TdR or, less frequently, [14C-methyl]thymidine. The radiotracers either were injected in vivo before tumor biopsy or were applied directly to fresh tumor samples, and the assay was performed by thin-section autoradiography. Quantitation of cell division was performed by counting the fraction of tumor cells containing bound radioactivity (thymidine labeling index). The technique was later adapted to a nonradioactive format based on the development of an immunohistochemistry (IHC) detection method for the TdR analog bromodeoxyuridine.
Thymidine monophosphate (TMP), an essential precursor of DNA synthesis, is produced either by de novo synthesis from deoxyuridine monophosphate (dUMP) or from exogenous TdR (thymidine salvage pathway). The incorporation method measures the fraction of tumor cells in the S phase that has at least some salvage pathway use. Numerous studies have shown this method to have very good prognostic value for various cancers, and it is still considered to be the gold standard for characterizing cell proliferation. However, the method is relatively demanding for patients and staff and therefore is impractical for routine clinical use.
A second class of methods uses direct observation of cellular DNA in tissue sections or cell suspensions prepared from fresh samples or paraffin-embedded specimens. Mitosis counting is performed by light microscopy to determine the fraction of tumor cells in mitosis; when this method is performed carefully according to a well-defined protocol, the results obtained have good prognostic value. Flow cytometry is frequently used to measure the nuclear DNA content of cells, thus providing an assessment of the fraction of cells in the S phase or mitosis.
The activity of thymidine kinase (TK), the enzyme family that catalyzes the phosphorylation of TdR to thymidylate (TMP), is directly related to the DNA synthesis rate. TK activity (normalized to total protein content) is measured by incubating 3H-TdR in cytosol extracted from tissue samples. This method pertains specifically to the salvage pathway and is the method most directly related to TdR imaging.
In the early 1980s, a human protein (Ki-67) that is expressed only in the nuclei of cells that are actively dividing, that is, cells that are not in the G0 phase, was discovered (8). A high-quality antibody (MIB-1) against Ki-67 was developed, and because of the relative simplicity and reliability of IHC, the Ki-67/MIB-1 assay subsequently became the most widely used method for assessing cell growth. Studies showed that it has prognostic value approaching that of the incorporation method. Note that the Ki-67 assay measures the cell fraction that is in the active cell cycle, which at any moment is, in principle, larger than the cell fraction that is engaged in DNA synthesis or mitosis. The Ki-67 assay is related to total cellular proliferation regardless of pathway.
Other, newer categories of cell proliferation assays include markers related to cell cycle control (cyclins E and D1; Cdk inhibitors p27 and p21WAF1/CIP1) and topoisomerase IIα, a nuclear DNA–binding enzyme that controls and modifies the topologic states of DNA. Like Ki-67, these proteins are assayed by modern methods of IHC or quantitative reverse transcription–polymerase chain reaction.
Most studies correlating the in vivo imaging of TdR or its analogs with ex vivo measurements of cell proliferation have used the Ki-67 assay. This is appropriate, because the objective is to determine to what extent such imaging, which examines only the salvage pathway of DNA synthesis, is indicative of overall tumor cell division, for which Ki-67 is an accurate indicator.
METHODS FOR IN VIVO IMAGING OF CELL PROLIFERATION
Radiotracer Methods
In terms of duration and magnitude of effort, as well as current success, the PET field has dominated research in cell proliferation imaging. The development of [14C-methyl]thymidine for the DNA synthesis assay and the increasing interest in medical applications of cyclotron technology through the 1960s led naturally to procedures for making [11C-methyl]TdR, with a 20-min half-life (3,9). With the subsequent development of PET, quantitative in vivo measurement of DNA synthesis rates in tumors and other tissues has become a reality, at least within the context of medical imaging research. The rationale, methodologic improvements, and practical limitations of TdR PET as well as those of other methods for cell proliferation imaging are summarized here.
Radiotracers Indirectly Related to Cell Proliferation.
Much of radiotracer imaging in oncology is based on the accelerated intermediary metabolism (such as energy production, protein synthesis, and phospholipid synthesis) needed to support tumor growth (10). Several radiotracers for the substrates used in these processes have been developed; among them is 18F-FDG, the mainstay of clinical PET. Because of the general tendency of intermediary metabolism to track cell growth, the accumulation in tumors, or at least the one-way flux from blood into tumors, of these radiotracers may be positively correlated with tumor cell proliferation. However, the relationships are indirect, and changes in tumor intermediary metabolism are likely to lag behind the events (e.g., cell cycle arrest) directly involved in modulating cell proliferation. Some studies comparing tumor 18F-FDG uptake or use with in vitro cell proliferation assays have revealed strong positive correlations (11,12); however, in most cases, the relationships have been negative or relatively weak (11,13–16). Rather than a marker for tumor cell proliferation, 18F-FDG is generally considered to be indicative of viable cell density (15–18).
Some studies have shown correlations of the tumor uptake of radiotracers of amino acid and phospholipid metabolism with cell proliferation. Among the various amino acids that have been used for imaging in humans, 2 short-lived PET tracers, l-[11C-methyl]methionine and l-[1-11C]tyrosine, have been studied the most (10). [11C-methyl]MET uptake was found to correlate positively with tumor cell proliferation in carcinomas of the brain and lungs (19–21) but did not correlate with tumor histologic grade in head and neck carcinomas or non-Hodgkin's lymphoma (22,23). Studies with l-[1-11C]tyrosine in human brain tumors failed to show a correlation with cell proliferation (24). Various amino acids have also been labeled with longer-lived radionuclides. For example, the uptake of 123I-iodo-α-methyltyrosine was found in a study of 32 patients with soft-tissue sarcomas to correlate moderately well (r = 0.6–0.7) with the mitotic index, the Ki-67 proliferative index, and tumor cellularity (25).
Several studies have revealed positive correlations between the uptake of radiolabeled tracers of phospholipid metabolism (choline and acetate) and the proliferation of cultured tumor cells (16,26–28), but verification in vivo is currently lacking. One PET study of 18 patients with prostate cancer revealed no significant correlation between the tumor uptake of 11C-choline and Ki-67 staining (29).
Radiotracers Directly Related to Cell Proliferation.
The replication of nuclear DNA is the central process required for cell division. Of the 4 nucleosides required for DNA synthesis, thymidine is the only one that is not also incorporated into RNA. Thymidine nucleotides are derived either through the methylation of dUMP in a reaction catalyzed by thymidylate synthase (TS) or through the phosphorylation of exogenous TdR. These 2 routes, known, respectively, as the de novo and salvage pathways of DNA synthesis, are diagrammed in Figure 2. The de novo pathway is not a viable alternative for monitoring DNA synthesis because the relevant precursors (deoxyuridine, uridine, and uracil) are routed into both DNA and RNA. (Like other nucleotides, dUMP, the direct precursor for TS, cannot enter cells from the outside.) Thus, efforts to measure DNA synthesis have focused on tracers for the thymidine salvage pathway.

DNA synthesis pathways. Enzymes are shown in italic type. Crooked arrow indicates feedback control of TK1 expression by TTP. Intermediate catabolite species are not labeled. β-AIB = β-aminoisobutyric acid; DP = DNA polymerase; TDP = thymidine diphosphate; TP = thymidine phosphorylase.
The synthesis of nuclear DNA occurs in the cytosol. It is important to note that DNA synthesis also occurs in the mitochondria. Different isoenzymes of TK, known as TK1 and TK2, catalyze the phosphorylation of TdR to TMP in the cytosol and the mitochondria, respectively (Fig. 2). TK1 expression is closely regulated in coordination with that of other key enzymes of DNA synthesis (e.g., TS and DNA polymerase) during the cell cycle. The concentrations of TK1 increase as much as 10- to 20-fold beginning at the G1-phase/S-phase transition, continue at high levels throughout the S, G2, and M phases, and then decline rapidly as the enzyme is destroyed at the onset of the G0 or G1 phase (30,31). TK2, on the other hand, is constitutively expressed, and its activity is not regulated in conjunction with the cell cycle (32).
The development of PET and the earlier success of the ex vivo TdR assay for DNA synthesis led to the development of [11C-methyl]TdR in the 1970s. It became known that the accurate interpretation of TdR PET images requires arterial blood sampling and metabolite analysis as well as kinetic modeling, making this approach impractical for routine clinical use. Investigators have also synthesized several TdR analogs, some of which are designed to resist catabolism. The chemical structures and radiolabeling positions of TdR, the thymine base, and the analogs that have received the most study are shown in Figure 3.

Chemical structures of TdR, thymine, and analogs. *Radiolabeling positions. BUdR = bromodeoxyuridine; FUdR = fluorodeoxyuridine; IUdR = iododeoxyuridine.
The most thoroughly developed methodology for the image-based measurement of cell proliferation uses 11C-TdR in conjunction with quantitative, dynamic PET. The history of that development as well as the scientific and technical considerations underlying the methodology were thoroughly reviewed by Mankoff et al. (4) and Wells et al. (5). We present only a brief summary here. The synthesis of [11C-methyl]TdR was first reported in 1972 (3). Animal studies in the late 1970s and early 1980s revealed good uptake and retention of the radiolabel in tumors as well as organs with rapid cell turnover (33–35). Concern that the rapid disappearance of [11C-methyl]TdR from the circulation after intravenous injection might indicate that the distribution of the radiotracer simply reflected perfusion was alleviated in a study by Shields et al., who compared the tumor uptake of [3H-methyl]TdR with blood flow in mice and dogs (35). By 1 min, the correlation between uptake and flow disappeared, indicating that some mechanism (e.g., metabolism) other than blood flow was responsible for [11C-methyl]TdR retention in tissues. Subsequent pilot studies in humans, however, showed that 11C-methyl-labeled catabolites dominated the circulating activity within minutes after injection and that these acidic compounds accumulated in tumors and various nontumor tissues (36–38). On the basis of the hypothesis that radiolabel lost to catabolites would be rapidly removed from the body as the endpoint catabolite 11C-CO2, rapid procedures for synthesizing ring-labeled 2-11C-TdR were developed (39,40). However, it was found that because CO2 is diluted in the body's large bicarbonate pool, 11C-CO2 and H-11C-CO3− comprise a relatively large percentage of the total activity in blood and other tissues for more than 1 h after the injection of 2-11C-TdR (41,42). Although 2-11C-TdR did provide some improvement over [11C-methyl]TdR with regard to the percentage of activity in the DNA synthesis pathway and the uniformity of the catabolite background (42,43), it was still necessary to account for labeled breakdown products to reliably interpret PET images.
In the 1990s and early 2000s, validation studies were presented for a multicompartment model of 2-11C-TdR in somatic and brain tumors that can be used to estimate TdR flux (i.e., one-way net clearance) from blood into DNA (44–46). Key assumptions and approximations underlying the use of the model (Fig. 4) to describe PET-derived time–activity curves for 2-11C-TdR include the following. First, parenchymal cell membranes do not present a significant barrier to the movement of TdR, implying that radiotracer in the interstitial tissue space mixes freely with that in the intracellular space. This assumption is based on the fact that nucleoside transport is dominated by rapid, facilitated diffusion (47). Second, TdR and TMP, thymidine diphosphate, and thymidine triphosphate (TTP) nucleotides within tumors can be treated as a single compartment; that is, their interconversion is rapid compared with the rates at which TdR reenters the circulation and TTP is incorporated into DNA (48). Third, the incorporation of 11C-TTP into DNA is rate limiting; that is, once the radiolabel enters DNA, it is effectively trapped there during the time scale of the PET experiment (≤1 h). This assumption is certainly well founded (48). Fourth, non-CO2 catabolites within tumors can be treated as a single compartment. This simplification is justified on the basis of the fact that such catabolites contribute only a small percentage of the total activity in tumors after the injection of 2-11C-TdR and thus have relatively little effect on the estimation of the other parameters in the model. Fifth, non-CO2 catabolites are not trapped within tumors, an approximation based on the authors' (44–46) own observations. Sixth, the transport of labeled CO2/HCO3− is reversible, and some 11C-CO2/HCO3− may be incorporated into molecular species that are effectively trapped in tumors during the PET experiment. Both assumptions are supported by empiric observations (49,50). Seventh, the TdR, catabolite, and CO2 compartment sets are independent (i.e., not coupled) and are driven by 3 separate blood time–activity input functions, each of which is measured by blood sampling and metabolite analysis. This treatment assumes that labeled TdR catabolites within tumors originate predominantly from the circulation instead of being formed internally and that catabolites are not reutilized for DNA synthesis. The authors (44–46) based these assumptions on published information (48), their own observations, and simulations showing that parameter estimation for the TdR component of the model is relatively insensitive to moderate amounts of intratumoral catabolism of 2-11C-TdR.
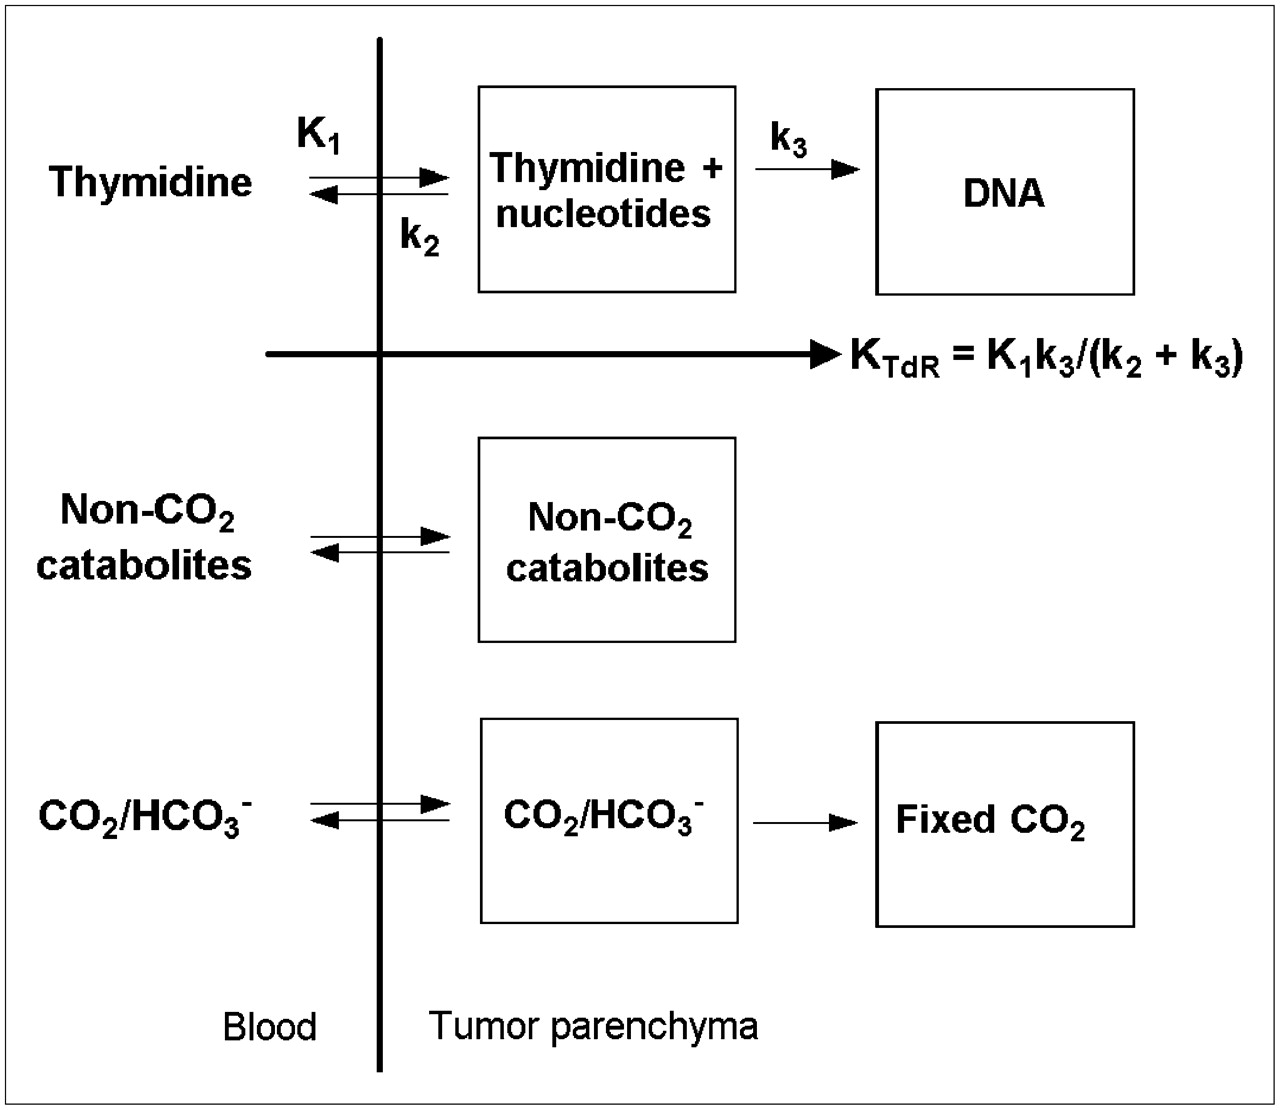
Compartmental model for 2-11C-TdR kinetics in blood and tumor tissue. TdR flux constant KTdR (units of mL/min/g of tissue) represents TdR clearance from blood to DNA.
Calculation of the DNA synthesis rate requires combining the model with a measurement of the TdR concentration in blood (TdRblood) as well as some additional assumptions. Parameters of the TdR component of the model permit the calculation of one-way clearance of TdR from blood into DNA. The equation for this “flux constant” (KTdR) is shown in Figure 4. The product [(s + dn)/s] × TdRblood (μmol/mL) × KTdR (mL/min/g) yields total TdR flux into DNA in units of μmol/min/g of tissue. The factor (s + dn)/s is the ratio of total TdR flux into DNA (salvage + de novo pathways) to salvage pathway flux. Assumptions underlying the conversion of KTdR to TdR flux (which is directly proportional to the DNA synthesis rate (48)) include the following. First, the concentration of native TdR in the tumor interstitial space is approximately the same as that in the blood. This assumption is probably justified for somatic tumors, in which small molecules are exchanged freely across capillary walls, but may not be valid in brain tumors that conserve a portion of the blood–brain barrier (BBB). Second, the amount of TMP synthesis via the salvage pathway relative to that via the de novo pathway is predictable. An extensive study by Shields et al. showed that, independently of cell type and species, the 2 pathways tend to contribute similarly, depending on the external concentration of TdR (51). It should be noted, however, that the effects of antitumor treatment on the ratio of the salvage pathway to the de novo pathway were not examined; therefore, extrapolation of salvage pathway flux to total TdR flux may not be valid during therapy, especially when that therapy is specifically intended to suppress the de novo pathway.
An alternative approach to the analysis of 11C-TdR PET studies has been developed by Gunn et al. (52). Rather than a compartmental model, their method uses spectral analysis, with or without a second scan after the intravenous injection of 11C-HCO3−, to obtain separate estimates of the 11C-CO2/HCO3−, intravascular 11C-TdR, and parenchymal 11C-TdR components of the tumor time–activity curves. Like the compartmental model approach, this method requires determination of the arterial time–activity curves for 11C-TdR and catabolites. However, unlike the compartmental model approach, it does not support the calculation of TdR flux into DNA.
Finally, we note that TdR is a substrate for the synthesis of both nuclear DNA and mitochondrial DNA. Although it is true that the cytosolic synthesis of nuclear DNA via TK1 dominates TdR use in S-phase cells, the S-phase fraction may be small, even in rapidly growing tumors. Therefore, it should be kept in mind that rates of use of TdR estimated by 11C-TdR PET reflect a combination of nuclear DNA synthesis and mitochondrial DNA synthesis, with the latter providing a background that may attenuate percentage changes in 11C-TdR incorporation, for example, during anticancer treatments.
The routine use of 11C-TdR for clinical imaging has several problems, including dealing with catabolites, the short half-life of 11C, and relatively difficult synthesis. Labeled TdR must be made for each patient, and distribution networks such as those that now routinely provide 18F-labeled agents are not possible. These problems have limited 11C-TdR use to a few research centers and have propelled a search for TdR analogs that can be labeled with 18F and that are resistant to degradation. A wide variety of such analogs has been studied over the years (53–55); of these, 18F-FLT is one of the more promising tracers.
FLT was originally synthesized as an antineoplastic and antiretroviral agent and is similar in concept to azidothymidine, the first approved anti-HIV agent. It acts as a chain terminator in the synthesis of DNA. Initial clinical trials of FLT therapy were performed in patients with AIDS. Marrow suppression and occasionally fatal hepatotoxicity at routine pharmacologic doses (about 100 mg/d) led to the abandonment of FLT as a therapeutic agent. Nevertheless, the information gained provided a strong background to support the development of 18F-FLT as a radiotracer, because the doses used are orders of magnitude lower. The synthesis of FLT with 18F was initially accomplished with a mesylate precursor and was subsequently done with the nosylate and anhydrides (56–58). These precursors are now commercially available, and automated devices for the synthesis of 18F-FLT can be purchased.
Replacement of the hydroxy group at the 3′ position of deoxyribose converts TdR to FLT (Fig. 3). This modification prevents cleavage of the sugar from the thymine base by thymidine phosphorylase, making FLT highly resistant to breakdown, a major advantage for in vivo imaging. On the anabolic side of the equation, FLT is a good substrate for TK1 and a very poor substrate for TK2 (59). Additional kinases convert FLT monophosphate to FLT diphosphate and FLT triphosphate, and the FLT nucleotides can also be dephosphorylated by 5-nucleotidase (5). Importantly, fluorination at the 3′ position of the sugar inhibits the incorporation of FLT triphosphate into DNA. Thus, trapping of FLT in the form of its nucleotides is reversible, a factor that must be considered when 18F-FLT is used as an imaging agent for cell proliferation (60).
Initial studies in dogs and humans demonstrated that 18F-FLT was taken up and retained in organs (such as the bone marrow) and tumors with high proliferative rates (53). Imaging studies in human patients demonstrated accumulation of activity in the liver (Fig. 5), unlike the pattern noted in other species. As was known from studies of azidothymidine, 18F-FLT undergoes extensive glucuronidation in the human liver (60–63). On average, about 25% of the plasma activity is present as 18F-FLT-glucuronide at 60 min after injection. This factor must be considered in measurement of the blood level of the tracer for use in kinetic modeling (60,61,64). Although clearance can vary from patient to patient, 18F-FLT-glucuronide can be reasonably estimated by simple separation of a blood sample obtained at 60 min.
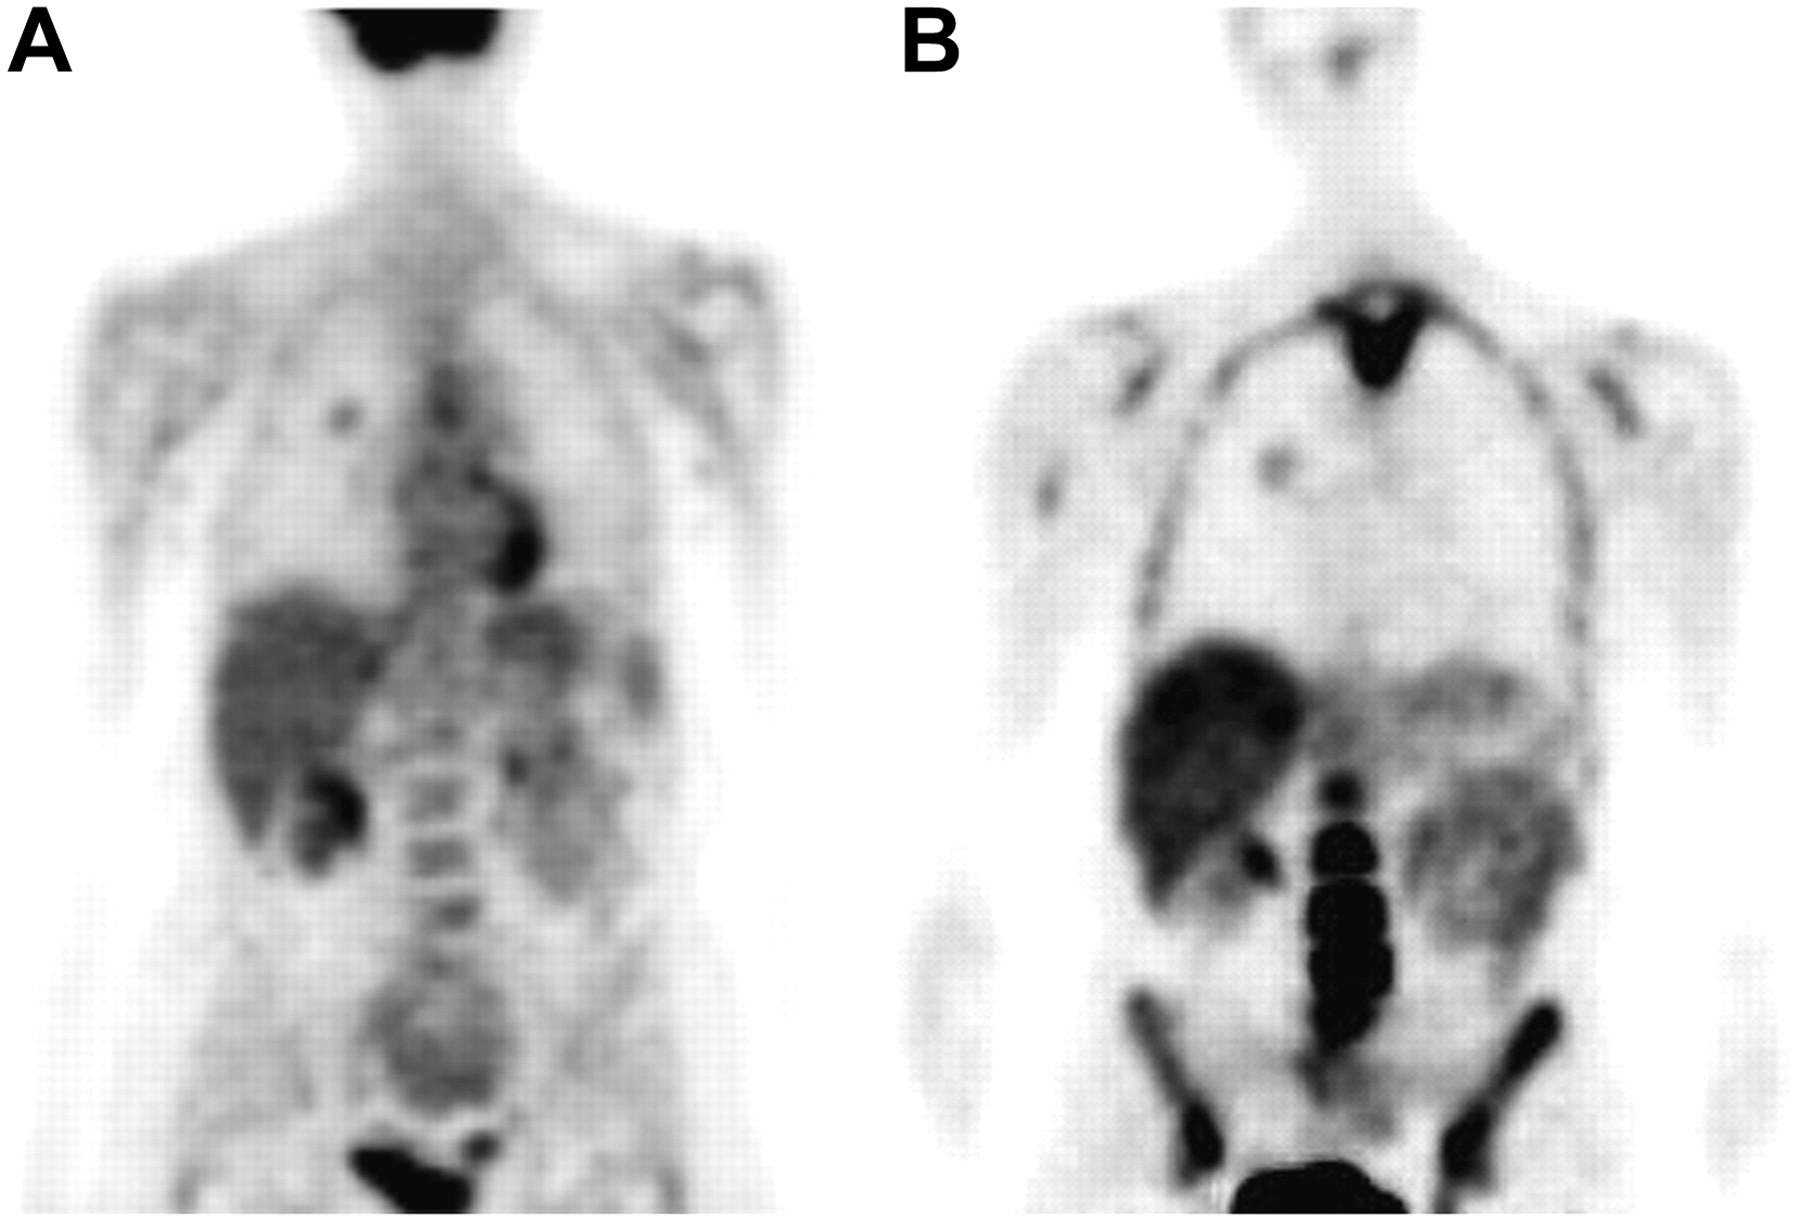
Comparison of 18F-FDG (A) and 18F-FLT (B) in human patient with lung cancer (right lung). PET scans were obtained beginning 65 min after injection of radiotracer; images are thin-slice coronal sections.
The kinetic modeling of 18F-FLT retention is analogous to that used for 18F-FDG; that is, it requires only a simple 2-compartment model for tissue. FLT-glucuronide does not accumulate in tissues outside the bloodstream; therefore, its contribution to PET images can be combined with that of intravascular 18F-FLT as an additive term in the equation for total activity seen by PET (61). Compared with the model for 2-11C-TdR (Fig. 4), the 18F-FLT model lacks the 2 compartment sets representing catabolites. As is the case for TdR, K1 and k2 represent transport into and out of the tumor, respectively. Unlike the situation with 2-11C-TdR, however, the exchanging tissue compartment represents only the free 18F-FLT nucleoside, not nucleoside plus nucleotides, whereas the second tissue compartment corresponds to 18F-FLT nucleotides, not DNA. Thus, for 18F-FLT, k3 is the rate constant for TK1-modulated phosphorylation, not incorporation into DNA. The dephosphorylation of 18F-FLT phosphate can be detected by 120 min, and the rate constant for this process is designated k4 (61). This term cannot be accurately measured in shorter imaging intervals and, in some instances, has been set to zero (62).
18F-FLT uptake has been compared with the measurement of Ki-67 levels in tumors by several investigators. The most extensive studies have been done in patients imaged with 18F-FLT before resection of lung cancer. The correlations between the 18F-FLT standardized uptake value (SUV) and Ki-67 were statistically significant (r = 0.87 and r = 0.84, as determined by Buck et al. (65) and Vesselle et al. (66), respectively). Yamamoto et al. found a similar significant correlation (r = 0.77, P < 0.0002) but also found that Ki-67 was slightly better correlated with 18F-FDG (r = 0.81, P < 0.0001) (67). In contrast,Yap et al. found only 18F-FLT, not 18F-FDG, to correlate with Ki-67 levels (68). In brain tumors, on the other hand, Ki-67 levels correlated better with 18F-FLT uptake (r = 0.84, P < 0.0001) than with 18F-FDG uptake (r = 0.51, P = 0.07) (69). Although the tumor uptake of 18F-FLT was found to be predictive of Ki-67 levels in breast cancer (70), it was not found to correlate with such measurements in esophageal cancer (71). In summary, whereas 18F-FLT retention correlates well with measures of proliferation obtained from biopsy specimens, this correlation is neither perfect nor seen in every tumor type. Furthermore, it is not known to what extent the correlation between 18F-FLT incorporation and cell proliferation is maintained during antitumor therapy.
A theoretic limitation of 18F-FLT as a radiotracer for the salvage pathway of DNA synthesis is that 18F-FLT is not incorporated into DNA; therefore, its uptake may be misleading if TK1 activity is not rate limiting for the incorporation of exogenous TdR into DNA. Cleavage of the sugar from the thymine base is inhibited by fluorination of either the 3′ position (as with 18F-FLT) or the 2′ position in deoxyribose (Fig. 3); however 2′ fluorination does not inhibit the incorporation of the triphosphate nucleotide into DNA.
1-(2′-Deoxy-2′-fluoro-1-β-d-arabinofuranosyl)-thymine (FMAU) is a 2′-fluoropyrimidine that has been developed for cell proliferation imaging with labeling either in the 5-methyl group of the pyrimidine base with 11C (72) or at the 2′-fluoro position of the sugar with 18F (73). Preclinical studies have shown that FMAU retention in tumors and nontumor tissues with rapid cell turnover (e.g., marrow and small intestine), reflects incorporation into DNA (74–77). FMAU is highly resistant to catabolism in both animals and humans, with the injected compound dominating time–activity curves in blood during the first hour after injection (75,76,78). Preliminary clinical studies have shown tumor uptake of 11C- or 18F-FMAU in a variety of cancers (78,79) comparable to that seen in human studies with 18F-FLT (65,80–83). In humans, 11C- or 18F-FMAU has higher liver, kidney, and myocardial uptake but much lower marrow uptake and rate of urinary excretion than 18F-FLT (compare Figs. 5 and 6), suggesting a potential role for FMAU in cases requiring assessment of bone metastasis or the pelvic region. Another potential advantage is that, in part because of its rapid blood clearance, 11C- or 18F-FMAU uptake in tumors reaches a plateau by about 10 min after bolus injection of the radiotracer. Tehrani et al. defined a tumor retention ratio equal to the area under the tumor time–activity curve (AUC) from injection to time t divided by the product t × the area under the blood time–activity curve from injection to t (84). Blood curves were determined by peripheral venous sampling. For patients with prostate (n = 6) or brain (n = 4) tumors, the investigators found that the tumor retention ratio at t = 11 min correlated strongly with the one-way clearance of 18F-FMAU from blood into the trapping compartment, as determined by compartmental modeling of 60-min dynamic PET and arterial sampling data. Thus, a single PET image of a tumor together with serial venous blood sampling during the first 11 min after injection may yield information comparable to that obtained from a full kinetic analysis, a major advantage for clinical applications. The rapid kinetics of FMAU also imply a potential clinical role for 11C-FMAU both in reducing patient radiation doses and in facilitating same-day imaging with 18F-FDG or other PET tracers.
The primary limitation of 11C- or 18F-FMAU appears to be that it is a relatively poor substrate for TK1 and a relatively good substrate for TK2 (85,86), probably accounting for its localization in mitochondrion-rich human myocardium (Fig. 6). Because TK1 is so highly expressed in dividing cells (87), cytosolic DNA synthesis may dominate FMAU uptake in aggressively growing tumors. However, because of background incorporation into mitochondrial DNA, 11C- or 18F-FMAU retention may be less sensitive than 18F-FLT retention to changes in cell proliferation. It is clear that a key question affecting the utility of 11C- or 18F-FMAU is the extent to which tumor uptake reflects TK1 versus TK2 activity.

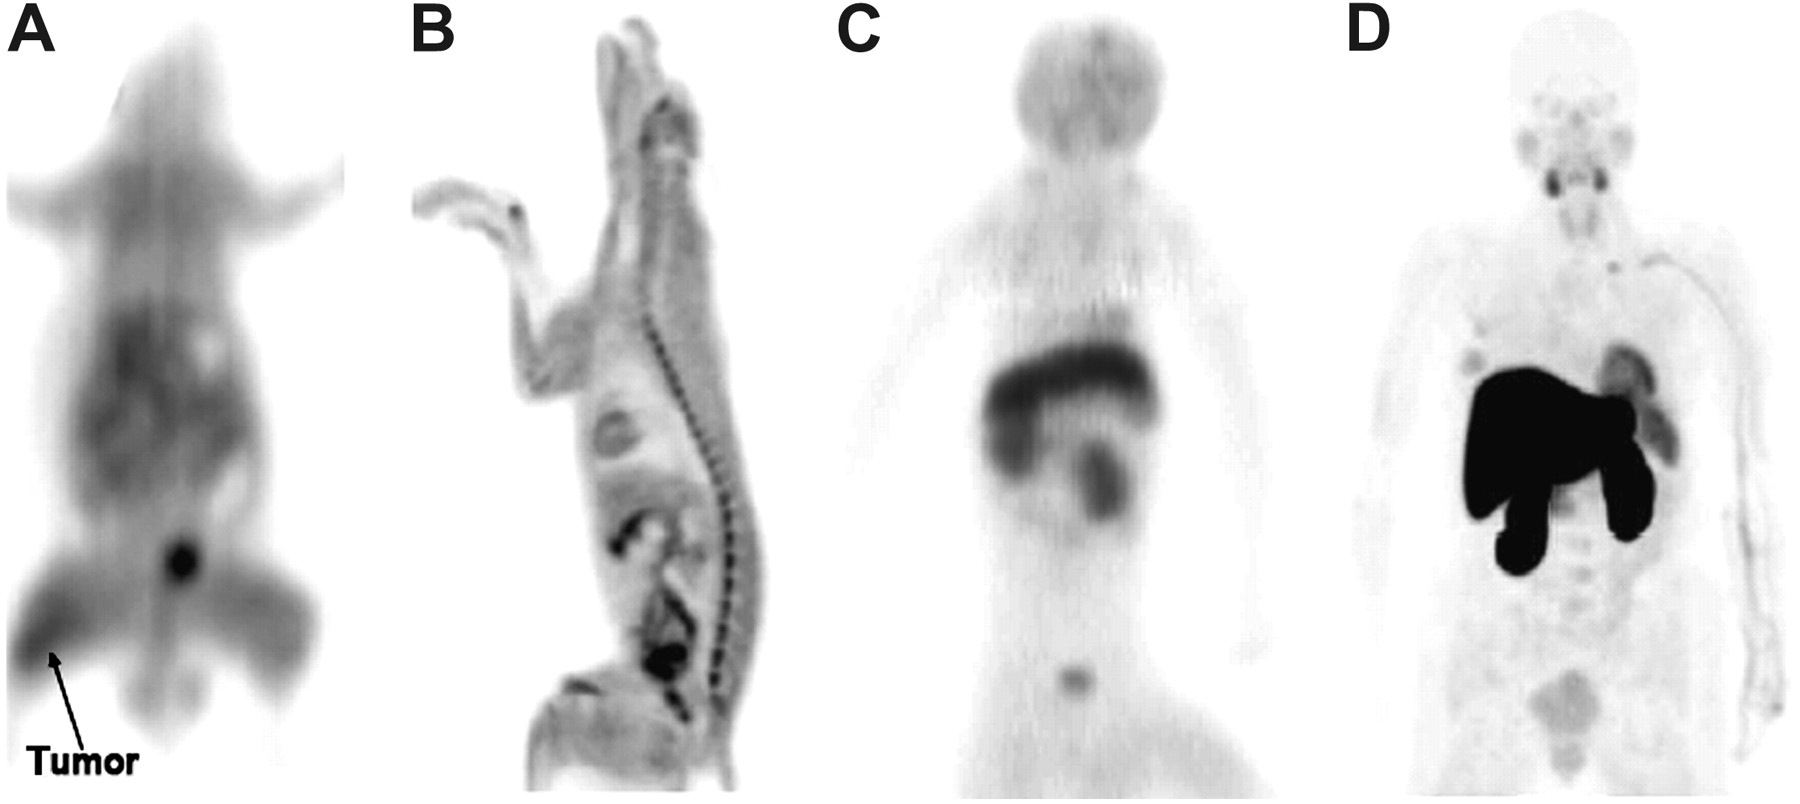
Comparison of biodistribution of FMAU in 4 species. (A) Thin-slice coronal PET image of rat 55–60 min after intravenous injection of 11C-FMAU. (B) Thin-slice sagittal PET image of dog 65–150 min after intravenous injection of 18F-FMAU. (C) Maximum-intensity-projection (MIP) image of cynomolgus monkey 44–57 min after intravenous injection of 11C-FMAU. (D) MIP image of human patient obtained beginning 65 min after intravenous injection of 18F-FMAU.
Preliminary studies suggested that, as with 18F-FLT, monophosphorylation is the rate-limiting or trapping step for 11C- or 18F-FMAU; that is, ≥80% of the radiolabel recovered from tissues was either in FMAU or in DNA (75). However, the DNA incorporation step may become rate limiting for FMAU incorporation during therapies that specifically impair triphosphate nucleotide incorporation into DNA, implying a potential advantage for 11C- or 18F-FMAU over 18F-FLT in situations in which TK1 activity is not rate limiting for the incorporation of exogenous TdR into DNA.
Halogenation at the 5 position of the uracil base imitates CH3 and thus converts deoxyuridine into a TdR analog (Fig. 3). This process, plus the availability of suitable iodine and bromine isotopes (123I, 131I, and the β+-emitters 124I and 76Br), has led to the development of iodo- and bromodeoxyuridine radiotracers for in vivo imaging of cell proliferation (88–90). The principal limitation of this approach is rapid in vivo dehalogenation of the radiotracers. Various manipulations designed to reduce the radiohalogen background, including saline flush and diuresis (91), late-phase imaging (24 h) to allow washout of the radiohalogen (92), biomodulation to block dehalogenation (93), and molecular modification of the radiotracers to reduce dehalogenation (55), have met with limited success (94,95).
Additional TdR analogs that are resistant to catabolism and that have shown promise as potential imaging agents for cell proliferation include 1-(2′-deoxy-2′-fluoro-β-d-arabinofuranosyl-uracil)bromouracil (FBAU) labeled with either 18F or 76Br (half-life, 16 h) and 4′-[11C-methyl]thiothymidine. On the basis of the similar sizes of the methyl and bromo moieties, FBAU behaves similarly to FMAU. Studies in rats have shown that it is rapidly incorporated into DNA in proliferating tissues, such as the small intestine, spleen, and marrow (96,97). A recent study with 14C-labeled thiothymidine in mice bearing syngeneic mammary tumors showed high uptake in the spleen and duodenum and moderate uptake in tumors (98). The percentages of activity in DNA at 1 h were greater than 70% for the spleen and duodenum and greater than 50% for tumors.
There are large differences in the systemic pharmacokinetics and biodistribution of 11C-TdR and its analogs among humans and the various species of animals available for preclinical testing. These variations, which are illustrated in Figure 6 for the TdR analog 11C- or 18F-FMAU, cause difficulties in predicting radiolabel biodistribution and radiation doses in humans from studies in animal models.
Mice and rats have circulating levels of TdR (∼1 μM) that are about an order of magnitude greater than those in humans (99) and are high enough to cause significant competitive inhibition of radiolabeled TdR and TdR analog uptake in murine tissues (75). This factor contributes to the generally low organ and tissue uptake seen with 11C-TdR and its analogs in mice and rats (35,75,100). Some investigators have injected thymidine phosphorylase to deplete circulating TdR before radiotracer administration, and this procedure results in a dramatic increase in marrow uptake (75). The initial biodistribution studies of 18F-FLT were done with normal Swiss Webster mice, and relatively high uptake of the tracer was noted in proliferative tissues, such as the marrow and spleen. When studies were done with BALB/c mice bearing implanted tumors, no concentration of 18F-FLT above the background was demonstrated. Although the variation between strains of mice has not been formally tested, it may reflect differences in native TdR levels.
In dogs, the biodistribution of radiolabeled TdR and its analogs at 1 h after injection is similar to that in rats, with the most notable differences being modestly higher kidney uptake of 11C-TdR, higher marrow uptake of 18F-FLT (53), and modestly higher myocardial uptake of 18F-FMAU (76).
We are aware of only one imaging study of 11C-TdR or its analogs in nonhuman primates, that being with 11C-FMAU (101). Scans of 2 cynomolgus monkeys showed much higher accumulation of radiolabel in the liver and kidneys in monkeys than in rodents or dogs, a difference also seen with 18F-FMAU in humans (78).
A striking difference among the various species examined is the much higher myocardial uptake of 11C-TdR and 18F-FMAU in humans. TK2, the mitochondrial form of the enzyme, is present at relatively high levels in the human heart, contributing to the uptake of 11C-TdR in this organ. 18F-FLT and 18F-FMAU show variable cardiac uptake, depending on the relative affinity of these compounds for TK2 and the relative myocardial expression of TK2 among species. In humans, little 18F-FLT is retained because of its very low affinity for TK2 (59), but 18F-FMAU shows high retention, reflecting its relatively high affinity for TK2 (86).
Humans also have much higher hepatic uptake of 18F-FLT and 11C- or 18F-FMAU than do mice or dogs (53,76,78,100,102). For 18F-FLT, this finding reflects differences in glucuronidation. As discussed earlier, in humans the kinetic modeling of 18F-FLT retention must take into account the fraction of 18F-FLT-glucuronide seen in the blood, which reaches a level of about 25% at 1 h. 11C- or 18F-FMAU has extremely fast clearance from the blood in humans, with 95% of the tracer being cleared by 10 min, reflecting very high liver retention. 18F-FMAU clearance is much slower in dogs, with little uptake being seen in the liver above the background. The mechanism causing the high liver uptake of 11C- or 18F-FMAU in humans has not been determined.
It is clear that one must take into account the major differences in native TdR levels in the blood and the resulting effects on tracer metabolism, clearance, and retention in tissues when deciding to study radiolabeled TdR or its analogs in an animal model. Rodents and dogs have been used the most for studying these tracers, but their limitations must be kept in mind when one is planning studies and interpreting results.
Other Modalities
MRI.
Most of the effort to develop MRI for the examination of tumor cell proliferation has focused on magnetic resonance spectroscopy in brain tumors. Empiric correlations have been reported between tumor growth rates and magnetic resonance spectroscopy measurements of relative choline, N-acetylaspartate, or mobile lipid concentrations; the mapping of local cell growth rates within tumors appears to be feasible (103–105). There also have been some attempts to establish empiric correlations between tumor proliferative activity and proton relaxation times, T1 and T2, on the basis of differences in tumor interstitial or intravascular water content (106).
Optical Imaging.
Fluorescence-labeled molecular probes targeted at molecules expressed specifically in dividing cells can, in principle, be developed (107). Alternatively, reporter genes driving fluorophore or bioluminescence enzyme expression and triggered by conditions related to cell proliferation can be built into tumor cells (108). At this point, however, in vivo optical imaging of tumor cell proliferation is mostly confined to monitoring of tumor growth and spread in transplant-bearing or transgenic mice with tumor cells engineered to express either a fluorescence or a bioluminescence marker (109). With proper calibration, the detected light is proportional to cell number, so tumor cell growth rates can be determined by serial imaging in the same mouse (110,111).
CANCER DETECTION AND STAGING
Tumor detection is neither a forte of cell proliferation imaging nor the goal motivating its development. In PET, both 18F-FDG and 11C-MET generally provide higher tumor uptake and better tumor-to-normal tissue contrast than 11C-TdR or its analogs. Exceptions include anatomic regions in which label accumulation is high for the more conventional tracers relative to TdR, such as the brain for 18F-FDG, the pancreas for amino acids, and the pelvic region because of bladder activity for both 18F-FDG and amino acids. The specificity of 18F-FDG in tumor detection is sometimes limited by uptake in nontumor regions of inflammation and residual inflammation at previous tumor sites, and this factor may indicate an advantage of cell proliferation markers over 18F-FDG (112). However, 11C-TdR and its analogs also accumulate in reactive lymph nodes and sites of inflammation, presumably because of locally dividing white blood cells (113,114).
TdR
Thus far, only 11C-TdR and 18F-FLT have been evaluated in humans more than anecdotally. A modest number of clinical pilot studies with 11C-TdR PET in a variety of malignancies has been reported. For somatic disease, the tumor images were generally of lower contrast than those obtained with 18F-FDG, in part because of the background from recirculating radiocatabolites. Nonetheless, tumor uptake tended to correlate positively with tumor grade (37,45,115–117). Brain tumors have received special attention because of the generally high tumor-to-brain contrast achieved with 11C-TdR relative to 18F-FDG. (11C-TdR is largely excluded from normal brain parenchyma by the BBB.) In a study with 2-11C-TdR and 18F-FDG, Vander Borght et al. observed increased tumor localization relative to brain localization in 16 of 20 patients, but uptake was not correlated with tumor grade, and 18F-FDG was better at differentiating high-grade from low-grade tumors (42). Eary et al. compared 2-11C-TdR PET, 18F-FDG PET, and MRI by standardized visual inspection in 13 patients and found that 2-11C-TdR uptake correlated well with pathologic characterization of the brain tumors (118). The pattern of 2-11C-TdR uptake among different tumors varied from those of 18F-FDG uptake and MR contrast enhancement. Kinetic modeling was applied to dynamic PET and arterial sampling data to calculate parametric images of TdR transport constants and blood-to-DNA flux in a subset of patients. The analysis sharply increased tumor-to-brain contrast and differentiated between BBB disruption and metabolic trapping as causes of tumor uptake and retention of 2-11C-TdR. Similar results were reported in a sequel to the study of Eary et al. (118), in which Wells et al. used a dual-scan 2-11C-TdR/11C-CO2 technique and the compartmental model of Figure 4 to account for labeled catabolites and estimate TdR flux into DNA in a series of 20 patients (45).
FLT
In an increasing number of studies, 18F-FLT has been evaluated for the detection and staging of a variety of cancers. In all cases, the assessments have been based on visual inspection of quasi steady-state accumulation of the radiotracer in tumors compared with nontumor tissues. Several reports have suggested a complementary role for 18F-FLT relative to 18F-FDG in the detection of primary lung cancer but not in the evaluation of mediastinal involvement (N staging). Figure 5 compares 18F-FLT with 18F-FDG in a patient with lung cancer. Buck et al. found that, despite uptake that was only about one third that of 18F-FDG, 18F-FLT still had a sensitivity of 85% (compared with 100% for 18F-FDG) for the detection of malignant pulmonary nodules in 26 patients (13). The specificity of tumor identification was 100% for 18F-FLT, whereas 18F-FDG produced several false-positive results attributable to uptake in inflammatory lesions. A subsequent study of 47 patients by the same research group again revealed good detection of primary lung cancer with 18F-FLT but rather poor sensitivity (53%) for the detection of mediastinal involvement (119). Findings similar to those of Buck et al. (13) were reported by Halter et al. for 28 patients (120) and, more recently, by Yamamoto et al. (54 patients evaluated for primary tumors and 22 patients evaluated for mediastinal involvement) (67). On the other hand, Cobben et al. found that 18F-FLT had a low sensitivity for detecting non–small cell lung cancer in 17 patients, especially patients who had not received prior treatment (121). For other types of cancer, Francis et al. found that for colorectal carcinoma, 18F-FLT had an effectiveness similar to that of 18F-FDG for detecting disease outside the liver but not intrahepatic metastases, because of the relatively high liver background seen with 18F-FLT (82). Herrmann et al. reported on a study of 33 patients with gastric cancers, in which 18F-FLT sensitivity for tumor detection exceeded that of 18F-FDG (100% compared with 73%) (122). Cobben et al. studied 11 patients with laryngeal cancer and found the sensitivity and specificity for tumor detection to be 88% and 88%, respectively, for 18F-FLT and 88% and 94%, respectively, for 18F-FDG (113). Interestingly, that study demonstrated a false-positive identification, in which 18F-FLT was localized in an inflammatory lesion. Another, more dramatic instance of false-positive 18F-FLT localization was recently reported by Troost et al., who studied 10 patients with squamous cell carcinomas of the head and neck (114). Although it correctly detected all metastatic lymph nodes (sensitivity, 100%), 18F-FLT also was concentrated in several nontumor, reactive lymph nodes because of local B-lymphocyte proliferation (specificity, 17%). Overall, 18F-FLT does not appear to offer major advantages in the diagnosis and staging of cancer over 18F-FDG. It has lower tumor uptake, especially in lower-grade lesions, and hence may have lower sensitivity, but it does not offer major gains in specificity.
One area of the body in which 18F-FLT may prove to be better than 18F-FDG for tumor detection is the brain, because high 18F-FDG uptake in the brain limits the utility of that tracer. Chen et al. found, in a study of 25 patients with newly diagnosed or recurrent gliomas, that 18F-FLT was more sensitive than 18F-FDG for the detection of high-grade tumors, an observation that coincided with a higher correlation between tumor uptake and the Ki-67 index for 18F-FLT than for 18F-FDG (r = 0.8 vs. r = 0.5) (69). Choi et al. studied 4 patients with very high-grade brain tumors and 22 patients with high- to low-grade tumors or nontumor lesions (123). Both 18F-FLT and 18F-FDG detected all 4 of the highest-grade tumors, but 18F-FLT was more accurate than 18F-FDG for 12 other high- to medium-grade tumors. In contrast, Jacobs et al. compared 18F-FLT with 11C-MET in 23 patients with gliomas and found that 11C-MET was more sensitive for tumor detection (91% vs. 78%) (124). Muzi et al. applied compartmental modeling to dynamic PET and arterial blood sampling data in 12 patients with gliomas (83). They found that restricted transport of 18F-FLT across the BBB and modest rates of 18F-FLT phosphorylation may limit the assessment of cell proliferation with 18F-FLT to rapidly growing tumors with significant BBB breakdown.
In summary, 11C-TdR and, to a greater extent, 18F-FLT have been evaluated for tumor detection and staging in a modest number of small clinical trials. Sensitivity for tumor detection is limited somewhat because of modest tumor uptake and, especially for 11C-TdR, a background of recirculating, radiolabeled metabolites. Visualization of slowly growing tumors is poor and generally requires other scans (such as 18F-FDG and coregistered CT) for tumor demarcation. 18F-FLT is probably not useful for tumors within the liver, bone, or pelvic region because of high radiolabel accumulation in nontumor tissues and organs. 18F-FLT consistently has been shown to correlate better than 18F-FDG with cell proliferation markers in excised tumors and has some potential advantage over 18F-FDG for differentiating growing tumors from inflammation; however, it yields false-positive interpretations for inflammatory sites and lymph nodes with local white blood cell proliferation. Overall, 11C-TdR and 18F-FLT are clearly inferior to 18F-FDG for assessing the extent of disease in cancers outside the brain. Both 2-11C-TdR and 18F-FLT provide good visualization of high-grade brain tumors but are probably inferior to 11C-MET as imaging agents for detecting brain tumors. Whether for brain or somatic tumors, full exploitation of TdR and 18F-FLT for the assessment of tumor aggressiveness requires dynamic imaging and kinetic analysis (46,60,61).
MONITORING OF TUMOR RESPONSE TO THERAPY
Its potential for monitoring and predicting the response to antineoplastic therapy has always been a primary motivation for the development of in vivo imaging of cell proliferation. Research with PET DNA synthesis tracers has reached a point at which utility in assessing tumor response can now be thoroughly explored, and we offer a summary of what is known to date. Before that, however, some theoretic considerations about the likely response of tumor cell growth to various types of treatment are warranted.
Regulation of DNA Synthesis and Its Effect on Uptake of Salvage Pathway Tracers
DNA synthesis for cell division is initiated at the end of the G1 phase in response to various signals (48). At this time, TK1 levels increase rapidly by factors varying in different cell types from 2 to as much as 20 (30,31). The expression of other enzymes of DNA synthesis (e.g., TS, DNA polymerase, and topoisomerases) is also upregulated in dividing cells. After the completion of mitosis, TK1 levels quickly return to basal levels. The upregulation and downregulation of TK1 are controlled by distinct regulatory mechanisms. In addition, a negative feedback loop operates between the thymidine triphosphate (TTP) pool and TK1 (Fig. 2). This fact has important implications regarding the short-term response of 11C-TdR or TdR analog uptake in tumors exposed to antineoplastic treatments. Drugs (such as actinomycin D or cisplatin) that inhibit the incorporation of TTP into DNA are likely to engender an increase in the triphosphate nucleotide pool and thus cause reductions in TK1 levels and trapping of radiolabeled TdR tracers. On the other hand, TS inhibitors such as 5-fluorouracil may cause an early increase or “flair response” in 11C-TdR or TdR analog uptake by depleting the TTP pool, in turn causing an increase in TK1 activity. Instances of these types of short-term 11C-TdR PET response have been reported, both in vitro (125) and in vivo (126). Of course, modern treatment regimens usually use combinations of drugs and radiotherapy, the various components of which may affect TTP pool size in opposite directions, making the effects on 11C-TdR or TdR analog uptake difficult to predict.
Another factor to consider is that tumor uptake, as viewed by in vivo imaging, reflects cell density as well as the avidity of radiotracer incorporation on a per-cell basis. Thus, successful cytotoxic therapy will eventually reduce tumor uptake in PET images, regardless of the status of the surviving cells. In other words, in the longer term, cell killing will tend to cause the 11C-TdR or analog response to converge toward the 18F-FDG response, because the latter reflects viable cell density. Conversely, successful cytostatic treatment will tend to decrease the tumor uptake of 11C-TdR or TdR analogs without necessarily affecting 18F-FDG uptake.
The implication of these considerations is that the use of 11C-TdR and its analogs to monitor treatment effects and predict long-term tumor responses should be tailored on the basis of an understanding or empiric knowledge of the likely short- and intermediate-term effects of the treatment on tumor uptake. A summary of some commonly used chemotherapeutic agents with predictable effects on DNA salvage pathway use is given in Table 1. It may be optimal to begin follow-up scans very early (i.e., within a few days or even hours) after the initiation of treatment. Significant changes, either positive or negative, in tracer uptake may be indicative of a treatment effect on cellular DNA synthesis. The unique information that cell proliferation imaging may provide relative to information obtained with 18F-FDG is likely to become available during the very early period after the initiation of treatment.
Anticipated Imaging Responses of TdR and Its Analogs to Various Chemotherapeutic Agents
Generally speaking, impairment of cell proliferation is a necessary but not sufficient condition for a positive treatment response, implying that the goal of cell proliferation imaging is to identify at an early stage in the individual patient a course of treatment that is destined to be ineffective. The hypothesis underlying the development of cell proliferation imaging is that it will shorten the time after the initiation of treatment required to recognize a given regimen as being ineffective, thus avoiding the costs (such as money, potential toxicity, and reduced opportunity for successful treatment) of futile treatment.
Evaluation of TdR and Its Analogs for Monitoring of Tumor Response
TdR.
Only a few studies have examined the use of 11C-TdR PET to assess the tumor response to treatment. Shields et al. reported on the use of 2-11C-TdR in 3 patients with lung cancer and 2 patients with soft-tissue sarcomas (116). Scans were obtained before and at 1, 6, and 10 wk after a single course of chemotherapy (various multidrug regimens) and compared with same-day 18F-FDG scans. Responses were judged from histopathologic examination or overall clinical assessment. The tumor uptake of both 2-11C-TdR (SUV at 20–60 min after injection) and 18F-FDG (SUV at 30–60 min after injection) declined by the first follow-up scan in the 4 patients who had complete or partial responses. 2-11C-TdR uptake was unchanged in the one nonresponding patient, whereas 18F-FDG uptake increased. Kinetic analysis enhanced the distinctions in TdR responses; the 3 patients with complete responses all showed 100% reductions in the blood-to-DNA flux constant measured at 1 wk. 2-11C-TdR and 18F-FDG tumor responses over 10 wk are illustrated for one of the responding patients in Figure 7.

Imaging response to treatment analyzed with 2-11C-TdR and 18F-FDG. Coronal images through midthorax are shown for patient with non–small cell lung cancer and extensive hilar and mediastinal lymph node metastases. Pretherapy 18F-FDG and 2-11C-TdR PET images show increased uptake at tumor sites; contrast is reduced for 2-11C-TdR because of labeled catabolites. At 6 wk after chemotherapy and radiation therapy, 2-11C-TdR shows clear reduction in tumor uptake, whereas 18F-FDG uptake is only minimally changed. At 10 wk, 2-11C-TdR uptake indicates continuing tumor response, and 18F-FDG uptake is also clearly reduced. This study demonstrated ability of cell proliferation imaging to detect early response to treatment. (Reprinted with permission of (4).)
A study that illustrated a very early flair response with 2-11C-TdR was reported by Wells et al. (126). Five patients with intrahepatic metastases from colon cancer and 7 control patients with advanced gastrointestinal malignancies were studied twice each with 2-11C-TdR. The 5 test patients were rescanned 1 h after the oral administration of a TS inhibitor. Images were corrected for labeled catabolites and analyzed for tumor uptake of 2-11C-TdR at 50–60 min after injection. Treated patients all showed marked increases in the tumor SUV (43% ± 10%, mean ± SEM), whereas control patients showed small overall decreases (−8% ± 3%; P < 0.005). That study dramatically illustrated the potential of cell proliferation imaging to provide immediate information on the pharmacodynamics of appropriate chemotherapeutic drugs.
FLT.
In recent studies, small-animal PET or direct tissue assays were used to correlate 18F-FLT with various types of antineoplastic therapy in tumor-bearing mice. Sugiyama et al. studied the effects on 18F-FLT and 18F-FDG uptake of x-ray irradiation of a murine sarcoma (experiment 1) and photodynamic therapy of a human cervical carcinoma xenograft (experiment 2) (127). In experiment 1, 18F-FLT uptake had declined 30% at 6 h and remained at that level, whereas 18F-FDG uptake was unchanged until 3 d after treatment. Measurements were obtained in treated and control animals at 24 h in the photodynamic therapy experiment; 18F-FLT uptake was reduced 75% at that time, whereas 18F-FDG uptake was unchanged. In both experiments, changes in 18F-FLT uptake reflected declines in cell proliferation measured ex vivo. Leyton et al. reported declines in 18F-FLT uptake of 24% ± 8% and 49% ± 8% at 1 and 2 d, respectively, after the administration of cisplatin to mice bearing radiation-induced fibrosarcomas (128). The same researchers also found a dose-dependent reduction in 18F-FLT uptake in an implanted human cervical carcinoma 4 d after the administration of a TK1 inhibitor (129). Barthel et al. observed 52% and 28% reductions in 18F-FLT uptake and 18F-FDG uptake, respectively, at 24 h after the administration of 5-fluorouracil to mice bearing radiation-induced sarcomas (100). Finally, Waldherr et al. administered an epidermal growth factor receptor tyrosine kinase inhibitor to mice bearing human cervical cancer xenografts and observed tumor growth arrest as well as an 80% decline in 18F-FLT uptake at 1 wk compared with a 30% decline for 18F-FDG (130). An additional experiment showed that the 18F-FLT response was present by 48 h. In summary, 5 separate studies with 6 different types of treatment in 5 different types of tumors all revealed early (i.e., within a few days) and marked reductions in 18F-FLT uptake. In studies in which 18F-FLT was compared with 18F-FDG, 18F-FLT always provided earlier or quantitatively more distinct evidence of treatment efficacy.
Clinically, investigators have begun to report small pilot studies of treatment response assessment with 18F-FLT. Pio et al. scanned 14 patients with breast cancer before treatment, after the first cycle and again after the completion of chemotherapy (131). Responses were assessed with CT. Rapid equilibration of 18F-FLT uptake was observed. A change (decline) in the tumor SUV after the first course of treatment correlated with a subsequent change in tumor size (r = 0.8), leading the investigators to conclude that 18F-FLT scans beginning 10 min after injection accurately predict the tumor response. More recently, Kenny et al. reported on changes in tumor uptake and trapping of 18F-FLT and 18F-FDG in 13 breast cancer patients treated with 5-fluorouracil, epirubicin, and cyclosporine (1). Follow-up scans were obtained 6–12 d after the initiation of treatment, and responses were defined by CT (Response Evaluation Criteria in Solid Tumors [RESIST]). Images from 2 patients are shown in Figure 1. The tumor SUV at 90 min and the Patlak slope Ki (Patlak slope, equivalent to net clearance from blood into the trapping compartment) were significantly reduced on follow-up in all 6 patients who had complete or partial responses. Average decreases in responding lesions were 41% for SUV and 53% for Ki, whereas nonresponding tumors showed average increases of 3.1% and 1.9% for SUV and Ki, respectively. There was a significant difference in 18F-FLT parameter changes between patients who responded and those who did not (P = 0.02 for both SUV and Ki).
Two studies of patients with non-Hodgkin's lymphoma examined the utility of 18F-FLT in predicting responses to multiagent immunotherapy and chemotherapy (rituximab plus cyclosporine, adriamycin, vincristine, and prednisone [R-CHOP]). Herrmann et al. scanned 6 patients before and again at 1 and 6 wk after R-CHOP treatment (132). The tumor uptake of 18F-FLT (SUV measured at ≥45 min after injection) declined by averages of 77% and 85% at those time points (132). Another group of 16 patients had follow-up scans at 2 d after rituximab treatment and again at 2 d after R-CHOP treatment; there was no significant change after the immunotherapy component, but there was an average decline of 32% after the administration of chemotherapy. Kim et al. studied 33 patients with aggressive non-Hodgkin's lymphoma (133). 18F-FLT follow-up scans were obtained before the second cycle of R-CHOP therapy and again after the completion of therapy. Responses were assessed with conventional imaging, biochemistry, or 18F-FDG. For 18F-FLT, the average changes in the tumor SUV were −71% after the first cycle of therapy and −88% after the final cycle. Patients with complete responses had normal 18F-FLT scans after both the first and the final cycles.
Finally, Chen et al. performed 18F-FLT follow-up scans at 1–2 wk and again at 6 wk after the administration of combined antiangiogenesis and chemotherapy (bevicuzimab and irinotecan) in 19 patients with gliomas (134). A metabolic response was defined as a decrease in tumor uptake (SUV) of 18F-FLT of greater than 25%. Mean survival times in 9 metabolic responders and 10 nonresponders were 10 and 5 mo, respectively. Early and late 18F-FLT evaluations were the 2 most powerful independent predictors of survival among all of the variables tested, including MRI.
Although it is still far too early to draw conclusions, the initial clinical evaluations of 18F-FLT have consistently been very encouraging. In each of the 5 pilot studies cited here, the tumor uptake of 18F-FLT declined dramatically at the earliest time of follow-up, suggesting that cell proliferation imaging with 18F-FLT can be a powerful tool for the individualization of anticancer therapy.
Precision of Cell Proliferation Imaging
Knowledge of the reproducibility of image-derived tumor measurements is an essential prerequisite to defining a statistically significant imaging response to therapy. In the previously described 2-11C-TdR study of Wells et al., dynamic scanning and blood sampling were performed on 7 patients with advanced gastric malignancies twice each within 1 wk by use of 2-11C-TdR PET (126). The patients did not receive treatment during this interval. Images were corrected for labeled catabolites and analyzed for the tumor uptake of 2-11C-TdR at 50–60 min after injection as well as for the tumor 2-11C-TdR AUC at 0–60 min and the 2-11C-TdR fractional retention at 1 h (i.e., uptake at 60 min/uptake at 1 min). The absolute variabilities of these parameters (mean ± SD) were as follows: SUV, 10% ± 5%; AUC, 3% ± 4%; and fractional retention, 11% ± 11%. Shields et al. reported on the reproducibility of tumor SUV measurements at 30–60 min after the injection of 18F-FLT in 6 patients with non–small cell lung cancer (135). The mean absolute change in the tumor maximum SUV was 6%, with a range of 1%–12%. On repeat 18F-FLT scans obtained before therapy in 13 patients with breast cancer, Kenny et al. found 95% confidence limits for tumor Patlak slopes and SUV measurements at 90 min of ±30% and ±21%, respectively (1). On the basis of the consistency of the measured variabilities in these 3 studies, it appears that tumor SUV measurements obtained with 18F-FLT have 95% confidence limits (2 × SD) of about ±20%.
RECOMMENDED SCAN ACQUISITION AND INTERPRETATION METHODS FOR 18F-FLT
Initial recommendations for the use of 18F-FLT can be made on the basis of work to date. Because 18F-FLT uptake tends to be modest to low, tumor localization should be based on, or at least confirmed with, coregistered anatomic and 18F-FDG scans. In detailed kinetic studies, Muzi et al. have shown that for both lung and brain tumors, leakage from the trapped 18F-FLT nucleotide pool is nonnegligible on the time scale of imaging studies (60,83). The accurate determination of the FLT flux constant KFLT requires dynamic scanning and blood sampling for at least 90 min as well as the inclusion of k4 in the compartmental model (4-parameter model). Muzi et al. (60,83) reported the following correlation coefficients for 18F-FLT analysis and the Ki-67 assay in lung tumors: for KFLT evaluated at 0–120 min and k4 ≠ 0 and r = 0.92; for KFLT evaluated at 0–90 min and k4 ≠ 0 and r = 0.88; for KFLT evaluated at 0–60 min and k4 ≠ 0 r = 0.71; for KFLT evaluated at 0–60 min and k4 = 0, r = 0.87; for KFLT evaluated by graphic (Patlak) analysis at 0–60 min, r = 0.76; and for SUV evaluated at 30–60 min, r = 0.65.
We addressed the issue of the optimal scanning period for determination of the tumor SUV by simulating tumor, muscle, and brain time–activity curves and their compartmental constituents by using the 18F-FLT input function and model parameters measured by Muzi et al (60,83). To simulate the effects of successful treatment, we reduced k3 for tumors by a factor of 10. We examined the resulting time–activity curves for time periods during which tumor-to-normal tissue contrast and fraction of tumor activity in the nucleotide pool were simultaneously maximized. According to these criteria, we found 40–60 min to be optimal for both lung tumors and contrast-enhancing brain tumors, untreated and treated.
On the basis of the information cited here, we recommend the following hierarchy of data acquisition and analysis techniques. Method 1 is dynamic PET at 0–90 min with the 4-parameter model. The arterial input function for 18F-FLT can be adequately estimated during the first several minutes from PET images of the heart or aorta and thereafter from a modest number of peripheral venous samples (62). Chromatographic analysis of one sample taken near the end of the scanning sequence is sufficient to estimate the 18F-FLT component of the time-total activity curve for blood. Method 1 should be used whenever feasible, especially in initial studies with 18F-FLT for a particular type of cancer or when the objective is to determine the effect of novel therapies on tumor cell proliferation. Method 2 is dynamic PET at 0–60 min with the 3-parameter model. The arterial input function can be determined as recommended for method 1. Method 3 is static PET at 40–60 min, with the tumor activity concentration expressed in terms of SUV.
In methods 1 and 2, voxel-by-voxel modeling should be used whenever feasible to generate parametric images of K1 and KFLT (83). In all 3 methods, the tumor activity concentration should be corrected for limited PET image resolution (partial-volume effect (136)). For the assessment of treatment responses, changes in the tumor SUV of ≥20% can be considered significant; the use of KFLT may further improve the precision with which changes in tumor cell proliferation can be determined. Note that the recommendations regarding the timing and duration of scans are based on data acquired for lung and high-grade brain tumors and thus may not be optimal for other tumor types.
CONCLUSION
Proliferation imaging in oncology looks promising, but its exact role remains to be defined. Here we list what we believe to be the most important questions regarding proliferation imaging with PET:
What, if any, role should imaging with 11C- or 18F-labeled TdR analogs have in the diagnosis or staging of cancer?
How well does imaging with 11C- or 18F-labeled TdR analogs correlate with direct, ex vivo assays of residual tumor cell proliferation after treatment?
What is the best combination of 11C- or 18F-labeled TdR analogs, scanning, and image analysis technique for the assessment of treatment responses, and does the choice vary with tumor or therapy?
What is the best timing of imaging after treatment, and how does it vary with tumor or therapy?
How can national trials be conducted to address Questions 1, 3, and 4?
How is cell proliferation imaging most effectively used in the preclinical screening of anticancer treatments?
To what extent does the tumor uptake of 11C- or 18F-FMAU reflect TK1 versus TK2 activity?
18F-FDG imaging to diagnose and stage cancer has become accepted for many tumor types and clinical situations, although much work remains to be done even with this now standard agent. The use of 18F-FDG to monitor therapy still requires extensive development and validation, because only small trials have as yet been done to demonstrate the utility of this approach. Many issues with a bearing on the acceptance of 18F-FDG are also relevant to cell proliferation tracers. In fact, the bar is higher for cell proliferation tracers, because they will only gain acceptance to the extent that they are shown to be better than 18F-FDG.
At this point, several proliferation tracers have been developed; these include TdR itself, FLT, FMAU, FBAU, and others. To date, 18F-FLT has undergone the most widespread testing and has been found to be attractive for use in detecting brain tumors and monitoring therapy, but it is clear that much more needs to be done. Several research centers now make this agent, and its potentially widespread use has led commercial firms to synthesize and distribute 18F-FLT for clinical research use. FMAU has been tested with 11C and 18F at some centers. Some of its properties look promising; its rapid clearance allows for imaging within minutes of injection, its low renal excretion makes pelvic imaging more reasonable, and its low marrow uptake makes imaging boney lesions feasible. At this point, the other tracers need further study and may have niche uses. For example, FBAU can be labeled with 18F but also with the longer-lived β+-emitters 76Br and 124I. It may well be concluded that there is no single best proliferation imaging agent; it is possible that multiple tracers will be needed to cover the range of important clinical applications.
Potentially, the most important role for cell proliferation imaging in oncology is measurement of the treatment response. At present, the standard of care is simply to measure changes in tumor size with CT or MRI, but this approach has many limitations. The greatest problem is that months may pass before it becomes apparent that the tumor is just growing slowly and hence that treatment has failed. The usual treatments for advanced cancer are quite toxic and very expensive. The cost of 1 mo of therapy now dwarfs the cost of a PET scan in many cases; hence, accurate early treatment evaluation could provide substantial cost savings. The issue of tumor response assessment with molecular rather than anatomic imaging has increasing relevance, because targeted therapies may not result in much of a change in tumor size, even when treatment is successful. Furthermore, neoadjuvant therapy given before resection is now used increasingly for various tumors, such as those of the breasts, rectum, esophagus, and head and neck. Accurate evaluation during the first cycle of therapy may assist in determining when such treatment should be terminated and surgery should be performed or other approaches should be considered. 18F-FDG is now being evaluated for treatment response measurement, but it is clear that this is an area in which cell proliferation imaging may be particularly useful, because changes in proliferation may precede changes in tumor energy metabolism.
It should also be noted that cell proliferation imaging is likely to have an important role in the identification and development of new anticancer treatments. The best methods for that purpose may differ from those most suited for clinical applications; for example, rigorous measurement of DNA synthesis with dynamic 11C-TdR scanning and compartmental modeling may play a role in drug development.
Proliferation tracers for use in imaging, including 11C-TdR and its analogs, have undergone years of preclinical study, and clinical development is now proceeding rapidly. The work to date has consisted mainly of studies with animals and pilot studies with human patients. The imaging community must now perform the laborious multicenter trials necessary to demonstrate the utility of these tracers in clinical practice. Because it is expected that the primary role of cell proliferation imaging will be measuring treatment responses, such trials will require careful coordination with various courses of therapy. Large, multicenter trials with 18F-FDG for treatment response assessment have just now begun. Researchers must begin in earnest to foster such trials for cell proliferation markers.
Footnotes
-
COPYRIGHT © 2008 by the Society of Nuclear Medicine, Inc.
References
- 1.↵
- 2.↵
- 3.↵
- 4.↵
- 5.↵
- 6.↵
- 7.↵
- 8.↵
- 9.↵
- 10.↵
- 11.↵
- 12.↵
- 13.↵
- 14.
- 15.↵
- 16.↵
- 17.
- 18.↵
- 19.↵
- 20.
- 21.↵
- 22.↵
- 23.↵
- 24.↵
- 25.↵
- 26.↵
- 27.
- 28.↵
- 29.↵
- 30.↵
- 31.↵
- 32.↵
- 33.↵
- 34.
- 35.↵
- 36.↵
- 37.↵
- 38.↵
- 39.↵
- 40.↵
- 41.↵
- 42.↵
- 43.↵
- 44.↵
- 45.↵
- 46.↵
- 47.↵
- 48.↵
- 49.↵
- 50.↵
- 51.↵
- 52.↵
- 53.↵
- 54.
- 55.↵
- 56.↵
- 57.
- 58.↵
- 59.↵
- 60.↵
- 61.↵
- 62.↵
- 63.↵
- 64.↵
- 65.↵
- 66.↵
- 67.↵
- 68.↵
- 69.↵
- 70.↵
- 71.↵
- 72.↵
- 73.↵
- 74.↵
- 75.↵
- 76.↵
- 77.↵
- 78.↵
- 79.↵
- 80.↵
- 81.
- 82.↵
- 83.↵
- 84.↵
- 85.↵
- 86.↵
- 87.↵
- 88.↵
- 89.
- 90.↵
- 91.↵
- 92.↵
- 93.↵
- 94.↵
- 95.↵
- 96.↵
- 97.↵
- 98.↵
- 99.↵
- 100.↵
- 101.↵
- 102.↵
- 103.↵
- 104.
- 105.↵
- 106.↵
- 107.↵
- 108.↵
- 109.↵
- 110.↵
- 111.↵
- 112.↵
- 113.↵
- 114.↵
- 115.↵
- 116.↵
- 117.↵
- 118.↵
- 119.↵
- 120.↵
- 121.↵
- 122.↵
- 123.↵
- 124.↵
- 125.↵
- 126.↵
- 127.↵
- 128.↵
- 129.↵
- 130.↵
- 131.↵
- 132.↵
- 133.↵
- 134.↵
- 135.↵
- 136.↵
- Received for publication August 15, 2007.
- Accepted for publication October 29, 2007.


Jump to section
Related Articles
Cited By...
- The role of FDG-PET in defining prognosis of Hodgkin lymphoma for early-stage disease
- 18F-FLT PET During Radiotherapy or Chemoradiotherapy in Head and Neck Squamous Cell Carcinoma Is an Early Predictor of Outcome
- Small-Animal PET: What Is It, and Why Do We Need It?
- Quantitative, Simultaneous PET/MRI for Intratumoral Imaging with an MRI-Compatible PET Scanner
- Selective CDK4/6 inhibition with tumor responses by PD0332991 in patients with mantle cell lymphoma
- Evaluation of 4'-[Methyl-11C]Thiothymidine in a Rodent Tumor and Inflammation Model
- 4'-[Methyl-11C]-Thiothymidine PET/CT for Proliferation Imaging in Non-Small Cell Lung Cancer
- How Many PET Tracers Do We Need?
- Discriminant Analysis of 18F-Fluorothymidine Kinetic Parameters to Predict Survival in Patients with Recurrent High-Grade Glioma
- Hyperpolarized 13C MRI and PET: In Vivo Tumor Biochemistry
- Whole-Body Distribution and Brain Tumor Imaging with 11C-4DST: A Pilot Study