


Abstract
For a PET agent to be successful as a biomarker in early clinical trials of new anticancer agents, some conditions need to be fulfilled: the selected tracer should show a response that is related to the antitumoral effects, the quantitative value of this response should be interpretable to the antitumoral action, and the timing of the PET scan should be optimized to action of the drug. These conditions are not necessarily known at the start of a drug-development program and need to be explored. We proposed a translational imaging activity in which experiments in spheroids and later in xenografts are coupled to modeling of growth inhibition and to the related changes in the kinetics of PET tracers and other biomarkers. In addition, we demonstrated how this information can be used for planning clinical trials. Methods: The first part of this concept is illustrated in a spheroid model with BT474 breast cancer cells treated with the heat shock protein 90 (Hsp90) inhibitor NVP-AUY922. The growth-inhibitory effect after a pulse treatment with the drug was measured with digital image analysis to determine effects on volume with high accuracy. The growth-inhibitory effect was described mathematically by a combined Emax and time course model fitted to the data. The model was then used to simulate a once-per-week treatment; in these experiments the uptake of the PET tracers 18F-FDG and 3′-deoxy-3′-18F-fluorothymidine (18F-FLT) was determined at different doses and different time points. Results: A drug exposure of 2 h followed by washout of the drug from the culture medium generated growth inhibition that was maximal at the earliest time point of 1 d and decreased exponentially with time during 10–12 d. The uptake of 18F-FDG per viable tumor volume was minimally affected by the treatment, whereas the 18F-FLT uptake decreased in correlation with the growth inhibition. Conclusion: The study suggests a prolonged action of the Hsp90 inhibitor that supports a once-per-week schedule. 18F-FLT is a suitable tracer for the monitoring of effect, and the 18F-FLT PET study might be performed within 3 d after dosing.
A range of new compounds is being developed as anticancer treatment, acting at novel molecular targets. Many of these targets are included in the signaling pathways; the therapy aims at disrupting cascades that drive tumor growth, but this does not necessarily lead to eradication of the cancer.
Key issues in the early clinical-development phases of such novel drugs include finding the right dose, the right dose scheduling, and the right combination treatment. It is costly and time-consuming to use clinical outcomes in clinical trials to optimize treatment because of the large variability in individual tumor growth rates and response to treatment. Lack of information on optimal biologic dose leads to efficacy trials performed at the maximum tolerated dose, with possibly unnecessary high doses and side effects to the patient. When a trial fails to show efficacy for a drug as a single agent, the question is raised of whether the target or signaling pathways were sufficiently inhibited. Extensive efforts are, therefore, being made to search for suitable biomarkers that can guide in the selection of an optimal dose and schedule.
One emerging class of biomarkers is imaging biomarkers, in which PET allows recording of cellular physiology as a consequence of action on relevant pathways (1–4). These biomarkers have some considerable advantages in cancer drug development: they are noninvasive, can be repeated, and allow assessment of the whole tumor burden in the body.
Repeatability of biomarker assessment is especially important with the new class of targeted anticancer drugs, because each drug administration typically induces an effect on biomarkers that is transient. This transient effect is more difficult to observe with invasive biomarkers such as an assay in a biopsy or a surgical sample. In most instances, it is ethically or logistically not possible to obtain more than 1 pretreatment sample and 1 or occasionally 2 follow-up samples after treatment. Additionally, the overall compliance is usually low. With a transient effect on the biomarkers, the timing of the sampling becomes crucial. A sample taken too early or too late might miss the induced effect. Thus, it is important to have an estimate of the duration of effect on cellular events to determine a suitable drug dose and scheduling.
In this study, we propose a translational imaging and modeling path to follow from cell culture studies via animal models and into humans to be as rational and predictive as possible for inclusion of imaging biomarkers and for guidance of invasive biomarkers.
The model builds on an interactive relationship between experimentation and modeling (Fig. 1) in which experimental data are used to build portions of a biologic or pharmacologic model of tumor growth and drug effects on growth and biomarkers. The model then guides the performance of the next set of experiments, which is designed to strengthen the model. The results of the experiment are used to refine the model, and so on. This interactive path spans through cell experiments into animal studies and finally guides the planning of the human trial, which includes aspects that aim to confirm or refine the model. In all parts of the concept, it is important to understand not only the dose dependence but also the temporal aspects of effects of treatment.

Proposed translational model in which interactive experiments with biomarker readouts are included in successively refined mathematic biologic or pharmacologic model. This concept is pursued from cellular studies, via xenografts, to plan and interpret human trial data.
The first part of this concept is illustrated by studies performed in multicellular cell aggregates (i.e., spheroids) (5–9). This cell culture mode was selected because it mimics better the cellular physiology of in vivo tumors than do monolayer cells, allows an easy application of pulse treatment or drug exposure mimicking the in vivo exposure, allows follow-up of drug effects during a longer time span than do monolayer cells (typically days to weeks), is practical for evaluation of effects on growth, is practical for application of PET tracers, and allows an assessment of PET tracer uptake and an evaluation of secreted or tissue biomarkers in the same sample.
The drug we selected, NVP-AUY922, is a highly potent inhibitor of heat shock protein 90 (Hsp90), which is currently undergoing phase I/II clinical trials in cancer patients This drug has a nanomolar inhibitory concentration of 50% of Hsp90 and inhibits the proliferation of a broad panel of tumor cell lines at low nanomolar concentrations (10). The concentration required for 50% inhibition of cell growth for BT474 in monolayer cells is 2.8 nM. The full results of the experiment are available separately (Monazzam et al., unpublished data, 2007). The present study illustrates the modeling of these data.
MATERIALS AND METHODS
Cell Culture
BT474 (breast cancer) cells were obtained from American Type Culture Collection and grown in Dulbecco's modified Eagle's medium–high glucose supplemented with 10% fetal calf serum, 1 mM sodium pyruvate, 2 mM l-glutamine, and 5% penicillin (Tamro). The tumor cells were trypsinized from the stem monolayer culture. To generate multicellular spheroids, cell suspensions were then seeded in 24-well, 1% agarose-coated culture plates, with approximately 10,000 cells per well. The cultures were kept at 37°C with 5% CO2 and grown for 6 d before the start of the experiments to ensure adequate formation of spheroids.
Treatment
The treatment consisted of a 2-h exposure of the cells to NVP-AUY922 at concentrations of 0, 0.05, 0.1, 0.2, 0.3, 0.5, and 1 μM. Thereafter, the spheroids were gently removed with a course pipette to wells with medium without drug and washed 3 times by sequential moving of the spheroids to new wells. Growth in drug-free medium was recorded for up to 16 d; medium was changed twice per week. The experiments were repeated 3 times and included 18 spheroids for each data point overall.
Measurement of Growth
To evaluate growth, a special procedure was used with digital microscope photos taken about every second day. An automatic image analysis program determined the outer contour and the inner contour of the border between viable cell layer and central necrosis (11). The total spheroid volume and the volume of central necrosis were determined on the basis of the assumption that the third diameter was equal to the diameter of a circle giving the same area as observed in the image. The volume of viable cells was determined as the difference between total volume and necrosis volume. The volume as percentage of starting volume was determined for each aggregate and averaged across the aggregates with the same treatment.
Mathematic Description of Growth
The growth of untreated spheroids in the exponential growth phase can be described as: Eq. 1where α0 is the exponential for normal growth, V(t) is the volume of viable cells at time t, V0 is the starting volume at the start of the experiment, and t is the time after the start of the experiment.
To include the effects of treatment, additional factors β and p · Dq were introduced by substituting α0 with: Eq. 2
Eq. 2
The growth inhibition term β was described by: Eq. 3This assumes that the growth inhibition is described by an Emax model with βmax being the maximum factor for inhibition; E, an equivalent exposure factor; EC50, the equivalent exposure factor giving half maximum effect; and γ, a sigmoidicity factor.
The equivalent exposure factor is given by: Eq. 4where D is the exposure, in this case the drug concentration during the 2-h exposure, and r and s are factors describing the time course of the effect exerted by the equivalent exposure.
The term equivalent exposure, rather than drug concentration, was introduced because of the lack of knowledge of the intracellular concentration and its time course, the drug availability for target interaction, the on and off rates for target interaction, and the temporal aspects of the relationship between drug action on the target and consequence for proliferation.
Using a MATLAB routine, the equations were fitted to 6 curves of spheroid growth over 12–17 d at different concentrations of the Hsp90 inhibitor NVP-AUY922. The floating parameters were r, s, βmax, γ, p, q, and α0.
PET Tracer Uptake in Spheroids
On the basis of the modeling of growth, PET experiments were included on days 1, 3, 5, and 7, after the 2-h exposure at concentrations of 50, 100, and 300 nM.
Each well with spheroid was incubated with 3 MBq 3′-deoxy-3′-18F-fluorothymidine (18F-FLT) or 18F-FDG for 50 min at 37°C; each was then washed for 5 min with medium (1 mL/well). Finally, each spheroid with 20 μL of washing medium was transferred to 5-mL tubes, and tracer uptake was measured in a calibrated well γ-counter. A 20-μL sample of the incubation medium was measured as reference, and 20 μL from the last wash medium was measured as background control.
The effect on tracer uptake in the spheroids was defined as: where U0 represents radioactivity–to–viable volume (Bq/mm3) of spheroids without treatment and UD represents radioactivity–to–viable volume (Bq/mm3) of spheroids with treatment.
RESULTS
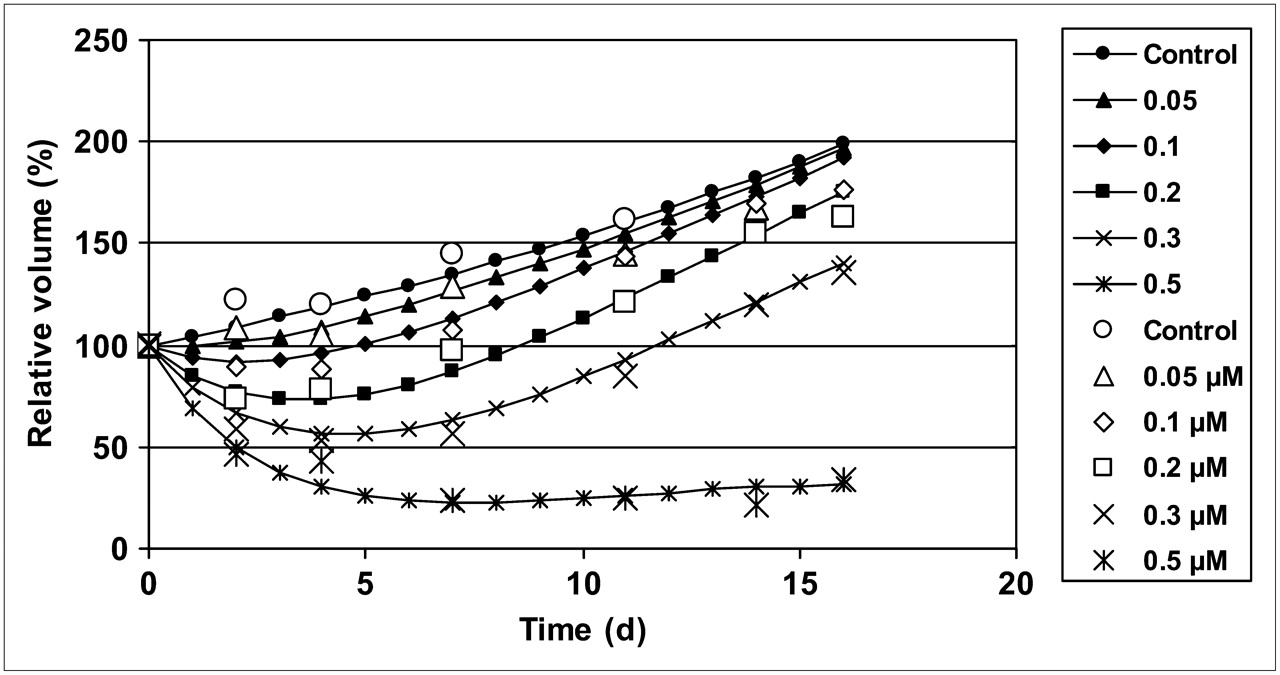
The viable volume of untreated spheroids grew almost exponentially, with a doubling time of 17 d (Fig. 2). This growth is significantly slower than that of monolayers, where the doubling time is 1–2 d.

Experimental data on growth of viable volume of spheroids without and with 2-h pulse treatment with NVP-AUY922 at different concentrations. Data are normalized to pretreatment volume. Error bars indicate SEM.
After a pulse treatment with NVP-AUY922, a dose-dependent retardation or inhibition of growth was exhibited, which at higher doses was seen as a decrease in absolute volume during a few days, followed by a regrowth after 3–11 d, depending on drug concentration. For the highest concentration of 1 μM, no regrowth was demonstrated, even 16 d after treatment. After 11 d, the control and low-dose–treated spheroids started to crumble, and the follow-up was discontinued.
Because the data from the highest concentration, 1 uM, demonstrated aberrant behavior, these were removed in the further processing.
The fitting of Equations 1–4 to the experimental data resulted in an adequate fit (Fig. 3) with the parameters α0 = 0.043 d−1, giving a doubling time of 16 d; βmax = 0.42 d−1, giving a maximum rate of reduction with a half-life of 1.7 d; EC50 = 0.18 μM; γ = 1.4; r = 0.20 d−1; s = 13 d−1; p = 1.5; and q = 4.0. These values suggest a maximum growth-inhibitory effect during the first day after drug exposure and a terminal half-life of equivalent exposure of 3.5 d.
Experimental data of spheroid growth (points) are fitted to mathematic model (full lines).
The fitted data corresponded to the experimental data with a maximum deviation of 13% and an average deviation (no signs) of 4.5%. The average SEM for the experimental data was 4.4%.
The relative growth inhibition β(t) + p × Dq, equal to –(dV/dt/V – α0), had a maximum at the first time point after treatment, with a magnitude that decreased with a dose-dependent half-life of 2.5–7.5 d (Fig. 4).
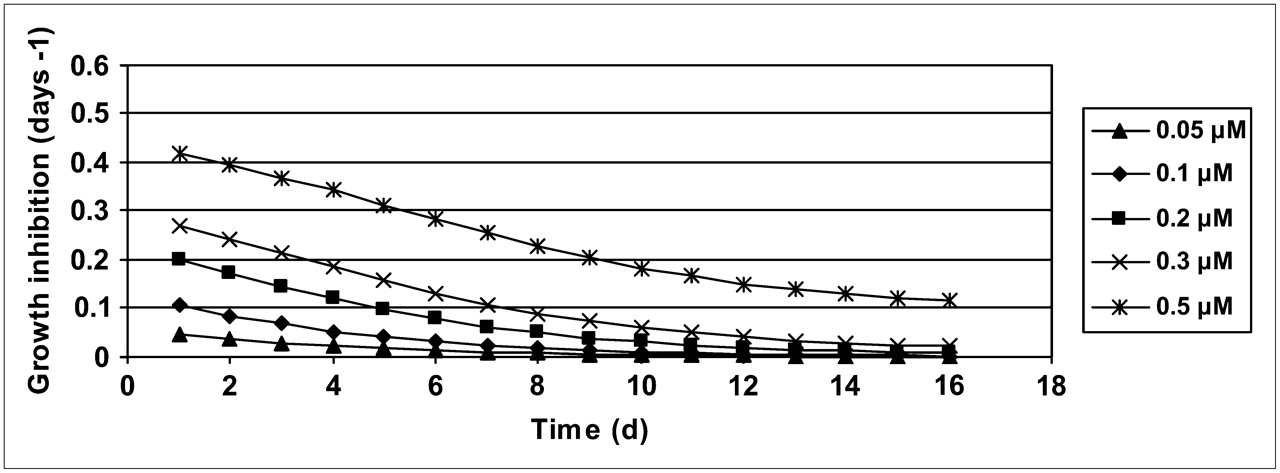
Growth inhibition as extracted from model is plotted vs. time after exposure, for different exposures.
On the basis of the acquired results, the potential of a once-per-week treatment was simulated (Fig. 5). These simulated data suggested that a once-per-week dosing with 200 nM exposure during 2 h would lead to an almost stationary volume of the spheroids, whereas 100 nM would allow continued growth with a doubling time of 22 d. A dose of 300 nM should lead to a gradual decrease in volume.
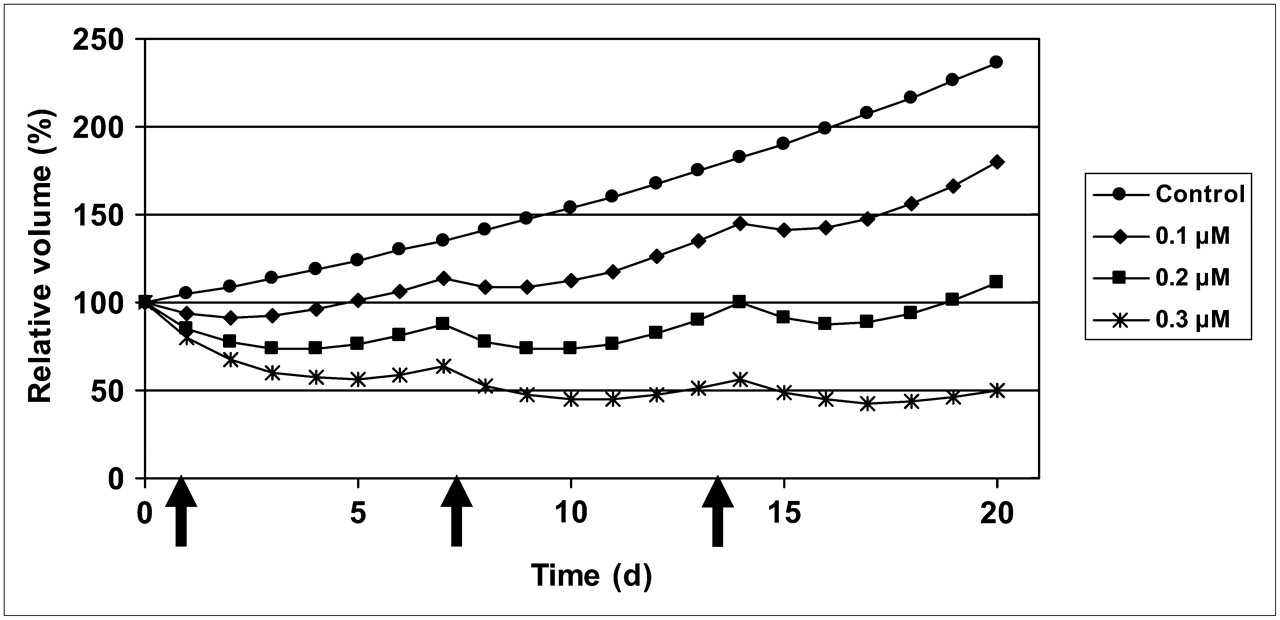
Based on model, growth patterns are simulated with once-per-week treatment schedule, for 3 different exposures.
Multicellular tumor spheroids were then treated according to this concept, and the predicted growth inhibition pattern was confirmed.
The relative growth inhibition, as calculated from the model, suggested a slow normalization during 9–11 d after a pulse treatment, and therefore experiments with biomarkers were planned for acquiring data at 1, 3, 5, and 7 d.
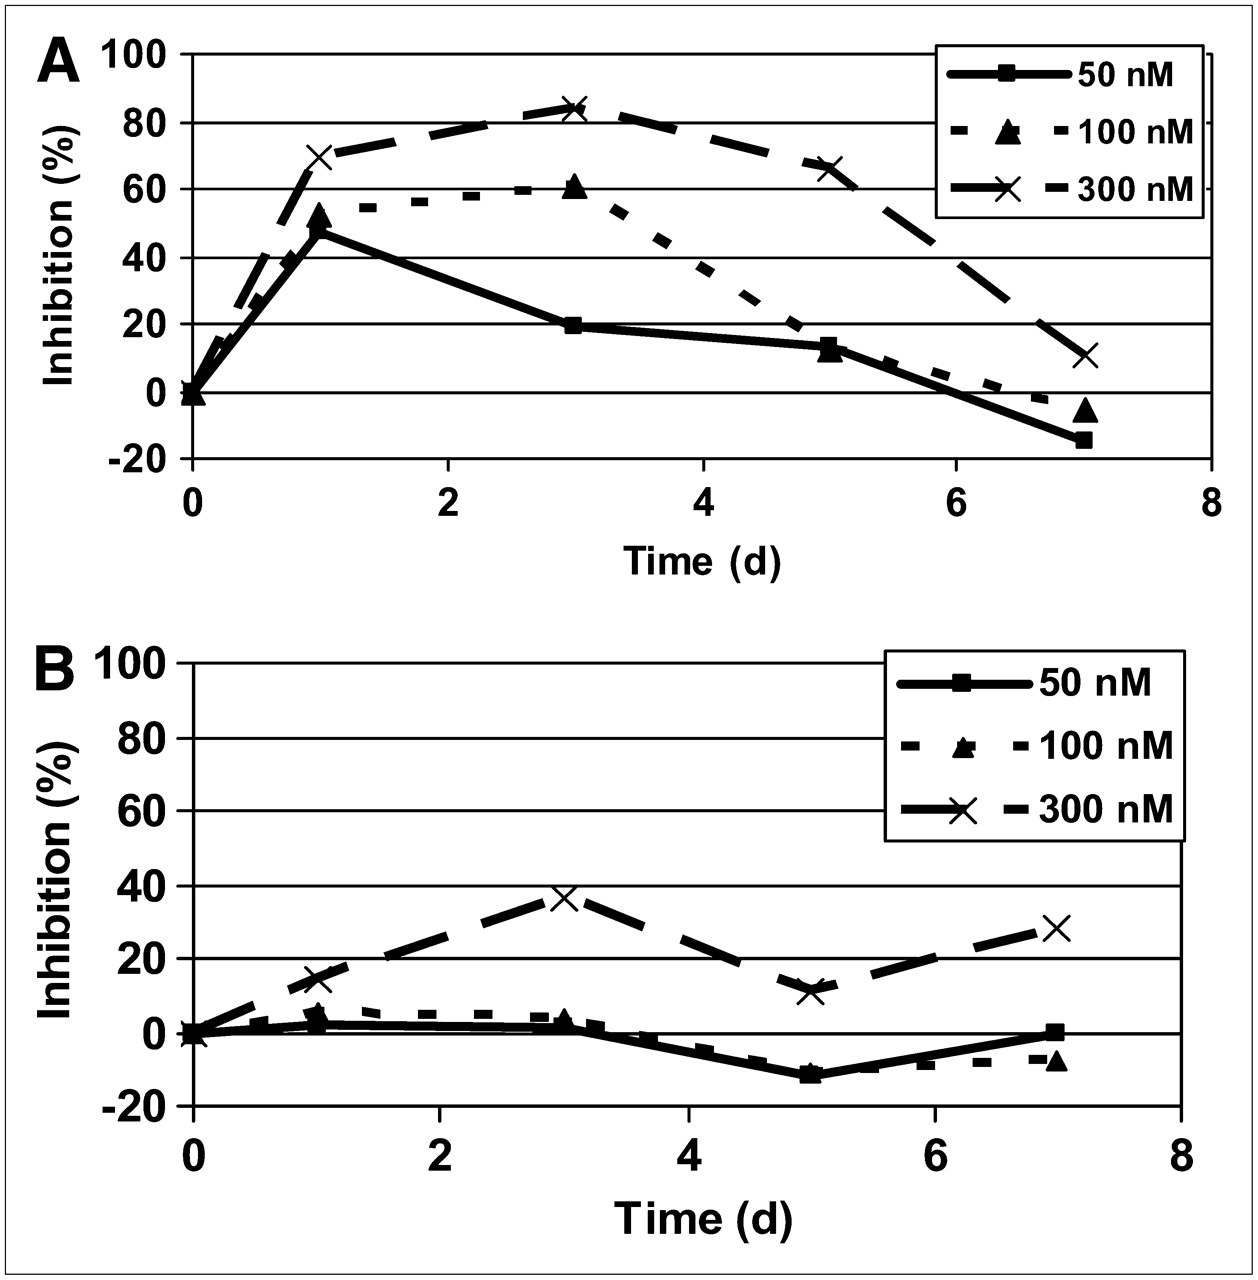
The data from the 18F-FLT and 18F-FDG studies (Fig. 6) show marginal effects by the drug on the uptake of 18F-FDG, except at the highest dose of 0.3 μM, in which a 25% inhibition occurred without a clear time course. A clear dose-dependent inhibition of uptake of 18F-FLT was observed, with a maximum effect seen at 1–3 d after treatment, in accordance with the simulated data on growth inhibition. 18F-FLT returned to normal after about 6–7 d. The experimental data showed that the total viable volume decreased with drug treatment, and this cannot be ascribed to a mere inhibition of proliferation but must be attributed to induction of cell death, either as a direct cell-killing effect or via apoptosis.

Drug effect on 18F-FLT (A) and 18F-FDG (B) uptake at different times after pulse treatment with 3 different exposures.
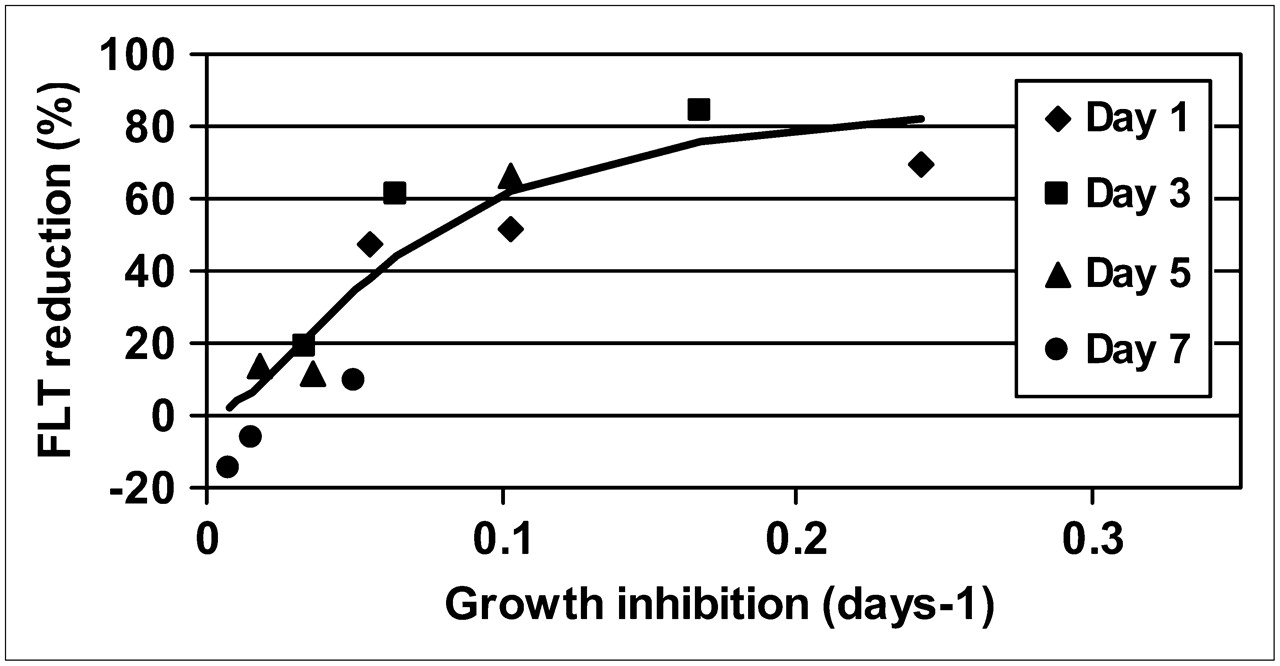
If the degree of reduction of 18F-FLT uptake is plotted against the momentary growth inhibition as obtained through the modeling, a distinct pattern is seen, irrespective of which day after treatment the evaluation was made (Fig. 7). The data closely follow a sigmoid pattern, with a 50% inhibition at 0.06 d−1, an extrapolated maximum inhibition of 90%–100%, and a sigmoidicity factor of 1.8.

Induced reduction of 18F-FLT uptake plotted against derived growth inhibition for all different time points and dose exposures. Full line indicates fitted sigmoid curve.
DISCUSSION
In the present work we illustrate the first steps of the potential to design and implement a translational plan for the performance of the PET scanning in early human trials with a new anticancer agent.
This translational plan builds initially on the need to select a PET tracer suitable for studying the cellular effects of the specific treatment. Even if the drug under study is antitumoral, it might not be possible to predict which specific PET tracer could reveal and demonstrate the response. An empiric approach with experimental data is needed for this selection.
Multiple studies have shown that 18F-FDG can show effects early after initiation of chemotherapy (i.e., as early as 2–4 wk after initiation of treatment (1,2)). In rare cases, this effect can be observed within hours (e.g., as for gastrointestinal stromal tumors treated with imatinib (12)). The slower reduction of 18F-FDG uptake that relates to later clinical effect has been suggested to correlate with the decrease in number of viable cells rather than the 18F-FDG uptake effect on each individual cell. Some studies have clearly demonstrated that the uptake of 18F-FLT may better and earlier indicate antitumoral effects, and in some cases a clear reduction of 18F-FLT uptake is seen without corresponding effect on 18F-FDG uptake (3,4). Hence, it is clear that different PET tracers monitor different cellular interactions between drug and signaling cascades and might therefore have differing sensitivities to monitoring treatment effects, especially in the early phases. The mechanistic link between the drug action on the target and the consequences on the mechanism promoting PET tracer uptake is complicated and might not be known beforehand and might not necessarily overlap in between different PET tracers.
We have therefore previously advocated an empiric approach, in which the appropriate PET tracer is selected on the basis of cellular uptake studies performed in a spheroid cell culture model (8,9). The model presented here is optimized for this type of in vitro work.
The spheroid culture model is suggested as the initial step in choosing the relevant PET tracer for a specific indication. However, for a translation to the clinical scenario this PET tracer choice needs to be verified in a relevant animal model and eventually confirmed in a clinical trial.
The PET tracer experiments performed in the present study clearly indicate that 18F-FDG is not suitable for the immediate recording of effects of NVP-AUY922 in BT474 breast cancer. No effect is seen on the uptake per viable cell volume at doses at which a significant antitumoral effect occurs. However, this does not exclude the possibility of using 18F-FDG to record effects, but only at a later stage and with the aim to quantitate viable tumor cells.
18F-FLT, however, seems suitable for recording the antitumoral effect by NVP-AUY922. A significant reduction of 18F-FLT uptake per volume of viable cells is seen, which overall follows the growth inhibition. In fact, a clear relationship between growth inhibition and reduction of FLT uptake is seen, following a sigmoid relation. This would imply that reduction in 18F-FLT uptake can be translated into degree of reduction of growth rate. Hence, 18F-FLT may indeed be a valid biomarker that can support a better understanding of the drug effects and guide the suitable selection of a dosing scheme. Additionally, this tracer should be tested for its suitability to probe the treatment effect on the individual patient level and guide the continuation or cessation of drug treatment.
In vivo, there may be factors in addition to a change in degree that govern the kinetics and uptake of the tracer; specifically, there may be changes in the elimination and metabolism of the tracer.
It is clear from the spheroid experiments, where higher doses lead to reduced viable tumor volume, that inhibition of proliferation cannot be the only factor determining the effects of the drug. We suggest that the antitumoral effect is exerted by a combination of antiproliferation and induction of apoptosis. In fact, additional biomarker studies in the same experiments demonstrated a clear increase in biomarkers for apoptosis (Monazzam et al., unpublished data, 2007). Because apoptosis is an integral component of the antitumoral effects of the drug, the availability of an apoptosis imaging agent would be highly desirable.
This article aimed to cover another aspect of the use of PET as a biomarker, that is, the suitable timing to perform the PET scan as it related to the time course of the action of the drug. To identify the most suitable monitoring time point, it is necessary either to have knowledge of the initiation and duration of the antitumoral effects or to rely on an educated guess or hypothesis. We believe that the preclinical studies can guide such a decision. The strategy we recommend may also guide an understanding of the underlying mechanisms of drug action on tumor growth, as well as drug action on the imaging biomarker. Effects on tumor growth of anticancer agents are commonly narrowed to either the inhibition of the cell cycle and cellular growth or to apoptotic and cell-killing effects. The discrimination between the 2 pathways might eventually lead to the optimization of the use of the drug and suggest hypotheses guiding the selection of combination-therapy candidates.
Because cellular effects are both dose-dependent and time-dependent, a multitude of experiments are required to elucidate these aspects. For practical and economic reasons, it is advantageous to have a guiding biologic or physiologic mathematic model that can be used for interpolations, extrapolations, and simulations. Thus, we advocate the implementation of a model simulating growth and drug effects on growth. This model should adaptively guide the experiments, and the experimental results from the model should be used interactively to refine the model.
Previously, several models have been proposed to describe the growth of spheroids. The most common is the Gompertz model, which fits data from the early phases of spheroid consolidation via the exponential growth phase to the plateau before collapse of the spheroids (13). However, this model does not include the temporal aspects of drug treatment. We have therefore extended the standard models to include time-variant effects on growth and an Emax model to consider the potential of saturation of that action on the target, as can be assumed to be the case with drugs acting on receptors or enzymes. Because more than 1 phenomenon is involved, and because the simplest model did not provide the best fit, an arbitrary factor p × Dq was added. This model builds on and extends various previous models without or with time dependence and applied to monolayers, spheroids, or xenografts (14–20).
The model used here gives a good fit to data, with a maximum deviation of 13% and an average deviation equal to the SEM of the experimental data.
The parameters of the modeling should not be interpreted strictly pharmacologically and biologically; instead we used them primarily as a means to describe, but not explain, our data. When a reasonable fit was found, we derived the pattern of growth inhibition from the curves instead of by using the parameters. Once further experiments are performed with specific observation of proliferation and apoptosis, it should be possible to define a more biologically relevant model. Additionally, the intracellular pharmacokinetics and drug-interaction kinetics with the target should be explored. This is readily done with available 14C-labeled drugs and a specific tracer for the target system. Such experiments were done with NVP-AUY922 and the Hsp90 target (Monazzam et al., unpublished data, 2007).
The experimental results and the modeling based on a single exposure allowed a simulation of a once-per-week exposure. This was further confirmed in new experiments. The model suggests that the maximum growth-inhibitory effect of the drug appears soon after the pulse treatment and has a long duration of up to 10 d, after which the spheroids attain a growth that is similar to the growth of untreated spheroids. The reason for this prolonged effect of the drug after a pulse treatment is not yet known. One explanation is that the drug remains for a long time within the tumor cells. This is indeed the case (Monazzam et al., unpublished data, 2007), but ongoing studies have indicated that the target inhibition remains for fewer than 3 d. One alternative hypothesis is that recovery from inhibition of Hsp90 relies on new synthesis of the protein. Finally, because one of the known mechanisms of action by Hsp90 inhibitors is the degradation of client proteins such as HER2, some of which may be essential to tumor growth, it is plausible that the regrowth relies on new synthesis of such client proteins (21). However, more studies are needed to fully understand the mechanisms behind this long duration of action of the drug.
The relative effects of the drug on growth between the spheroid model and in vivo in xenografts correlate in general terms and in dose and time dependence (data not shown). However, the absolute values of exposure in spheroids and in vivo do differ. The dose in animals that inflicts tumor stasis is about 10 mg/kg intravenously. This translates to an exposure in plasma of about 2.6 h × μmol/L, whereas the exposure in the spheroids giving tumor stasis is about 0.5 h × μmol/L. The in vivo half-life of the drug in plasma is 0.27 h during the first half hour. The short half-life in plasma, coupled with a usually impaired perfusion in tumors and the more complex architecture of tumor capillaries, might explain this discrepancy. Moreover, the xenograft tumors become more necrotic during growth, and this necrosis is included in the in vivo measurements of tumor volume but not in the measurements of spheroids.
The article builds on a large set of experiments, but only in 1 cell line and with 1 drug with its specific target, Hsp90. One can, therefore, question the generality of the approach. However, some of the experiments were additionally performed in 3 other cell lines: MCF-7 (breast cancer), U87MG (glioma), and HCT116 (colon cancer). These cells lines differed significantly in sensitivity, but the relative sensitivity in spheroids correlated with the sensitivity in xenografts but not with monolayers (data not shown). Whether the proposed method is applicable to agents with other targets remains to be seen. The method can be proven only by full translational studies, including verification in humans.
Although we believe that a translational approach from spheroids to xenografts is possible and feasible, the translation of exposure needs further work. We have, for practical reasons, not yet pursued the PET studies in xenografts but instead ensured an inclusion of PET in the clinical trial, building on the knowledge from the spheroid experiments.
Acknowledgments
This work was supported by a grant from Novartis Exploratory Development. The support from Greg Burke and Jean-Jaques Garaud at Novartis is acknowledged.
Footnotes
-
COPYRIGHT © 2008 by the Society of Nuclear Medicine, Inc.
References
- Received for publication January 17, 2008.
- Accepted for publication March 18, 2008.


Jump to section
Related Articles
Cited By...
- 17-Allylamino-17-demethoxygeldanamycin-induced Changes in [18F]Fluorothymidine Uptake
- 89Zr-trastuzumab and 89Zr-bevacizumab PET to Evaluate the Effect of the HSP90 Inhibitor NVP-AUY922 in Metastatic Breast Cancer Patients
- FLT-PET Is Superior to FDG-PET for Very Early Response Prediction in NPM-ALK-Positive Lymphoma Treated with Targeted Therapy
- Radiopharmaceuticals in Preclinical and Clinical Development for Monitoring of Therapy with PET