


Abstract
H+/peptide transporter, PEPT1, is functionally expressed in some human cancer cell lines and might be a candidate molecular target for detection of cancers in vivo using PET. The aim of the present study was to establish a novel tumor-imaging technology using a PET tracer targeted to H+/peptide transporter(s). We also compared the tracer with 18F-FDG, focusing on the specificity of their accumulation between tumor and inflammatory tissues. Methods: A dipeptide PET tracer, 11C-glycylsarcosine (11C-Gly-Sar), was injected intravenously into athymic mice transplanted with human pancreatic, prostate, and gastric cancer cells. The distribution patterns of 11C-Gly-Sar and 18F-FDG in the tumor-bearing mice, and in mice with inflammatory tissue, were assessed by imaging with a positron planar imaging system (PPIS). Tissue distributions of tracer radioactivity were also measured. The expression levels of PEPT1 and PEPT2 (PEPTs) proteins in tumor xenografts and inflammatory tissue were examined by immunohistochemical analysis. The messenger RNA expression levels of PEPTs in 58 available cancer cell lines were quantified by means of real-time polymerase chain reaction. Results: All 3 tumor xenografts were well visualized with the PPIS after injection of 11C-Gly-Sar. Expression of PEPTs in those xenografts was confirmed by immunohistochemical analysis. Tumor-to-blood concentration ratios of 11C-Gly-Sar increased in a time-dependent manner and were much higher than unity. Most of the radioactivity found in the tumor tissue was recovered as the intact tracer. These results indicated that 11C-Gly-Sar was taken up by the PEPTs in tumor xenografts. It is noteworthy that 11C-Gly-Sar was minimally present in inflammatory tissues that expressed no PEPT1 or PEPT2 protein, whereas 18F-FDG was highly accumulated, with the values of the selectivity index being >25.1 and 0.72 for 11C-Gly-Sar and 18F-FDG, respectively. The mRNAs of PEPT1 and PEPT2 were expressed in 27.6% and 93.1%, respectively, of the cancer cell lines examined in the present study. Conclusion: The present study indicates that 11C-Gly-Sar is a promising tumor-imaging agent and is superior to 18F-FDG for distinguishing between tumors and inflammatory tissue. Because PEPTs were ubiquitously expressed in various types of tumor cells examined, 11C-Gly-Sar could be useful for the detection of many types of cancers.
- H+/peptide transporter
- PEPT1
- PEPT2
- peptide transport activity
- dipeptide PET tracer
- 11C-glycylsarcosine
- cancer detection
The H+/peptide transporters (PEPTs) PEPT1 (SLC15A1) and PEPT2 (SLC15A2) are members of the proton-coupled peptide transporter SLC15A family. In healthy humans, expression of PEPT1 is restricted to the small intestinal epithelial cells, the brush-border membrane of epithelial cells in the kidney proximal tubule S1 segment, and the apical membrane of bile duct epithelial cells (1). PEPT1 has enormous potential as an oral drug delivery target, because it also mediates the intestinal absorption of peptide-mimetic and nonpeptide substrates, in addition to numerous peptides derived from dietary proteins (2,3). A higher-affinity isoform, PEPT2, is localized in the brush-border membrane of S2 and S3 segment cells of the proximal tubule, lung, mammary gland, and choroid plexus, as well as in glial cells in the central nervous system (4). PEPT2 also transports various peptides and peptide-mimetics (5). One of the peptide-mimetics, 5-aminolevulinic acid, which has been used as a photosensitizer and also to guide the surgical resection of glioblastoma multiforme (6), is a substrate of PEPT1 (7) and PEPT2 (8). Antitumor agent ubenimex ((−)-N-[-(2S,3R)-3-amino-2-hydroxy-4-phenylbutyryl]-l-leucine), which induces apostosis in glioma (9), is also a substrate of PEPTs (10). In our previous study, repeated oral Ubenimex administration dramatically suppressed the growth of HeLa cells expressing human PEPT1 inoculated into mice (11). These observations suggest that PEPTs could be responsible for peptide transport activity in cancer cells.
We have previously reported that a peptide transport activity exists in the human fibrosarcoma cell line HT1080 but does not exist in the normal fibroblast cell line IMR-90 cells (12). Gonzalez et al. reported that human pancreatic carcinoma cell lines AsPC-1 and Capan-2 also possess peptide transport activity and express PEPT1 (13). Subsequently, our group (11) and Knütter et al. (14) reported that human gastric cancer cell line MKN45, human osteosarcoma cell line MG-63, human bladder cancer cell line T24, and human extrahepatic cholangiocarcinoma cell line SK-ChA-1 also exhibit peptide transport activity. These findings suggest that the PEPTs may be a promising target for cancer imaging using PET.
It is noteworthy that many PET tracers used for cancer detection are thought to be substrates of specific transporters. For example, 18F-FDG is a substrate of GLUT1 (SLC2A1) (15,16). 3′-Deoxy-3′-18F-fluorothymidine (18F-FLT), a thymidine analog, is a substrate of ENT1 (SLC29A1) (17). Tyrosine derivatives, such as O-(2-18F-fluoroethyl)-l-tyrosine and O-11C-methyl-l-tyrosine (18,19), may be substrates of LAT1 (SLC7A5) coupled with 4F2hc (SLC3A2) (20). These examples suggest that strategies using novel PET tracers targeting transporters expressed in tumors have potential value for cancer detection.
We hypothesized that PEPTs would be a suitable target for cancer detection using a peptide-based PET probe. Such a peptide-based PET probe may also be useful to distinguish tumors from inflammatory tissues, because, to our knowledge, there is no report of peptide transport activity in inflammatory tissues. Therefore, we examined the feasibility of using the peptide transport activity in cancer cells for imaging the tumors in tumor-bearing mice. Because the tissue localizations of PEPTs in mice are similar to those in humans (21–24), mice were expected to be a suitable model to evaluate peptide tracer characteristics. Recently, 11C-glycylsarcosine (11C-Gly-Sar) was reported as a PET tracer that can evaluate PEPT function (25). We describe here the use of 11C-Gly-Sar as a PET tracer targeted to the PEPTs for cancer detection in mice.
MATERIALS AND METHODS
Animals and Cells
Male athymic mice (CAnN.Cg-Foxn1nu/CrlCrlj) were obtained from Charles River Laboratories Japan, Inc. CRL-1682 AsPC-1 cells (American Type Culture Collection [ATCC]) were cultured in RPMI+GlutaMAX medium (Invitrogen Japan K.K.) containing 10% fetal bovine serum (Hyclone), 2 mM glutamine, 10 mM N-(2-hydroxyethyl)piperazine-N′-(2-ethanesulfonic acid) (HEPES), 1 mM sodium pyruvate, and 1.5 g/L bicarbonate. CRL-1435 PC-3 cells (ATCC) were cultured in F12 Kaighn's medium (Invitrogen) containing 10% fetal bovine serum. JCRB0254 MKN45 cells (Japanese Collection of Research Bioresources [JCRB] Cell Bank) were cultured in RPMI+GlutaMAX (Invitrogen) containing 10% fetal bovine serum. Other cell lines were obtained from the Cell Engineering Division of RIKEN BioResource Center.
Transplantation
The cells for xenotransplantation were grown to 95% confluence and then trypsinized (TrypLE Express; Invitrogen), and the single-cell suspension was centrifuged at 90g at 4°C for 5 min. The cell pellet was suspended directly with ice-cold PBS(−) (Invitrogen), which was followed by addition of the same volume of ice-cold liquid Matrigel (Becton-Dickinson). Adult mice (5 wk old) were injected subcutaneously with 5 × 10⁶ AsPC-1 cells or 1 × 10⁶ PC-3 and MKN45 cells and maintained for 2 wk after xenotransplantation; the mice were then used for experiments at 7 wk of age (body weight, 22.6 ± 1.5 g). Mice were maintained and handled in accordance with the recommendations of the National Institutes of Health, and animal experiments were performed in compliance with the requirements of the Animal Ethics Committee of The Medical and Pharmacologic Research Center Foundation.
Chemicals
3H-Glycylsarcosine (18.5 GBq/mmol, Moravek Biochemicals Inc.) was obtained from Daiichi Pure Chemicals Co., Ltd. Oil of turpentine was purchased from Wako Pure Chemical Industry. Novo-Heparin was purchased from Mochida Pharmaceutical Co., Ltd. All other reagents were of the highest grade available.
Synthesis of Labeled Compound
The synthesis of 11C-Gly-Sar reported by Nabulusi et al. (25) was modified slightly. The synthetic route for 11C-Gly-Sar is indicated in Figure 1. The crude intermediate 11C-1-methyl-2,5-piperazinedione was synthesized from glycylglycine ethyl ester hydrochloride using 11C-methyl triflate according to the reported method (25). The reaction mixture was purified with a high-performance liquid chromatography (HPLC) system and eluted with 25 mM NH4OAc (flow rate, 4.0 mL/min; column: DAISOPAK, SP-120-5-ODS-BP 10 × 250 mm; Daiso Chemical Co., Ltd.) to give a fraction containing 11C-1-methyl-2,5-piperazinedione, which was collected in a reaction vessel containing 5N NaOH (120 μL). The mixture was heated to 140°C for 10 min and then cooled to ambient temperature. To this solution, 0.2 M Na2HPO4 (3 mL) was added and the mixture was passed through a sterile 0.22-μm filter (Millex GV; Millipore Corp.) to give 11C-Gly-Sar as an injectable solution. The total synthesis time was 41 min from the end of bombardment. The decay-corrected radiochemical yield was 9.3%, the radiochemical purity was >97%, and the specific activity was 52.5 GBq/μmol.

Synthetic route for 11C-Gly-Sar. Synthesis of 11C-Gly-Sar as reported by Nabulusi et al. (25) was modified slightly. Asterisk denotes position of 11C labeling. DMSO = dimethyl sulfoxide.
Tissue Distribution Assay
The radiolabeled compound (0.7–29.8 MBq) dissolved in 150 μL of physiologic saline (Otsuka Pharmaceutical Factory, Inc.) was injected into each mouse through the tail vein. The animals were killed by decapitation at 5, 15, 30, and 60 min after injection; samples of blood, brain, heart, lung, liver, pancreas, kidney, bone, muscle, and tumor were rapidly removed and weighed, and the radioactivity was measured with a γ-counter (Wizard3, Wallac). Tracer uptake by various organs was quantified as dimensionless standardized uptake values (SUVs) using the formula: SUV = (Bq per gram of tissue/Bq injected per gram of body weight). For metabolite analysis of Gly-Sar, athymic mice bearing AsPC-1 cells were injected intravenously with 150 μL of 3H-Gly-Sar (185 kBq/mouse) through the tail vein. The mice were immediately decapitated 60 min after receiving the intravenous dose of 3H-Gly-Sar, and tissue samples were collected. The heparinized blood (Novo-Heparin, 5 U/mL of blood) was centrifuged to separate the plasma and weighed, and the tumor tissues were homogenized in an Ultra-Turrax T8 homogenizer (IKA-Werke GmbH & Co. KG) on ice. Acetonitrile was then added to plasma or tumor samples (sample/acetonitrile, 1:1, w/w), which was followed by centrifugation. Aliquots of 100 μL of supernatant were analyzed by reverse-phase HPLC, using a Shimadzu LC-6A pump, CTO-2A column oven, and SCL-6A system controller (Shimadzu Corp.). 3H-Gly-Sar was separated on a YMC-Pack CN S-5 column (5 μm, 4.6 × 150 mm; YMC Co., Ltd.). Isocratic elution was performed by mixing acetonitrile and water containing 5 mM sodium dodecyl sulfate and 50 mM sodium dihydrogen phosphate adjusted to pH 2.6 with phosphate (5:95), at a constant flow rate of 1.0 mL/min. The retention time of 3H-Gly-Sar was 4.6 min. Radioactivity of the collected 3H-Gly-Sar fraction was measured with an LSC-5200 liquid scintillation counter (Aloka Co., Ltd.).
Whole-Body Imaging of Tumor-Bearing Mice
Kinetics and biodistribution patterns of each radiolabeled compound were determined with a positron planar imaging system (PPIS) (IPS-1000-6XII, Hamamatsu Photonics K.K.) (19). Mice anesthetized with sevoflurane (Maruishi Pharmaceutical Co., Ltd.) were positioned with the spine on an acrylic plate and placed on the midplane between the 2 opposing detectors arranged in a horizontal mode. 11C-Gly-Sar at a dose of 5 MBq was intravenously injected into each mouse from the tail vein. The data were acquired with a 1-min time-frame interval for 60 min, and 6 summation images were created every 10 min.
Inflammation Model
For evaluation of tracer accumulation in inflammatory tissue, mice were subcutaneously administered 50 μL of oil of turpentine, and the tracer uptake was measured 3 d after injection (19). The selectivity index was defined as (tumor uptake − muscle uptake)/(inflammation uptake − muscle uptake)—that is, tumor-to-inflammation ratio corrected for background radioactivity.
Immunohistochemical Study of Expression of PEPT1 and PEPT2 in Tumor Xenografts and in Inflammatory Tissue
To examine PEPT1 and PEPT2 protein expression in xenografts of tumor-bearing mice, postmortem tumor, inflammatory, and normal tissues were harvested, embedded in OTC compound (Tissue-Tek; Sakura Finechemical Co., Ltd.), and fixed with paraformaldehyde. They were then frozen and cut into 10-μm sections with a Tissue-Tek cryostat. After incubation with a PEPT1- or PEPT2-specific polyclonal antibody (Santa Cruz Biotechnology, Inc.) at a dilution of 1:100 or 1:400, respectively, PEPT1 or PEPT2 immunoreactivity was visualized by reaction with EnVision (DaKoCytomation) or biotinylated antigoat IgG (Vector Laboratories), respectively. The specimens were examined with a Biozero microscope (Keyence Corp.). The objective lens was a Plan Apo 20 × /0.75 (Nikon Corp.).
Cellular Uptake Study
For the cellular uptake study, cancer cells were seeded at a density of 5.0 × l04 (AsPC-1) or 2.0 × l04 (PC-1 and MKN45) cells per well on 96-well plates (Nalge Nunc International K.K.) and grown for 2 d. The passage numbers were in the ranges of 4–7 for AsPC-1, 9–12 for PC-3, and 8–11 for MKN45 cells. Uptake of 2 μM 3H-Gly-Sar by the cultured cells was examined at 37°C, pH 6.0 or 7.4. The procedures of the uptake experiments were as described previously (12). The radioactivity was determined using an LSC-6100 liquid scintillation counter (Aloka Co., Ltd.). Uptake of 3H-Gly-Sar was described as uptake clearance (μL/min/mg protein), defined as the value obtained by dividing the uptake rate (nmol/min/mg protein) by the 3H-Gly-Sar concentration in the uptake medium (2 μM).
Quantitative Real-Time Poymerase Chain Reaction (RT-qPCR) Analysis
Quantification of the messenger RNAs (mRNAs) coding for human PEPT1 and PEPT2 in cancer cell lines was performed by using the LightCycler system (Roche Diagnostics) with the LightCycler FastStart DNA MasterPLUS HybProbe (Roche Diagnostics) according to the manufacturer's protocol. The PEPT1 and PEPT2 primers were designed and synthesized by TaKaRa Bio Inc. Hybridization probe sets (Fluorescein Probe and LCRed640 Probe) were designed and synthesized by Nihon Gene Research Laboratories Inc. The absolute concentration of the external standard was measured with a NanoDrop ND-1000 (NanoDrop Technologies).
Statistical Analysis
Results are presented as mean ± SD. Differences of SUVs in the various tissues and in tissue-to-blood ratios were compared using ANOVA, which was followed by the Dunnett or Scheffé post hoc tests (KaleidaGraph; Synergy Software). Comparisons between conditions were performed using an unpaired, 2-tailed Student t test. A P value < 0.05 was considered significant.
RESULTS
Whole-Body PPIS Imaging of 11C-Gly-Sar in Tumor-Bearing Mice
To evaluate 11C-Gly-Sar as a tumor-detecting agent, whole-body PPIS imaging (static collection, 10 min) with 11C-Gly-Sar in athymic mice bearing pancreatic cancer AsPC-1 was performed. Data are displayed as the images accumulated every 10 min, up to 60 min after injection (Fig. 2A). 11C-Gly-Sar showed clear delineation of the tumor in the right hind limb compared with the contralateral normal tissue (left hind limb). Remarkable accumulation of 11C-Gly-Sar in the tumor was apparent from an early time point after injection. Prostate cancer PC-3 (Fig. 2B) and gastric cancer MKN45 (Fig. 2C) were also well visualized by 11C-Gly-Sar injection. The kidneys were found to be the primary sites of uptake of 11C-Gly-Sar (Fig. 2), as reported previously (25) after intravenous administration. 14C-Gly-Sar was reported to be mainly excreted in urine (8), and 11C-Gly-Sar was rapidly accumulated in the bladder (Fig. 2). HPLC with radiochemical detection demonstrated that 72.9% ± 8.7% (mean ± SD, n = 5) of the radioactivity recovered in the AsPC-1 xenograft at 60 min after an intravenous bolus dose of 3H-Gly-Sar was that of intact Gly-Sar.
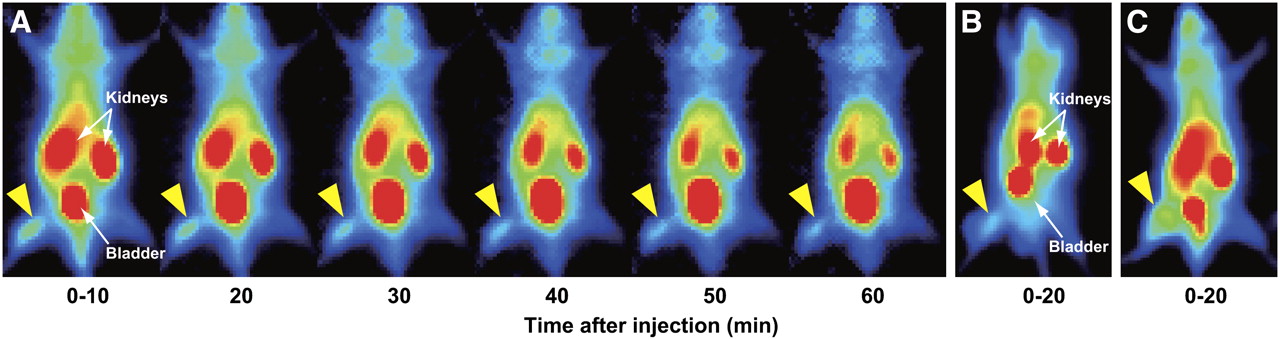
Whole-body PPIS imaging of 11C-Gly-Sar in tumor-bearing mice. Mice, inoculated subcutaneously with AsPC-1 (A), PC-3 (B), or MKN45 (C) cells on right side of hind limb and anesthetized with Sevoflurane, were positioned spine down on an acrylic plate and placed on midplane between 2 opposing detectors arranged in a horizontal mode. 11C-Gly-Sar (5 MBq) was injected intravenously into each mouse via tail vein. Data were acquired with a 1-min time-frame interval for 60 min after injection, and 6 summation images were created every 10 min (A). Merged images at 0–20 min are shown (B and C). Yellow arrowhead indicates tumor.
Biodistribution of 11C-Gly-Sar in Tumor-Bearing Mice
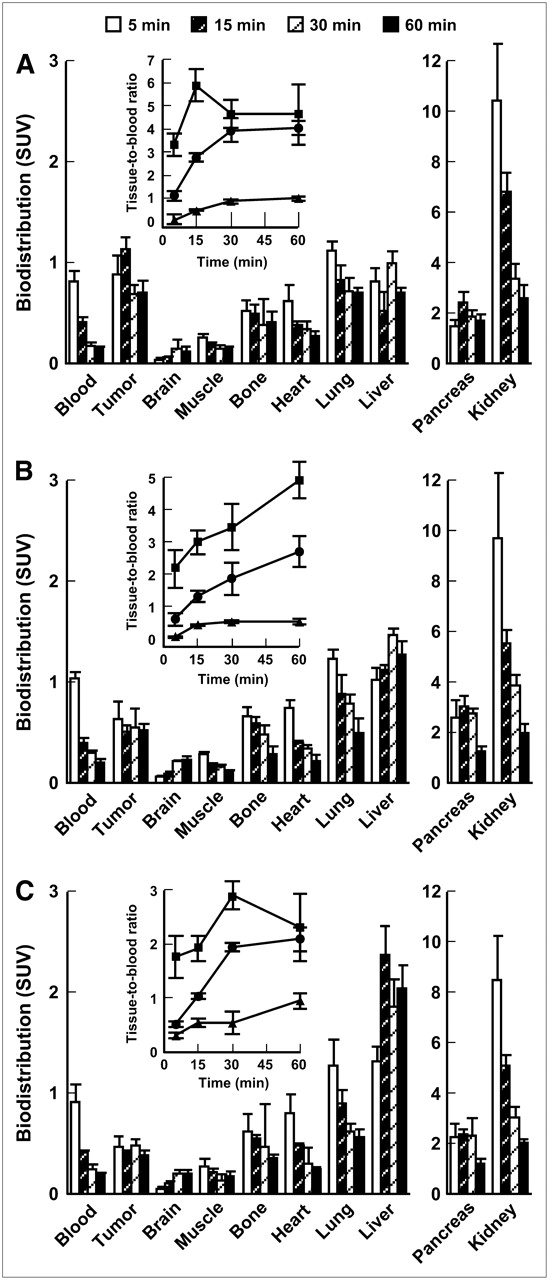
Figure 3 shows the biodistribution of 11C-Gly-Sar in athymic mice bearing AsPC-1 (Fig. 3A), PC-3 (Fig. 3B), and MKN45 (Fig. 3C). Significant accumulation of 11C-Gly-Sar in the tumor was detected from an early time point after injection, and tumor uptakes of 11C-Gly-Sar were comparable during 5–60 min after injection (Fig. 3). The SUVs of 11C-Gly-Sar in AsPC-1, PC-3, and MKN45 xenografts at 60 min after intravenous dosing were 0.70 ± 0.11, 0.53 ± 0.05, and 0.42 ± 0.03 (mean ± SD, n = 5), respectively. The SUVs of 11C-Gly-Sar in muscle ranged from 0.11 to 0.22 at 60 min. The tracer uptake values obtained from various tissues at 60 min after injection in AsPC-1 xenograft-bearing mice were initially tested using overall repeated-measures ANOVA, which was found to be significant (F9,39 = 76.1, P < 0.0001). The post hoc test revealed that tracer uptake in the tumor tissue was significantly higher than that in blood (P = 0.0011), brain (P = 0.0005), muscle (P = 0.0020), and heart (P = 0.012) but was lower than that in pancreas (P < 0.0001) or kidney (P < 0.0001). No significant differences in the tracer uptake were found between tumor tissue and bone (P = 0.19), lung (P = 1.0), or liver (P = 1.0) (Fig. 3A). Similar results were obtained in PC-3- or MKN45-bearing mice (Figs. 2B and 2C). The T/B and T/M ratios, diagnostically important parameters, were elevated until 30 min after intravenous injection, in contrast to the M/B ratio (Figs. 2A–2C, insets). The T/B ratio of 11C-Gly-Sar was significantly higher than the M/B ratio (P < 0.0001) from 5 to 60 min after intravenous injection.

Biodistribution of 11C-Gly-Sar as determined by radioactivity assay in tumor-bearing mice. Postmortem tissues were harvested at 5 (white bars), 15 (black hatched bars), 30 (white hatched bars), and 60 (black bars) min after intravenous injection of 11C-Gly-Sar in AsPC-1-bearing (A), PC-3-bearing (B), and MKN45-bearing (C) mice (n = 5). Uptakes are expressed as mean ± SD of SUV. (Insets) Tumor-to-blood (circles), tumor-to-muscle (squares), and muscle-to-blood (triangles) SUV ratios of 11C-Gly-Sar are plotted against the time period after injection.
Immunohistochemistry of PEPT1 or PEPT2 in Human Cancer Xenografts Implanted in Mice and Inflammatory Tissue
The expression of PEPT1 or PEPT2 in cancer xenografts inoculated into athymic mice was examined by immunohistochemistry using specific antibodies. Strong positive signals with antihuman PEPT1 or antihuman PEPT2 antibody were observed in AsPC-1, PC-3, and MKN45 xenografts (Fig. 4), shown as brown arrowheads. In inflammatory tissues that were induced subcutaneously with oil of turpentine, specific signals for PEPT1 and PEPT2 were negligible (Fig. 4B). Positive signals for PEPT1 and PEPT2 were observed in the kidney (positive controls), whereas no signals were observed in the muscle (negative controls) (Fig. 4C).

Immunohistochemistry of PEPT1 or PEPT2 in human cancer xenografts implanted in mice and in inflammatory tissue. Microscopic images were obtained of sections of human pancreatic cancer AsPC-1, prostate cancer PC-3, and gastric cancer MKN45 xenografts (A) and inflammatory tissue (B) at 3 d after injection of turpentine oil. Immunoreactivity of antihuman PEPT1 or antihuman PEPT2 antibodies was also examined in tissue sections of positive control (kidney) or negative control (muscle) (C). Tissue sections were counterstained with 4′-6′-diamidino-2-phenylindole (DAPI) (blue) to show cell nuclei (bars = 50 μm).
In Vitro Uptake of 3H-Gly-Sar by Cancer Cell Lines
The uptake of 2 μM 3H-Gly-Sar in 10 min by cancer cells was measured in the absence or presence of unlabeled Gly-Sar (20 mM). The initial uptake clearances were 3.88 ± 0.25 or 0.94 ± 0.20 (AsPC-1), 1.39 ± 0.13 or 1.22 ± 0.11 (PC-3), and 1.64 ± 0.03 or 0.77 ± 0.08 (MKN45) μL/min/mg protein (mean ± SD, n = 4), respectively. 3H-Gly-Sar uptake observed in AsPC-1 cells was pH-dependent, with saturable uptake values (μL/min/mg protein) of 2.94 ± 0.32 and 1.62 ± 0.13 at pH 6.0 and 7.4, respectively.
Accumulation of 18F-FDG and Lack of Accumulation of 11C-Gly-Sar in Inflammatory Tissues
No specific uptake of 11C-Gly-Sar was found in inflammatory tissues, whereas 18F-FDG had a higher accumulation in inflammatory tissue than that in tumor tissue in mice inoculated with AsPC-1 cells (Fig. 5). The mice without injection of turpentine oil are shown as controls. The tissue distribution of 11C-Gly-Sar in inflammatory tissue was compared with that of 18F-FDG in athymic mice bearing AsPC-1 (Fig. 5B). One-way factorial ANOVA (F2,15 = 54.2, P < 0.0001) and the Scheffé post hoc test revealed that the inflammation-to-blood ratio (I/B) and M/B of 11C-Gly-Sar were not significantly different (P = 0.98). The I/B ratio of 11C-Gly-Sar was significantly smaller than the T/B ratio (P < 0.0001). However, 18F-FDG accumulation was 6.8-fold higher in inflammatory tissue than in the noninflamed contralateral muscle (P < 0.0001). The selectivity index (tumor-to-inflammatory tissue ratio corrected for uptake in healthy muscle) was >25.1 for 11C-Gly-Sar and 0.72 ± 0.13 for 18F-FDG, respectively. The SD for 11C-Gly-Sar could not be calculated because, in some animals, tracer uptake in inflammatory tissue was smaller than that in the contralateral healthy muscle. The difference in SUV between 11C-Gly-Sar and 18F-FDG in the tumor was not significant (P = 0.95). Furthermore, The T/B ratios of 11C-Gly-Sar and 18F-FDG were not significantly different (Fig. 5B, P = 0.71).
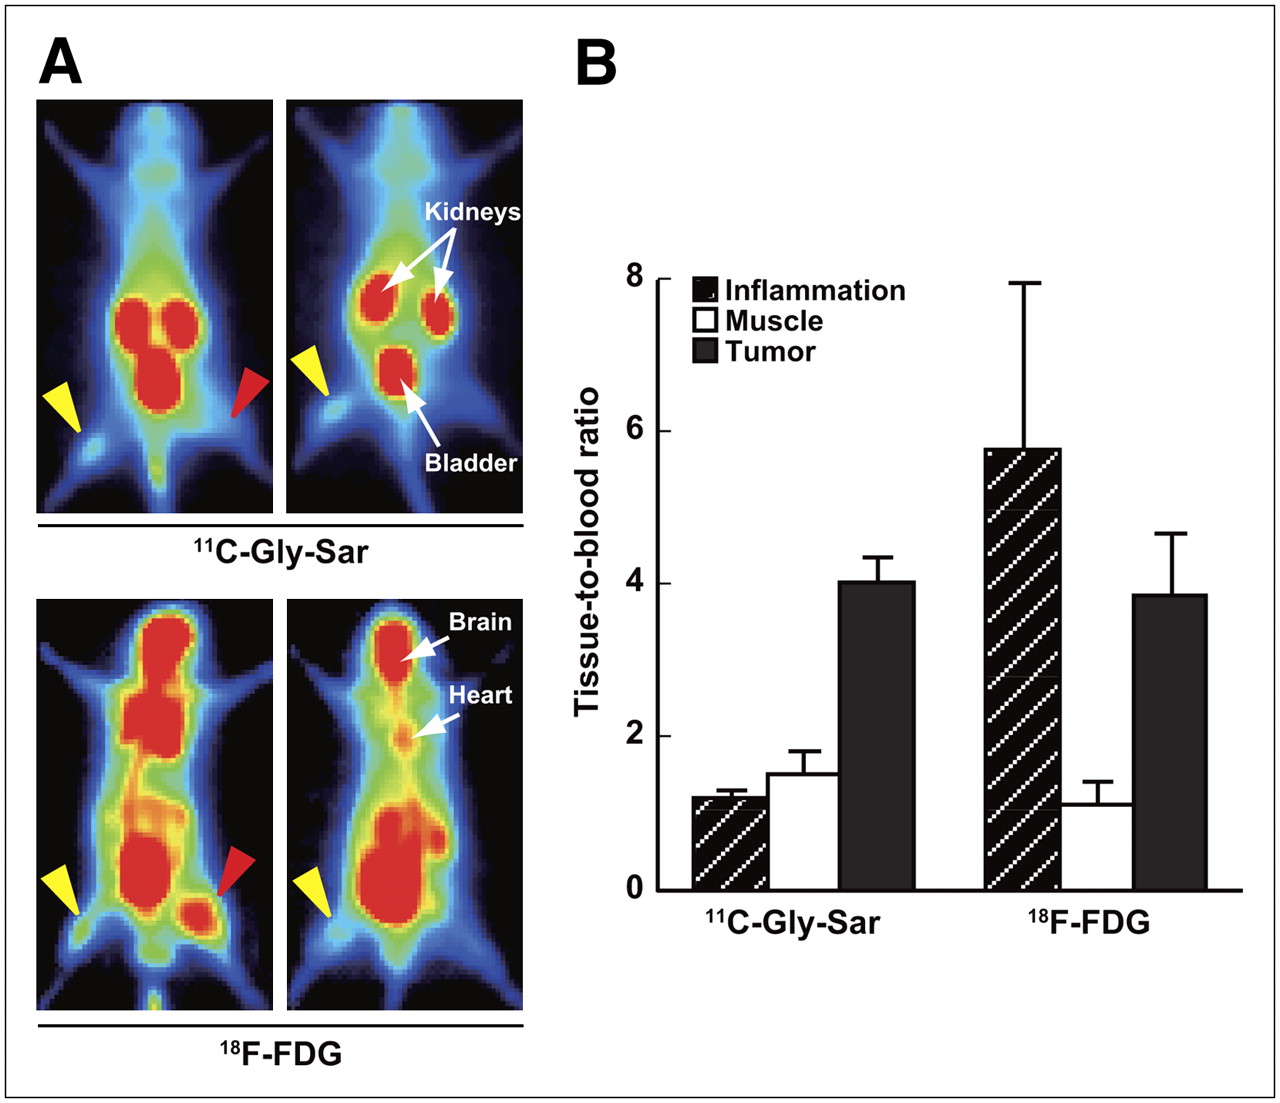
Accumulation of 18F-FDG but absence of accumulation of 11C-Gly-Sar in inflammatory tissues in mice. (A) Mice were inoculated subcutaneously with AsPC-1 cells (yellow arrowheads) in right side of hind legs with or without subcutaneous inoculation of oil of turpentine (50 μL) in left hind legs at 3 d before tracer injection (red arrowheads). Mice were imaged by PPIS with 11C-Gly-Sar and 18F-FDG injection, and accumulated images were created from 0 to 20 and 41 to 60 min, respectively, after injection. (B) I/B (hatched bars), M/B (white bars), and T/B (black bars) ratios of 11C-Gly-Sar and 18F-FDG at 60 min after injection are presented in E. Mean ± SD (n = 5).
Expression of mRNA of PEPT1 and PEPT2 in Various Human Cancer Cell Lines
Quantitative RT-PCR was performed by using the LightCycler system with HybProbes specific for each mRNA transcript. mRNAs coding for human PEPT1 and PEPT2 in 58 human cancer cell lines were examined (Table 1). The expression levels of mRNA of PEPT1 were high in renal cell carcinoma VMRC-RCW, pancreatic adenocarcinoma AsPC-1 cells, ovary serous adenocarcinoma JHOS-2, ovary clear cell carcinoma JHOS-8, and poorly differentiating gastric adenocarcinoma MKN45 cells. The percentage of cell lines containing PEPT1 mRNA over the quantification limit was 27.6%. On the other hand, mRNA levels of PEPT2 were above the quantification limit in 54 of 58 cell lines (93.1%). Notably, poorly differentiated esophageal squamous cell carcinoma TE-9, tongue squamous cell carcinoma HSC-3, primitive neuroectodermal tumor cell line derived from kidney (FU-RPNT-2), epidermoid carcinoma A431, and ovary serous adenocarcinoma JHOS-2 exhibited high levels of PEPT2 mRNA.
mRNA Expression of PEPT1 and PEPT2 in Various Human Cancer Cell Lines
DISCUSSION
This study demonstrates that PEPTs are promising targets for cancer detection. We were able to detect human pancreatic cancer, prostate cancer, and gastric cancer in mice by using a prototypical positron probe for the PEPT 11C-Gly-Sar. 11C-Gly-Sar was also able to distinguish between tumor and inflammatory tissue, in combination with 18F-FDG.
Whole-body PPIS imaging effectively visualized an AsPC-1 tumor xenograft when 11C-Gly-Sar was injected into mice as a PET tracer (Fig. 2). The tissue distribution study of 11C-Gly-Sar revealed that background accumulation of the tracer was quite low, presumably because of restricted functional expression of PEPTs in tissues (Fig. 2). The SUV of 11C-Gly-Sar in the tumor was significantly larger than that in blood, brain, muscle, bone, or heart at 15 min after injection (Fig. 3). Clear tumor visualization from the early period after injection is a prominent characteristic of this tracer. Considering that most of the radioactivity that appeared in the tumor xenograft was due to intact Gly-Sar, it can be assumed that the rapid accumulation of the tracer in tumors occurs not because of metabolic trapping but as a result of PEPT-mediated uptake. Imaging of tumor lesions with good contrast at an early time after tracer injection would be an advantage in clinical application.
Subsequently, to corroborate the potential usefulness of 11C-Gly-Sar in cancer detection, we performed whole-body PPIS imaging and biodistribution studies in mice with other xenografts, using gastric cancer MKN45 cells possessing peptide transport activity in vitro (11,26) and prostate cancer PC-3 (Fig. 2), where the use of 18F-FDG is unfavorable because of its relatively low uptake in these cancers (27). As shown in Figure 2, specific visualization of MKN45 and PC-3 xenografts was observed after injection of 11C-Gly-Sar. The SUVs in xenografts of MKN45 or PC-3 tumor were similar to that in AsPC-1 tumor (Fig. 3). Our imaging and biodistribution studies revealed that 11C-Gly-Sar was specifically taken up by the tumors in vivo. The detection of PEPT1 and PEPT2 proteins in tumor tissue sections, but not in muscle (Fig. 4), together with the fact that SUVs were consistently higher in the tumor tissues but much lower in the muscle (Fig. 3), indicates that the uptake of 11C-Gly-Sar in these tumors was mediated by these PEPTs.
The in vitro transport activities observed in AsPC-1 cells and MKN45 cells, and the mRNA and protein expression levels of PEPTs (Table 1 and Fig. 4) were also consistent with the in vivo imaging data (Fig. 2). Thus, the accumulations of 11C-Gly-Sar in these 2 xenografts were concluded to be due to uptake by PEPTs, supporting our hypothesis that targeting of peptide transporter(s) with 11C-Gly-Sar is a useful strategy for visualizing tumors in vivo by means of PET. On the other hand, there was an apparent discrepancy in the case of PC-3 between in vivo imaging results (Fig. 2) and in vitro cellular uptake data: Although mRNAs of both PEPT1 and PEPT2 (Table 1), and in vitro cellular uptake of 3H-Gly-Sar by PC-3 cells, were negligible, the tumor xenograft was clearly visualized by 11C-Gly-Sar in PC-3 xenografts (Fig. 2). On the basis of the fact that PEPT1 and PEPT2 proteins were clearly detected in the in vivo PC-3 xenograft (Fig. 4), we speculate that PEPTs might have been induced by the inoculation of the cells into the mice in vivo, leading to uptake of 11C-Gly-Sar and consequently resulting in the detection of the cancer by in vivo imaging. Further experiments are needed to examine the possible induction of these PEPTs in the PC-3 xenograft and its physiologic role in vivo. PEPT1 is a high-capacity, low-affinity transporter, in contrast to PEPT2, which is a low-capacity, high-affinity transporter (4). The contribution ratio of PEPT1 and PEPT2 to the uptake of 11C-Gly-Sar by tumors in vivo was not determined in this study and should also be evaluated.
The vicinity of tumor tissues in vivo is known to be more acidic than that of normal tissue (28), and this acidic environment may favor the function of PEPTs, as transport of peptides is activated by an inwardly directed proton gradient (29). This idea was confirmed in the present study, because transport into AsPC-1 cells was almost 2 times larger at pH 6.0 than at pH 7.4. The relatively small accumulation of 11C-Gly-Sar in inflammatory tissue (Fig. 5) suggests that 11C-Gly-Sar may be an effective probe to distinguish tumors from the inflammatory tissues in vivo in combination with 18F-FDG, at least for some cancers. Such tumor-specific imaging by 11C-Gly-Sar is consistent with the absence of PEPTs in inflammatory tissue (Fig. 4) and is in marked contrast to the case of 18F-FDG, which exhibited greater accumulation in inflammatory tissues than tumor xenograft (Fig. 5).
Another advantage of 11C-Gly-Sar was the much smaller accumulation in the brain (Figs. 2 and 3). Accumulation of 11C-Gly-Sar in the brain, which does not express PEPTs, was only 5% of 18F-FDG uptake at 60 min (P < 0.00001). This result may imply that brain tumors could also be identified with peptide PET tracer. The marked accumulation of 11C-Gly-Sar in the PC-3 xenograft (Fig. 2) suggested that this tracer may be suitable for detection of prostate cancer. Because 11C- and 18F-labeled choline has recently been used for prostate cancer imaging (27,30–32), it would be interesting to compare the potential usefulness of the peptide tracer and choline analogs. It may be difficult to detect renal or bladder tumors with peptide tracers because of the high accumulation of these tracers in the clearance organs (Fig. 2) (8,25). Inoue et al. (26) reported that PEPT1 was induced by 5-fluorouracil treatment, in contrast to a decrease of GLUT1 at the mRNA and protein levels. 11C-Gly-Sar may also be a promising tracer for assessment of the efficacy of chemotherapy with 5-fluorouracil, and this seems worthy of further study. Recently, Knütter et al. (33) developed a high-affinity transported substrate for PEPTs, Bip-Pro, which is a stable dipeptide. Bip-Pro will be also a valuable candidate for cancer detection by positron labeling as well as 11C-Gly-Sar. As the tissue distributions of PEPTs in healthy mice are similar to those in healthy humans (21–24), 11C-Gly-Sar-PET seems to be an excellent candidate for cancer detection in the clinical situation.
CONCLUSION
Our results indicate that the peptide PET tracer 11C-Gly-Sar is a promising candidate for cancer detection. Unlike 18F-FDG, this tracer can distinguish tumors from inflammatory tissues.
Acknowledgments
The authors appreciate the excellent technical assistance of Mariko Hiraiwa in performing the quantitative RT-PCR and Masashi Yamamoto, Taishiro Kimura, Yasufumi Okano, Jun Mizusawa in the animal experiments. Complementary DNA synthesis was performed by Kaori Yoshino. We also thank Dr. Ichiro Matsunari for helpful discussions as well as a critique of the manuscript. This study was sponsored by Ishikawa prefectural government, Japan, and was also supported in part by a grant-in-aid for scientific research provided by the Ministry of Education, Culture, Sports, Science and Technology, Japanese Government.
Footnotes
-
COPYRIGHT © 2008 by the Society of Nuclear Medicine, Inc.
References
- Received for publication October 16, 2007.
- Accepted for publication December 10, 2007.


