


Abstract
Significant improvements have made it possible to add the technology of time-of-flight (TOF) to improve PET, particularly for oncology applications. The goals of this work were to investigate the benefits of TOF in experimental phantoms and to determine how these benefits translate into improved performance for patient imaging. Methods: In this study we used a fully 3-dimensional scanner with the scintillator lutetium-yttrium oxyorthosilicate and a system timing resolution of ∼600 ps. The data are acquired in list-mode and reconstructed with a maximum-likelihood expectation maximization algorithm; the system model includes the TOF kernel and corrections for attenuation, detector normalization, randoms, and scatter. The scatter correction is an extension of the model-based single-scatter simulation to include the time domain. Phantom measurements to study the benefit of TOF include 27-cm- and 35-cm-diameter distributions with spheres ranging in size from 10 to 37 mm. To assess the benefit of TOF PET for clinical imaging, patient studies are quantitatively analyzed. Results: The lesion phantom studies demonstrate the improved contrast of the smallest spheres with TOF compared with non-TOF and also confirm the faster convergence of contrast with TOF. These gains are evident from visual inspection of the images as well as a quantitative evaluation of contrast recovery of the spheres and noise in the background. The gains with TOF are higher for larger objects. These results correlate with patient studies in which lesions are seen more clearly and with higher uptake at comparable noise for TOF than with non-TOF. Conclusion: TOF leads to a better contrast-versus-noise trade-off than non-TOF but one that is difficult to quantify in terms of a simple sensitivity gain improvement: A single gain factor for TOF improvement does not include the increased rate of convergence with TOF nor does it consider that TOF may converge to a different contrast than non-TOF. The experimental phantom results agree with those of prior simulations and help explain the improved image quality with TOF for patient oncology studies.
There has been considerable advancement of the technology and instrumentation in PET over the last 30 y since the first tomography ring systems were developed. Significant improvements have been made in detectors, hardware, and image processing that impact both image quality and accuracy of quantification. Some of the major achievements include (a) the development and incorporation of new scintillators and detector configurations for higher spatial resolution and sensitivity, (b) the evolution from 2-dimensional (2D) systems with septa to 3-dimensional (3D) systems with larger axial fields of view for improved sensitivity, (c) the transition from analytic filtered-backprojection reconstruction algorithms to fully 3D iterative techniques with data corrections included in the system model for improved image quality and quantification, and (d) the combination of a CT scanner with the PET instrument for both attenuation correction and anatomic correlation. The data presented in this article demonstrate that the technology of time-of-flight (TOF) can be added to these achievements to further improve PET.
The idea to use TOF information was originally proposed in the early stages of PET scanner development (1–3), and the first TOF PET systems were developed in the 1980s (4–8). A good summary of this early work has been published (9,10). These early systems used cesium fluoride (CsF) or barium fluoride (BaF2) scintillators and were capable of meeting the high-count-rate demands of research brain and heart studies with short-lived isotopes, but they could match neither the spatial resolution nor the sensitivity of conventional PET scanners with bismuth germanate (BGO) scintillators. By the early 1990s, these early TOF scanners were retired from use—just before whole-body oncology studies with 18F-FDG became common for the clinical diagnosis and staging of cancer. TOF PET is particularly advantageous for whole-body imaging because the theoretical improvement with TOF is predicted to increase with the size of the patient. This is fortuitous, as conventional PET image quality degrades noticeably for large patients due to increased attenuation, which leads to both the loss of true counts and the increase of scattered counts. The promise of TOF for clinical PET is that it has the potential to improve the image quality in heavy patients, precisely where it is needed most.
There are several reasons why TOF is making a resurrgence in PET today. First is the development of new scintillators that combine fast timing decay with high light output and high stopping power (11,12). The advantage of scintillators such as lutetium oxyorthosilicate (LSO) and lutetium–yttrium oxyorthosilicate (LYSO) is that they have desirable properties for PET without TOF, so their very good timing resolution should enhance already good performance. In contrast, CsF and BaF2 have very good timing resolution, but their low light output limits the detector design choices for light sharing and decoding crystals. The older TOF scanners with these scintillators generally had low sensitivity resulting from a poor packing fraction and poor spatial resolution of about 10–15 mm, as the crystals were large in cross-section. The last of these first-generation TOF PET scanners, the SuperPETT 3000 scanner, used a block-encoding scheme with improved spatial resolution of about 8 mm (13). It is common today in conventional PET scanners to use smaller crystals with encoding schemes for crystal identification to achieve spatial resolutions of 4–6 mm. Although modern clinical scanners all have spatial resolutions in this range, the encoding ratio (number of crystals:number of photomultiplier tubes [PMTs]) depends on the light output of the crystal, so BGO is typically configured with a lower encoding ratio than LSO or LYSO. For TOF PET a high encoding ratio is desirable because this reduces the number of PMTs in the system; this is of practical importance, as a TOF PET system cannot use the same PMTs as a conventional PET scanner, and fast PMTs tend to be more expensive due to the more complicated plano-concave photocathode design that achieves the shorter transit time spread and faster rise time needed for TOF measurements.
In addition to the availability of new scintillators, the improvements in performance and reliability of PMTs and electronics make TOF more practical today than in the past. Although fast PMTs were available 25 y ago, there are now more choices of cost-effective PMTs in the range of 1- to 2-in diameter from the major PMT manufacturers. Furthermore, stability of electronics was reportedly very difficult to achieve with early TOF scanners. Current electronics have been observed to be very stable with little or no drift in the system timing resolution over periods of months (14).
Finally, there has been progress in image reconstruction algorithms. Early image reconstruction methods were developed that made use of the TOF information, including the most likely position (MLP) (15) and confidence-weighted (CW) backprojection (15–17) algorithms. Politte and Snyder (18) and Snyder and Politte (19) then adapted the maximum-likelihood expectation maximization (MLEM) algorithm to include the TOF probability response function to reconstruct list-mode data and found that it yielded image quality that was superior (fewer artifacts and better contrast for the same reconstructed resolution) to that of the CW or MLP methods.
Although the early studies of TOF reconstruction considered only 2D data, it is natural today to combine list-mode acquisition and iterative reconstruction for 3D data, as list-mode acquisition preserves the intrinsic spatial and temporal information of the data. In addition, list-mode storage is often more efficient than the binned format for 3D data because of the large number of measured lines of response (LORs) with respect to the number of detected events. In the last decade there have been notable developments in list-mode reconstruction methods (20–22) and, more recently, inclusion of both TOF and other physical effects in the system model (23–25). Although list-mode reconstruction is a computationally intensive method, fast computers and parallelization make a practical implementation feasible today (26).
Given these recent advances in technology, there have been several experimental studies of TOF PET and interest from both academic research groups as well as the commercial sector in the last couple of years. Results from a Siemens scanner based on LSO have been reported (27). However, because this system was not initially designed for TOF, limitations in the hardware result in a timing resolution of 1.2 ns, and the impact on clinical studies has been seen to be modest (28). Our group has been developing a research TOF PET scanner (29) based on a new scintillator, lanthanum bromide (LaBr3), which promises to have superior timing resolution, whereas Philips has developed a new scanner designed with TOF capability (Gemini TF) based on LYSO with an intrinsic timing resolution of ∼600 ps. The initial results with the Gemini TF showed an improved performance resulting from TOF measurement capability of the tomograph (14).
Our group has previously investigated the benefit of TOF for both lesion estimation and detectability tasks using simulated data (30). It was found that as the timing resolution improves, fewer iterations are required to achieve the same or higher maximum contrast recovery coefficient (CRC); for small lesions in larger objects in particular, higher values of CRC were obtained with TOF at the same noise level than those without TOF. Lesion detectability, as judged by the nonprewhitening matched filter signal-to-noise ratio, was seen to increase nonlinearly as a function of both statistics and timing resolution. The goals of this work were to investigate the benefits of TOF in experimental phantoms and to determine how these benefits translate into improved patient image quality.
MATERIALS AND METHODS
Theory of TOF PET
To generate 3D images in PET, coincident LORs are normally detected and recorded at many angles, and tomographic images are generated through traditional filtered-backprojection or iterative reconstruction. In a TOF PET system, for each annihilation event the difference in arrival times between the 2 coincident photons is also measured. Hypothetically, with perfect TOF information reconstruction would be unnecessary, as the location of each annihilation event could be identified on the basis of only online pair and time difference information. However, even imperfect timing information helps to improve the reconstruction because TOF information serves to localize the coincidence, which reduces the propagation of noise along the LOR.
The distance that a given event is projected along the LOR is defined by an uncertainty Δx that can be much smaller (with good timing resolution) than the distance D (diameter of the patient) over which counts would be distributed equally in the forward- and backprojection steps of non-TOF reconstruction. A reduction of noise can be equated to an increase in sensitivity, and this effective sensitivity gain was estimated (15,31) at the center of a uniform distribution to be proportional to D/Δx, where Δx = c·Δt/2, c is the speed of light, and Δt is the timing resolution (full width at half maximum [FWHM]). Table 1 lists D/Δx for several object sizes and timing resolutions. The diameters chosen represent thin (20 cm), average (27 cm), and heavy (35 cm) patients. We showed earlier (14) that phantom and patient data have the same relationship of noise equivalent count rate versus size and that these phantom sizes can be used to represent patients ranging from 40 to 100 kg. A more involved derivation of TOF gain that accounts for filtering in the reconstruction process was given (16), also for a uniform distribution, whereby the variance reduction (equal to sensitivity gain) is given by D/(1.6·Δx). These simple estimates may not be accurate for the realistic, nonuniform activity distributions found in patients, but they are useful to provide an idea of the relative importance of timing resolution. In addition, these metrics argue that TOF gain increases not only as timing resolution improves but also as the object diameter increases, so we can predict the relative benefit of TOF as the patient size increases. However, it may be too simplistic to characterize the TOF gain as a single value, as we expect it to depend on both the task and methods of data correction and the image reconstruction. The simple estimates of TOF gain, which were derived for analytic reconstruction and may not extend directly to iterative reconstruction, also do not consider the issue of faster convergence for an iterative reconstruction algorithm with TOF, an additional benefit of TOF that was shown (30) to depend on both the timing resolution and the statistics.
Calculated Sensitivity Gain for a Uniform Distribution*
In this article, we examine the benefits of TOF in the clinical oncology imaging task of estimation of the uptake value in a region of interest (ROI). TOF has the potential to improve the accuracy of a lesion uptake measurement through better signal localization and reduced noise propagation. Although the accuracy of this task is of primary importance, an added requirement is to perform it with the shortest possible scan time that, in turn, impacts the list-mode reconstruction time.
TOF Scanner
The Gemini TF scanner (Philips Medical Systems) was used in this study. This fully 3D scanner has good intrinsic performance, as described (14). The energy resolution of 11.5% (FWHM) allows the lower energy threshold to be raised to 440 keV. The system timing resolution measured with a point source in air is 585 ps, and daily measurements of the timing resolution have demonstrated that this value is very stable over a period of many months. However, there is a count-rate effect on the timing resolution that causes the timing resolution to degrade to about 650–700 ps at singles count rates of 15–25 megacounts per second (Mcps), which correspond to typical clinical count-rates. A study on the impact of using an inaccurate TOF kernel in iterative TOF PET reconstruction found that using a TOF kernel that was narrower than the actual timing resolution led to degraded contrast (32). Therefore, an estimated value of the timing resolution based on the singles rate during a study—rather than the intrinsic timing resolution measured at low activities—is used during image reconstruction.
Data Corrections and Reconstruction
To correct the measured timing differences between crystals, timing calibration methods have been investigated, using either a rotating line source (33) or a stationary, shielded point source at the center of the scanner (34). For the Gemini, a 68Ge rod source is used to measure the timing offsets, following a method described earlier (34). The range (minimum to maximum) of offset factors for the entire scanner is ±1 ns.
For scatter correction, it has been suggested that model-based single-scatter simulation (SSS) should be modified to estimate the scatter distribution as a function of radial and time domains (35). We have extended our implementation of SSS (36,37) in a similar fashion, but with a TOF-dependent scatter distribution (36,37). Our approach uses fine timing bins to allow accurate modeling of scatter estimates while maintaining the intrinsic timing resolution of the system without creating impractical demands on storage requirements or reconstruction time.
The reconstruction approach implemented for TOF is a list-mode version of the MLEM algorithm (24) with a TOF kernel applied in both the forward- and the backprojection operations. The Poisson statistics of the data are preserved by using the data in their original form (i.e., without binning) and incorporating the physical effects of PET in the system model. The TOF response function is modeled as a 1-dimensional Gaussian function along the LOR. The MLEM algorithm is accelerated by dividing the data into chronologically ordered subsets (24).
A fully 3D list-mode iterative reconstruction algorithm is computationally intensive and has proven to be challenging to implement for clinical purposes (26). Using a 10-node (dual central-processing-unit) computer cluster, the image processing with this algorithm proceeds in parallel with data acquisition and is typically completed for clinical whole-body (multibed) studies 10–30 min after the end of the acquisition, depending on the number of counts collected.
Phantom Measurements
For comparison with prior simulation studies (30), 27- and 35-cm-diameter phantoms were constructed for experimental measurements. As described earlier, these diameters represent average and heavy patients—63 and 100 kg, respectively—according to the correlation of count rate versus weight presented (14). We modified the caps of 5- and 13-gallon “Carboy” bottles (Cole Parmer) to accept the ring of 6 spheres (diameters of 37, 28, 22, 17, 13, and 10 mm) from the National Electrical Manufacturers Association (NEMA) image-quality phantom (38). The spheres were filled with 18F-FDG with a 6:1 uptake ratio compared with the background activity concentrations of 8.2 kBq/mL (0.22 μCi/mL) and 4.1 kBq/mL (0.11 μCi/mL) in the 27- and 35-cm-diameter phantoms, respectively. Three replicate acquisitions were performed. The prompt collect rates were 470 kcps (27-cm) and 250 kcps (35-cm); the singles rates were 21 Mcps (27-cm) and 16 Mcps (35-cm). For these studies, the corresponding scatter fractions were 36% (27-cm) and 38% (35-cm), whereas the randoms' fractions (delays/prompts) were 54% (27-cm) and 51% (35-cm). A CT scan was used for attenuation correction, and the data were reconstructed for up to 20 iterations (20 subsets/iteration) with the list-mode MLEM algorithm described previously.
The images were analyzed by drawing ROIs with diameters equal to the sphere diameters on the hot lesions in the central slice. The count density in these ROIs was used as an estimate of the uptake in each lesion. The background count density was obtained by drawing 12 ROIs at a radial distance of 11 cm within the central slice and in slices ±1 and ±2 cm away, for 60 background ROIs of each sphere size. The CRC was calculated as: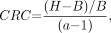 Eq. 1where H and B are the average counts in the sphere and background ROIs, respectively, and a is the true activity ratio (= 6), determined using a method described earlier (38). Noise was calculated as the average pixel-to-pixel percent SD in the 60 background ROIs, rather than the background variability measure prescribed by NEMA, because the latter measure is sensitive to nonuniformities in the image but relatively insensitive to statistical noise. The CRC and noise values were averaged over the 3 replicate acquisitions.
Patient Oncologic Imaging
The standard imaging protocol for clinical oncology studies with the Gemini TF at the University of Pennsylvania is to inject a 555-MBq (15-mCi) dose of 18F-FDG and scan for 3 min per bed position after a 60-min uptake period. Because the axial field of view of the scanner is 18 cm with an incremental bed movement between frames of 9 cm to allow for a 50% overlap between bed positions, a whole-body scan from the base of the skull to midthigh typically requires between 8 and 11 bed positions. The average prompt rate is 220–550 kcps, which leads to approximately 40–100 megacounts (Mcts) (prompts) for a single bed position in a typical study. The singles rate for clinical studies ranges between 15 and 25 Mcps. The range in the singles and prompt rates represents values for varying patient sizes, with the low values representative of larger patients. The prompt and singles rates for the patients agree well with the rates at which the 27- and 35-cm-diameter phantoms were acquired. A CT scan was used for attenuation correction. The data were reconstructed for up to 10 iterations with 33 subsets, using an average TOF resolution of 660 ps, depending on the singles count-rate of the study. Data corrections were performed as described previously.
Five patient studies spanning the range of sizes (46–140 kg; body mass index [BMI] = 19–46) were selected for quantitative analysis of lesion uptake. Six to 9 lesions (1- to 2-cm diameter) were selected for analysis in each patient for a total of 37 lesions. Small circular ROIs (8-mm diameter) were drawn on the lesions, and the average value in each ROI was recorded. A 40-mm-diameter ROI drawn in a region of the liver that was visually determined to be uniform was used as a background region to normalize out any bias. The ratio of average lesion counts to average background counts (L/B ratio) was calculated for each lesion. Noise was determined as the pixel-to-pixel percent SD in the liver ROI.
RESULTS
Phantom Measurements
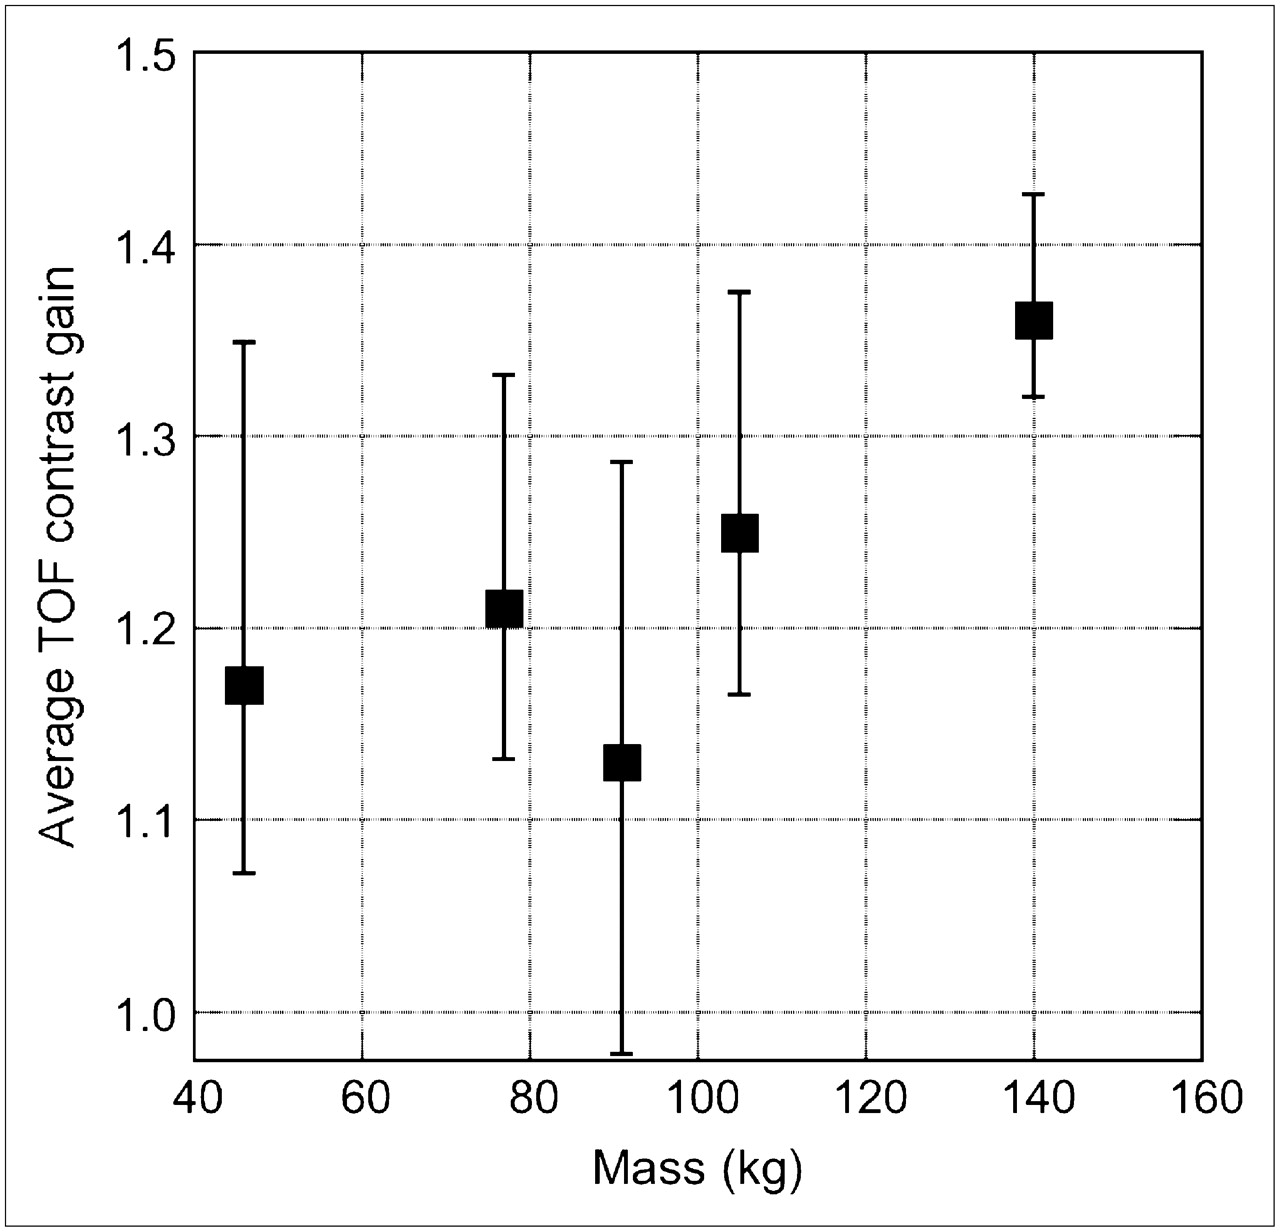
Figures 1A and 1B show images from the 35-cm-phantom study for a 5-min scan reconstructed without (Fig. 1A) and with (Fig. 1B) TOF information for different iterations of MLEM. These images demonstrate visually the improved contrast of the smallest spheres with TOF compared with non-TOF; even after 20 iterations, it is difficult to visualize the 10-mm sphere without TOF while the images continue to get noisier with more iterations. With TOF the 10-mm sphere is easily seen after only 1 iteration. The images also confirm the faster convergence of contrast with TOF found in the simulation studies.

Images from 35-cm-diameter phantom measurement with 2 cold spheres (28 and 37 mm) and 4 hot spheres (10, 13, 17, and 22 mm) with 6:1 contrast. (A and B) Non-TOF images (A) and TOF images (B) for 1, 2, 5, 10, and 20 iterations (left to right) for 5-min scan time. (C and D) Non-TOF images after 10 iterations (C) and TOF images after 5 iterations (D) for 5, 3, 2, and 1-min scan times (left to right).
Figures 1C and 1D show the same phantom reconstructed without (Fig. 1C) and with (Fig. 1D) TOF but now as a function of scan time, ranging from 5 min down to 1 min. The images with TOF are after 5 iterations; those for non-TOF are after 10 iterations, because these images appear closer to convergence (i.e., there is not a significant visual improvement in contrast but only an increase in noise with more iterations). For the TOF reconstruction, there is an increase in background noise as the scan time is decreased, but all spheres are clearly visible for scan times of >2 min, and only the 10-mm sphere is not visible in the 1-min image. In contrast, for the non-TOF reconstruction, the 10-mm sphere is not visible even in the 5-min image, and the 13-mm sphere is barely seen in the 2-min image and is not seen in the 1-min image.
Figure 2 presents these visual impressions in a more quantitative manner. CRC versus noise curves are shown for the 13- and 17-mm-diameter spheres in the 27-cm (Fig. 2 top) and 35-cm (Fig. 2 bottom) cylinders for different scan times for TOF and non-TOF reconstructions. The data points correspond to 1, 2, 5, 10, 15, and 20 iterations (20 subsets/iteration). These curves demonstrate the improved convergence with TOF compared with non-TOF as well as with increased statistics. It can also be seen that the non-TOF reconstruction does not match TOF in the level of quantitative performance, as defined by the CRC/noise curve. Even a 5-min scan with non-TOF leads to a CRC/noise curve that is below that from the 2-min scan with TOF, consistent with the visual impressions. Results for the 22-mm sphere (not shown) were similar, although the differences between TOF and non-TOF are smaller for this larger sphere. These CRC/noise curves show that convergence is reached faster with (a) TOF, (b) a smaller-diameter phantom, (c) a larger lesion, and (d) increased statistics or longer scan time. We believe that these trends are important, but the exact number of iterations needed to reach convergence will depend on details of the experimental setup, the scanner characteristics, and the reconstruction algorithm, all of which are difficult to generalize. We also believe that there is evidence in these data that given a large enough phantom (or patient) and small enough lesion, the non-TOF reconstruction will not converge to the same value as the TOF reconstruction. This finding is supported by our visual impression of improved detectability of the 10-mm sphere with TOF as seen in Figure 1.
CRC vs. noise curves for 13-mm (left) and 17-mm (right) hot spheres with 6:1 contrast in 27-cm (top) and 35-cm (bottom) cylinders. Scan times on the Gemini TF scanner were 1 (♦, ⋄), 2 (▪, □), and 3 (•, ○) min (27-cm phantom) and 2 (▴, ▵), 3 (♦, ⋄), 4 (▪, □), and 5 (•, ○) min (35-cm phantom), with closed symbols for non-TOF and open symbols for TOF reconstruction as a function of number of iterations (1, 2, 5, 10, 15, and 20).
Patient Oncologic Imaging
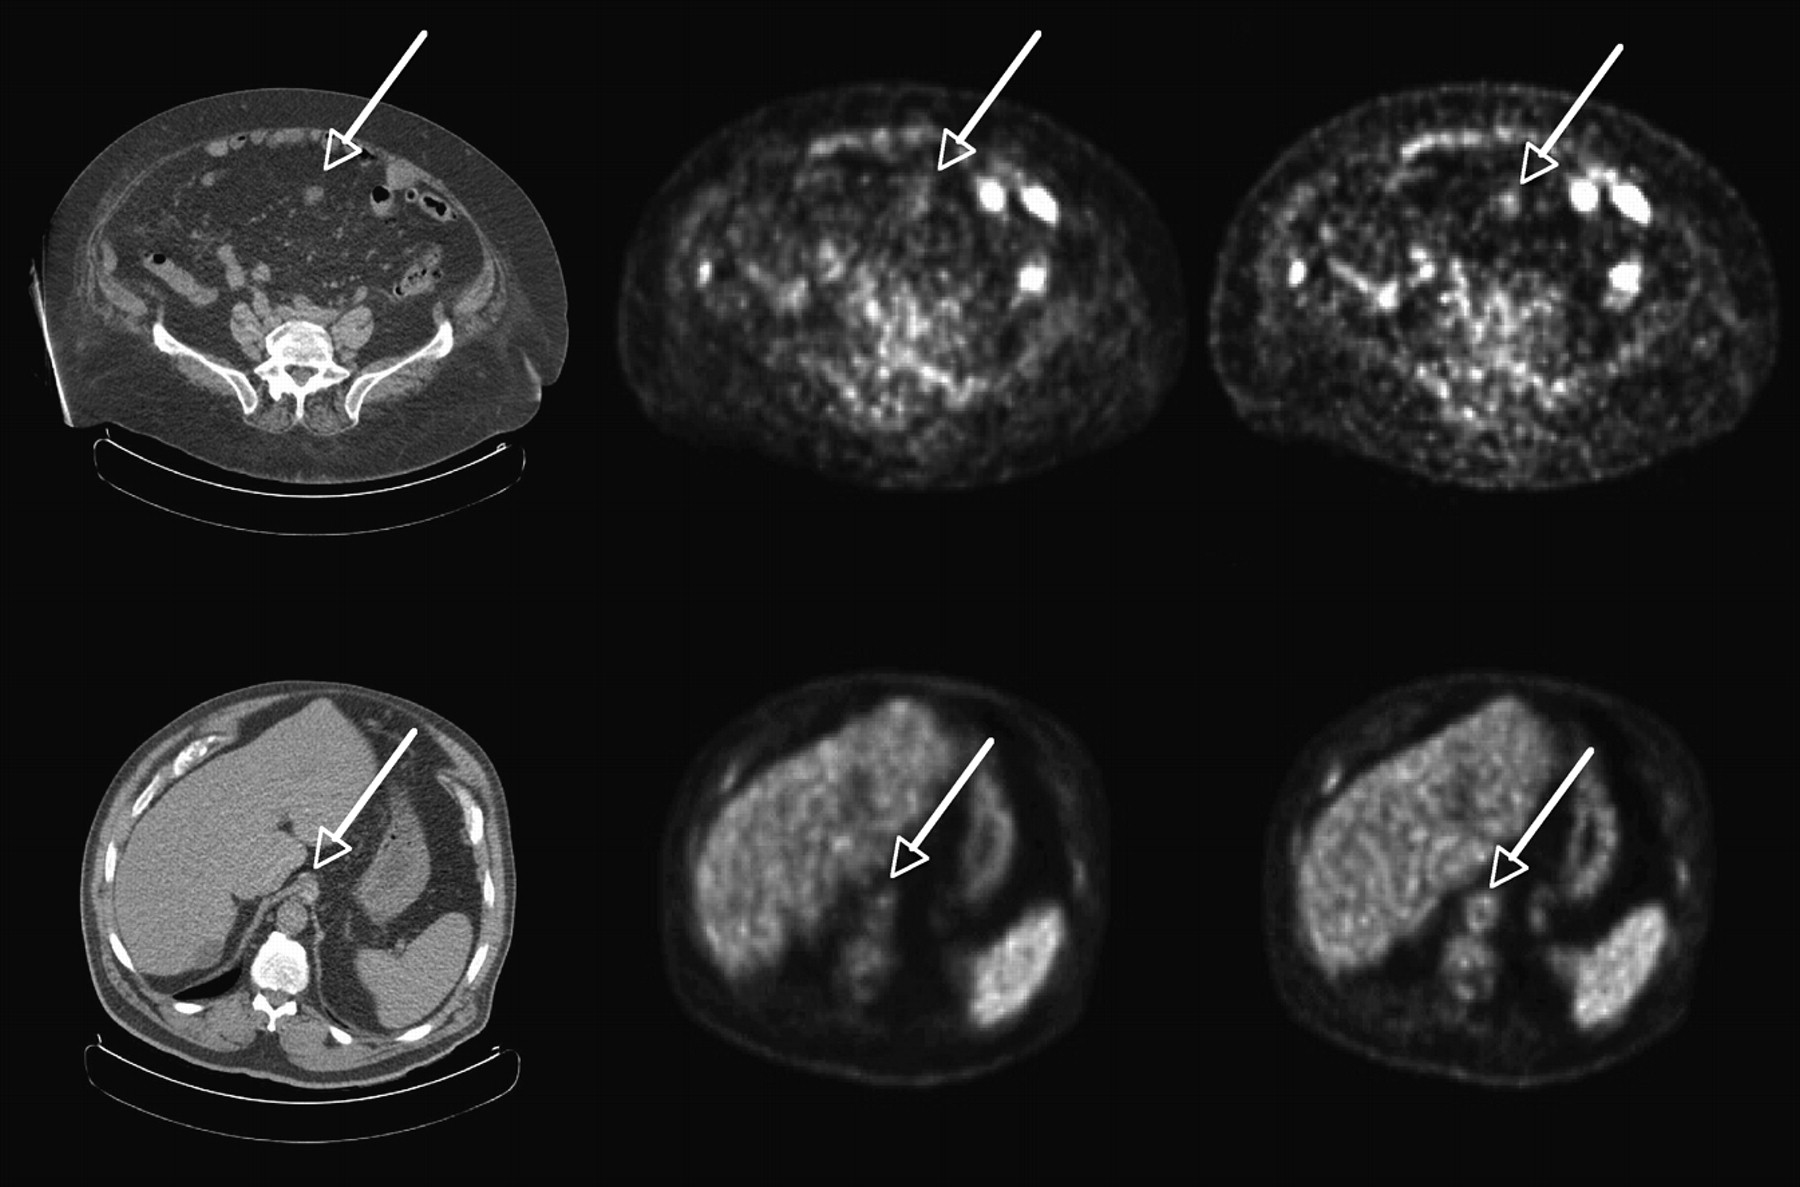
Figure 3 shows transverse images for 2 heavy patients: (top) with colon cancer (weight = 119 kg, BMI = 46.5) and (bottom) with abdominal cancer (115 kg, BMI = 38). In both cases, the images reconstructed with TOF (right) have improved structural detail. The first example indicates uptake in a lesion, correlated with CT, which is difficult to see in the non-TOF image. Figure 4 shows a third patient (140 kg, BMI = 46) with non-Hodgkin's lymphoma and multiple lesions. The different lesions are seen more clearly and with higher uptake in the TOF reconstruction (bottom) than in the non-TOF reconstruction (top).

Representative transverse sections of 2 different patients: low dose CT (left), non-TOF MLEM (middle), and TOF MLEM (right). (Top) Patient 1 with colon cancer (119 kg, BMI = 46.5) shows a lesion in abdomen seen in CT much more clearly in TOF image than in non-TOF image. (Bottom) Patient 2 with abdominal cancer (115 kg, BMI = 38) shows structure in the aorta seen in CT much more clearly in TOF image than in non-TOF image.

Patient with non-Hodgkin's lymphoma (140 kg, BMI = 46). Representative transverse, sagittal, and coronal images (not triangulated) for non-TOF reconstruction (top) and the same cross-sectional images for TOF reconstruction (bottom). In each image, the different lesions are seen more clearly in TOF reconstruction than in non-TOF reconstruction.
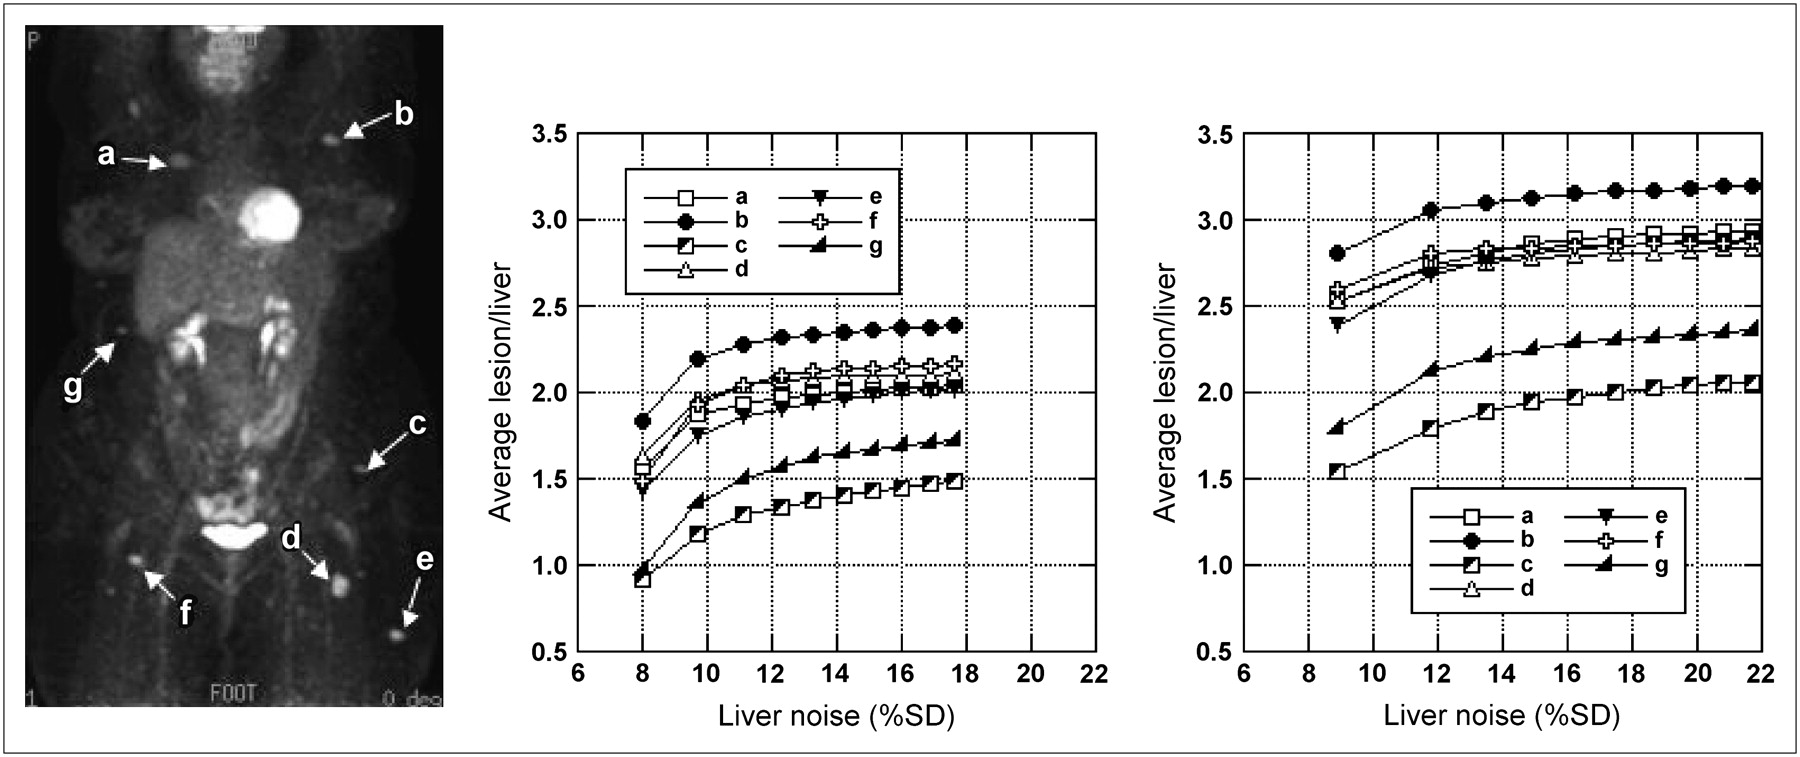
Figure 5 shows the improved contrast recovery achieved with TOF information in the third patient. Figure 5 (left) shows an anterior projection image where the letters (a–g) denote the lesions used in the L/B ratio analysis. Figure 5 (middle and right) shows plots of the L/B ratio as a function of noise in the liver ROI for each lesion without (middle) and with (right) TOF. The L/B ratio curves with and without TOF are plotted on the same scale for direct comparison.

Patient with non-Hodgkin's lymphoma (140 kg, BMI = 46). (Left) Anterior projection image after 10 iterations of TOF MLEM reconstruction is shown. Letters (a–g) denote lesions that were used in the L/B ratio analysis. L/B ratio is plotted vs. noise in liver ROI for 1–10 iterations for each lesion for non-TOF (middle) and TOF (right) reconstructions.
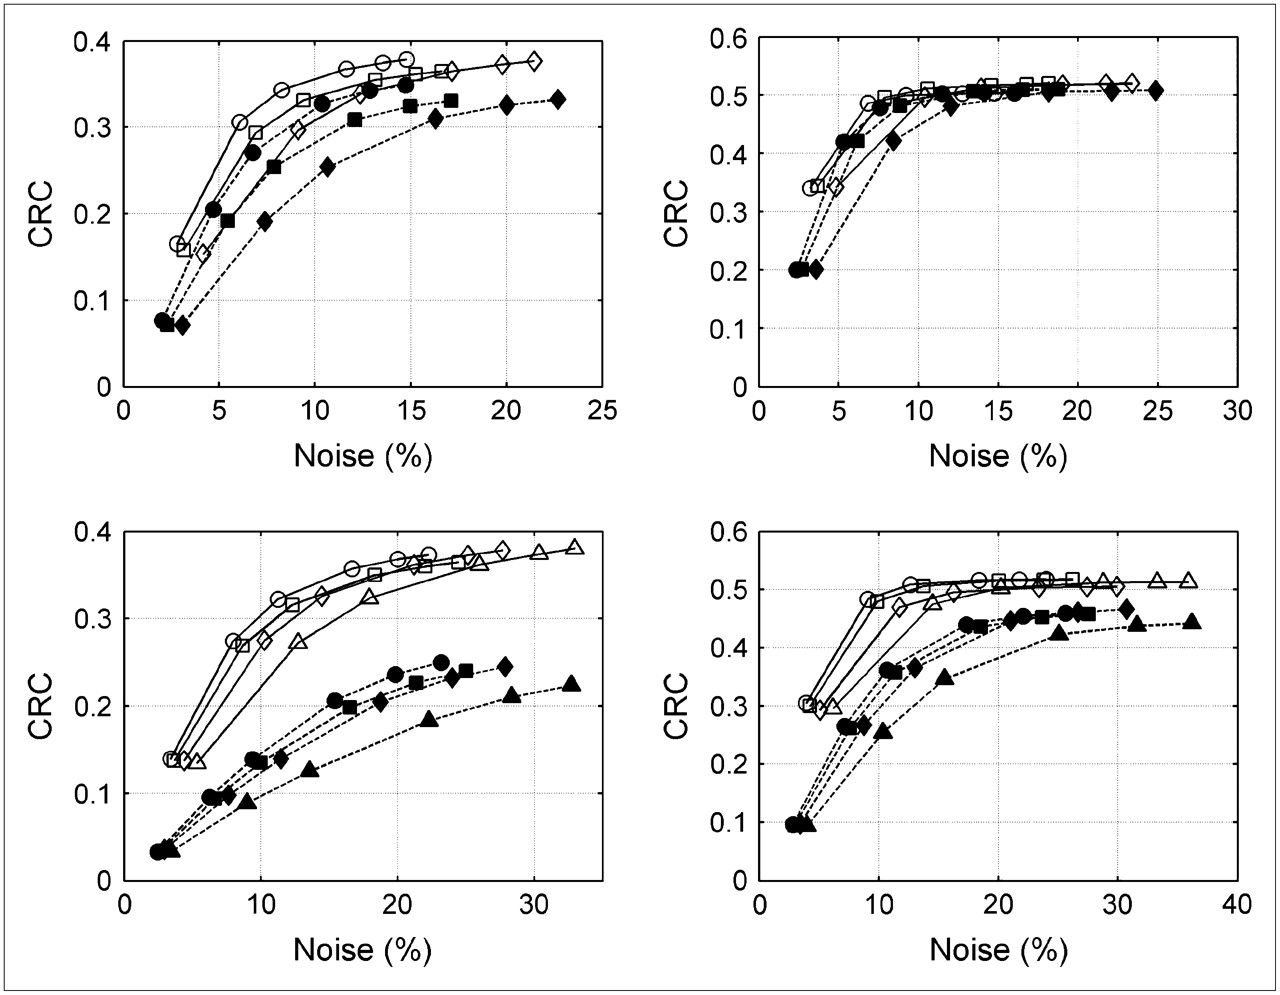
The TOF gain in CRC was calculated as the ratio of L/B ratio with TOF (3 iterations, 33 subsets/iteration) to that without TOF, where the number of iterations for the non-TOF reconstruction was chosen to match the pixel-to-pixel noise in the large liver ROI. Figure 6 shows a plot of TOF gain, averaged over the 6–9 lesions for a given patient, as a function of patient mass. The error bars show the range of TOF gains for that subject. There is a clear trend toward higher TOF gain with increasing patient size, which has been supported by a larger patient study of 30 patients (39).
TOF gain as a function of patient mass. TOF gain for matched noise levels, averaged over 6–9 lesions (1- to 2-cm diameter) for each patient, is plotted as function of patient mass. Error bars reflect the range of TOF gains seen for this patient.
DISCUSSION
The simulation results of (30) illustrated that TOF leads to a better CRC versus noise trade-off but one that is difficult to quantify in terms of a simple sensitivity gain improvement: A single gain factor for TOF improvement does not include the increased rate of convergence with TOF nor does it consider that TOF may converge to a different contrast than non-TOF, although the same statistical algorithm and optimal reconstruction parameters were used in both cases. These results are confirmed with the experimental phantom data. Although any difference in CRC values to which TOF and non-TOF reconstructions converge is important, the increased rate of convergence for TOF is also of practical significance. One needs to fix the number of iterations for an iterative clinical reconstruction, and the faster and less spatially variant convergence of the TOF reconstruction leads to more stable results at earlier iterations.
The patient images demonstrate that the TOF advantages of higher contrast and faster convergence seen in simulated and phantom studies also translate to clinical studies. In a small study of 5 patients, it was seen that the L/B ratio after 10 iterations is higher with TOF than without TOF with only 1 exception of the 37 lesions studied. In routine practice, only 3 iterations are used to keep reconstruction times clinically practical (i.e., to complete reconstruction within 10–30 min after acquisition ends). After 3 iterations, however, the noise in the TOF image is higher than that in the non-TOF image after 3 iterations. If one chooses a non-TOF iteration where noise is matched with that in the corresponding TOF image (4–10 iterations, depending on the patient), the gain in L/B ratio with TOF ranges between −2% and 43%. In the heaviest patient (140 kg), the L/B ratio after 3 iterations with TOF is higher than that without TOF at matched noise by 32%–43%. For the moderately heavy patients (91 and 105 kg), this improvement is in the range of −2%–29% and 16%–38%, respectively. For the average patient (77 kg), the improvement is in the range of 13%–33%. It is worth pointing out that it is almost impossible to compare the noise at a fixed L/B ratio, as most lesions in non-TOF images never reach the TOF L/B ratio.
It can also be seen from the patient studies that the L/B ratio curves with TOF have reached or are very close to convergence by 10 iterations. In fact, the L/B ratio with TOF is within 5% of the 10-iteration value after 3 iterations in 30 of the 37 lesions; after 4 iterations, 95% of the lesions are within their 10-iteration value. The curves without TOF, on the other hand, show a greater spread in convergence rates. Many lesions, especially those close to other areas of high uptake, are quite slow to converge and still have not reached an asymptotic value by 10 iterations. For 23 of the 37 lesions studied, the L/B ratio after 3 iterations differs from the 10-iteration value by >5%. These results suggest that convergence with TOF is more spatially invariant, as noted in a recent study using simulated data (40).
As was observed from the phantom data, TOF allows one to image for shorter times and still achieve good image quality (as measured with the CRC/noise analysis and visual impressions). With or without TOF, image noise increases for shorter scans because fewer events are detected; however, TOF reconstruction leads to improved structural detail, so images with fewer counts may still have satisfactory image quality. This implies that TOF can be beneficial in situations where few counts are collected—for example, dynamic imaging, respiratory gating, and imaging with nonpure positron-emitters, such as 124I—where the positron branching ratio is markedly lower than that of 18F and the complex decay scheme of γ-rays leads to additional random and cascade coincidences.
CONCLUSION
In this work, we have demonstrated that the benefit of TOF in PET seen in simulation carries through to measured phantom and patient studies. On the basis of our findings, we conclude that TOF leads to a better CRC versus noise trade-off in both phantoms and patients, but the TOF gain is not adequately expressed by a single gain factor, because the advantages of TOF are more than a simple increase in effective sensitivity. TOF reconstruction leads to a higher contrast recovery at matched noise with faster and more uniform convergence, and the benefit is even greater for larger patients. This article attempts to quantify the TOF benefit using clinical data and shows results that are consistent with the phantom studies. Studies to assess how these results translate to clinical diagnosis and patient management are currently underway. In addition, we are investigating faster scintillators for better timing resolution and more computationally efficient reconstruction approaches.
Acknowledgments
We especially thank Matthew Werner for implementing the TOF reconstruction and SSS algorithms and for processing much of the data, Joshua Scheuermann for assistance with the phantom data, and Amy Perkins from Philips Research for analysis and helpful discussions about the patient data. We also thank members of the Physics and Instrumentation Group at the University of Pennsylvania and the PET engineering team from the Nuclear Medicine Division of Philips Medical Systems for their technical and scientific help with this work. This work was supported by National Institutes of Health grants R33-EB001684 and R01-CA113941 and sponsored research agreements with Philips Medical Systems and Saint-Gobain Crystals.
Footnotes
-
COPYRIGHT © 2008 by the Society of Nuclear Medicine, Inc.
References
- Received for publication July 2, 2007.
- Accepted for publication November 26, 2007.


Jump to section
Related Articles
Cited By...
- Impact of PET Reconstruction on Amyloid-{beta} Quantitation in Cross-Sectional and Longitudinal Analyses
- Impact of PET reconstruction on A{beta}-amyloid quantitation in cross-sectional and longitudinal analyses
- PennPET Explorer: Design and Preliminary Performance of a Whole-Body Imager
- Fast PET Preview Image Reconstruction, Streaming, and Visualization During Data Acquisition: A Preliminary Study
- Performance Characteristics of the Digital Biograph Vision PET/CT System
- Time-of-Flight Information Improved the Detectability of Subcentimeter Spheres Using a Clinical PET/CT Scanner
- The Effect of Misregistration Between CT-Attenuation and PET-Emission Images in 13N-Ammonia Myocardial PET/CT
- Image Quality and Diagnostic Performance of a Digital PET Prototype in Patients with Oncologic Diseases: Initial Experience and Comparison with Analog PET
- Improving the Detection of Small Lesions Using a State-of-the-Art Time-of-Flight PET/CT System and Small-Voxel Reconstructions
- Update on Time-of-Flight PET Imaging
- Effect of Time-of-Flight Technique on the Diagnostic Performance of 18F-FDG PET/CT for Assessment of Lymph Node Metastases in Head and Neck Squamous Cell Carcinoma
- Determination of Accuracy and Precision of Lesion Uptake Measurements in Human Subjects with Time-of-Flight PET
- Improvement in PET/CT Image Quality with a Combination of Point-Spread Function and Time-of-Flight in Relation to Reconstruction Parameters
- Impact of Time-of-Flight PET on Whole-Body Oncologic Studies: A Human Observer Lesion Detection and Localization Study
- Improvement in Lesion Detection with Whole-Body Oncologic Time-of-Flight PET
- Additional Gains with Time-of-Flight PET at High Counting Rates: Lessons Learned from Early Time-of-Flight PET Systems
- PET/MRI: Paving the Way for the Next Generation of Clinical Multimodality Imaging Applications
- An Assessment of the Impact of Incorporating Time-of-Flight Information into Clinical PET/CT Imaging
- Impact of Time-of-Flight on PET Tumor Detection