


Abstract
Accurate marrow dosimetry for radionuclide therapy based on imaging methods has been challenging because of a variety of factors. One of the uncertainties in image quantification of lumbar vertebrae is correction for radioactivity in large blood vessels anterior to the vertebrae. We developed a method to correct for background radioactivity contributed from blood in large vessels and tested it in a pilot study. Methods: CT images of 26 patients receiving 111In- or 131I-labeled conjugates were used to measure the inside diameters of the aorta and inferior vena cava (IVC) at the top of L2 and the bottom of L4 and to measure the length of this vessel segment. The volume was calculated for this vessel segment, and then the radioactivity in that volume at each imaging time was determined using a time-variant blood radioactivity concentration as established by serial blood samples. This vessel segment typically overlapped with lumbar vertebrae in anterior and posterior whole-body images. The contribution of this background radioactivity to the cumulated activity of the lumbar spine region of interest (ROI) from serial γ-camera images was determined, taking into account differences in attenuation between vessel segments and lumbar vertebrae. Results: The total blood volumes varied from 25 to 94 mL, with a mean of 51 mL. This mean is 76% of the mean marrow volume of 3 lumbar vertebrae measured in some of these patients. Thirteen of the 14 patients evaluated for aortic position had the aortic segment completely within the L2–L4 ROI. For the IVC, a mean of 72% was in the L2–L4 ROI. Adjusting for radioactivity in major blood vessels that were in the ROI led to lower marrow dose estimates. Conclusion: To improve the accuracy of lumbar spine imaging-based marrow dosimetry, one can adjust radioactivity in the large vessels by methods that measure the volume, position, and depth of vessels in the ROI.
Bone marrow dosimetry has been of special interest in radionuclide conjugate therapy for cancer because marrow suppression is often the dose-limiting toxicity. Marrow dosimetry can be generally categorized into 2 methods: based on radioactivity in the blood (1–3) or based on image quantification (4–7). Although the blood-based method is recommended for radiopharmaceuticals with no active marrow uptake, imaging-based methods are recommended for radiopharmaceuticals with active marrow uptake (8). Imaging-based dosimetry using the sacral or lumbar vertebrae often results in a higher marrow radiation dose estimate than that using the American Association of Physicists in Medicine–described blood-derived method (1,2), even when no uptake in marrow is known. Despite factors contributing to uncertainties, the correlation between toxicity and imaging-derived marrow dose has been superior to that using the blood-derived method (6). Thus, when lumbar or sacral bony areas can be distinguished from surrounding soft tissues, an imaging-based dosimetry method has been recommended. These imaging-based methods are supported by 3-dimensional, patient-specific approaches (9,10). However, calculating accurate dosimetry using these imaging methods has been challenging because of several factors, including large blood vessels near lumbar vertebrae, bladder activity in the sacral region, or the nonuniform distribution of targeted disease in the sacral or lumbar marrow, resulting in poor representation of the whole marrow (11).
In the current study, we addressed the issue of radioactivity in major blood vessels as a source of error to lumbar vertebral radioactivity quantification and the impact of correcting the background radioactivity in this region of interest (ROI) for this contribution. A new method was developed to improve the accuracy of lumbar vertebral imaging-based marrow dosimetry using blood concentration determined with a γ-counter and blood vessel geometry determined from patient CT images.
MATERIALS AND METHODS
Patients
Twenty-six patients receiving 111In-ibritumomab tiuxetan (n = 8), 111In-CC49 (n = 9), 111In-B9E9 pretarget (n = 5), or 131I-HuCC49ΔCh2 (n = 4) were considered in the current analysis. The details of the radiopharmaceuticals and their administration have previously been reported (12–15). These patients were selected to span the wide range of blood clearance times observed with various radiopharmaceuticals to assess the impact of radioactivity in blood vessels on image quantification of lumbar vertebral marrow. Although 111In-B9E9 pretarget (14) and 131I-HuCC49ΔCh2 (13) patients had relatively fast blood clearance and were expected to have less background contribution to marrow image quantification, 111In-ibritumomab tiuxetan (12) and 111In-CC49 (15) patients had slower blood clearance and were expected to have more background contribution to marrow image quantification. The patient selection criteria included abdominal CT images that covered lumbar vertebrae L2 through L4 for vessel volume measurement, serial blood samples that allowed determination of radioactivity in blood vessels, and a relatively wide range of patient body size. Twenty-six of our 65 patients were selected in the current analysis because they met these criteria. Thirteen of these 26 patients had adenocarcinoma, and the remainder had lymphoma. Of the 26 patients, 13 were male.
Blood Vessel Volume Measurement
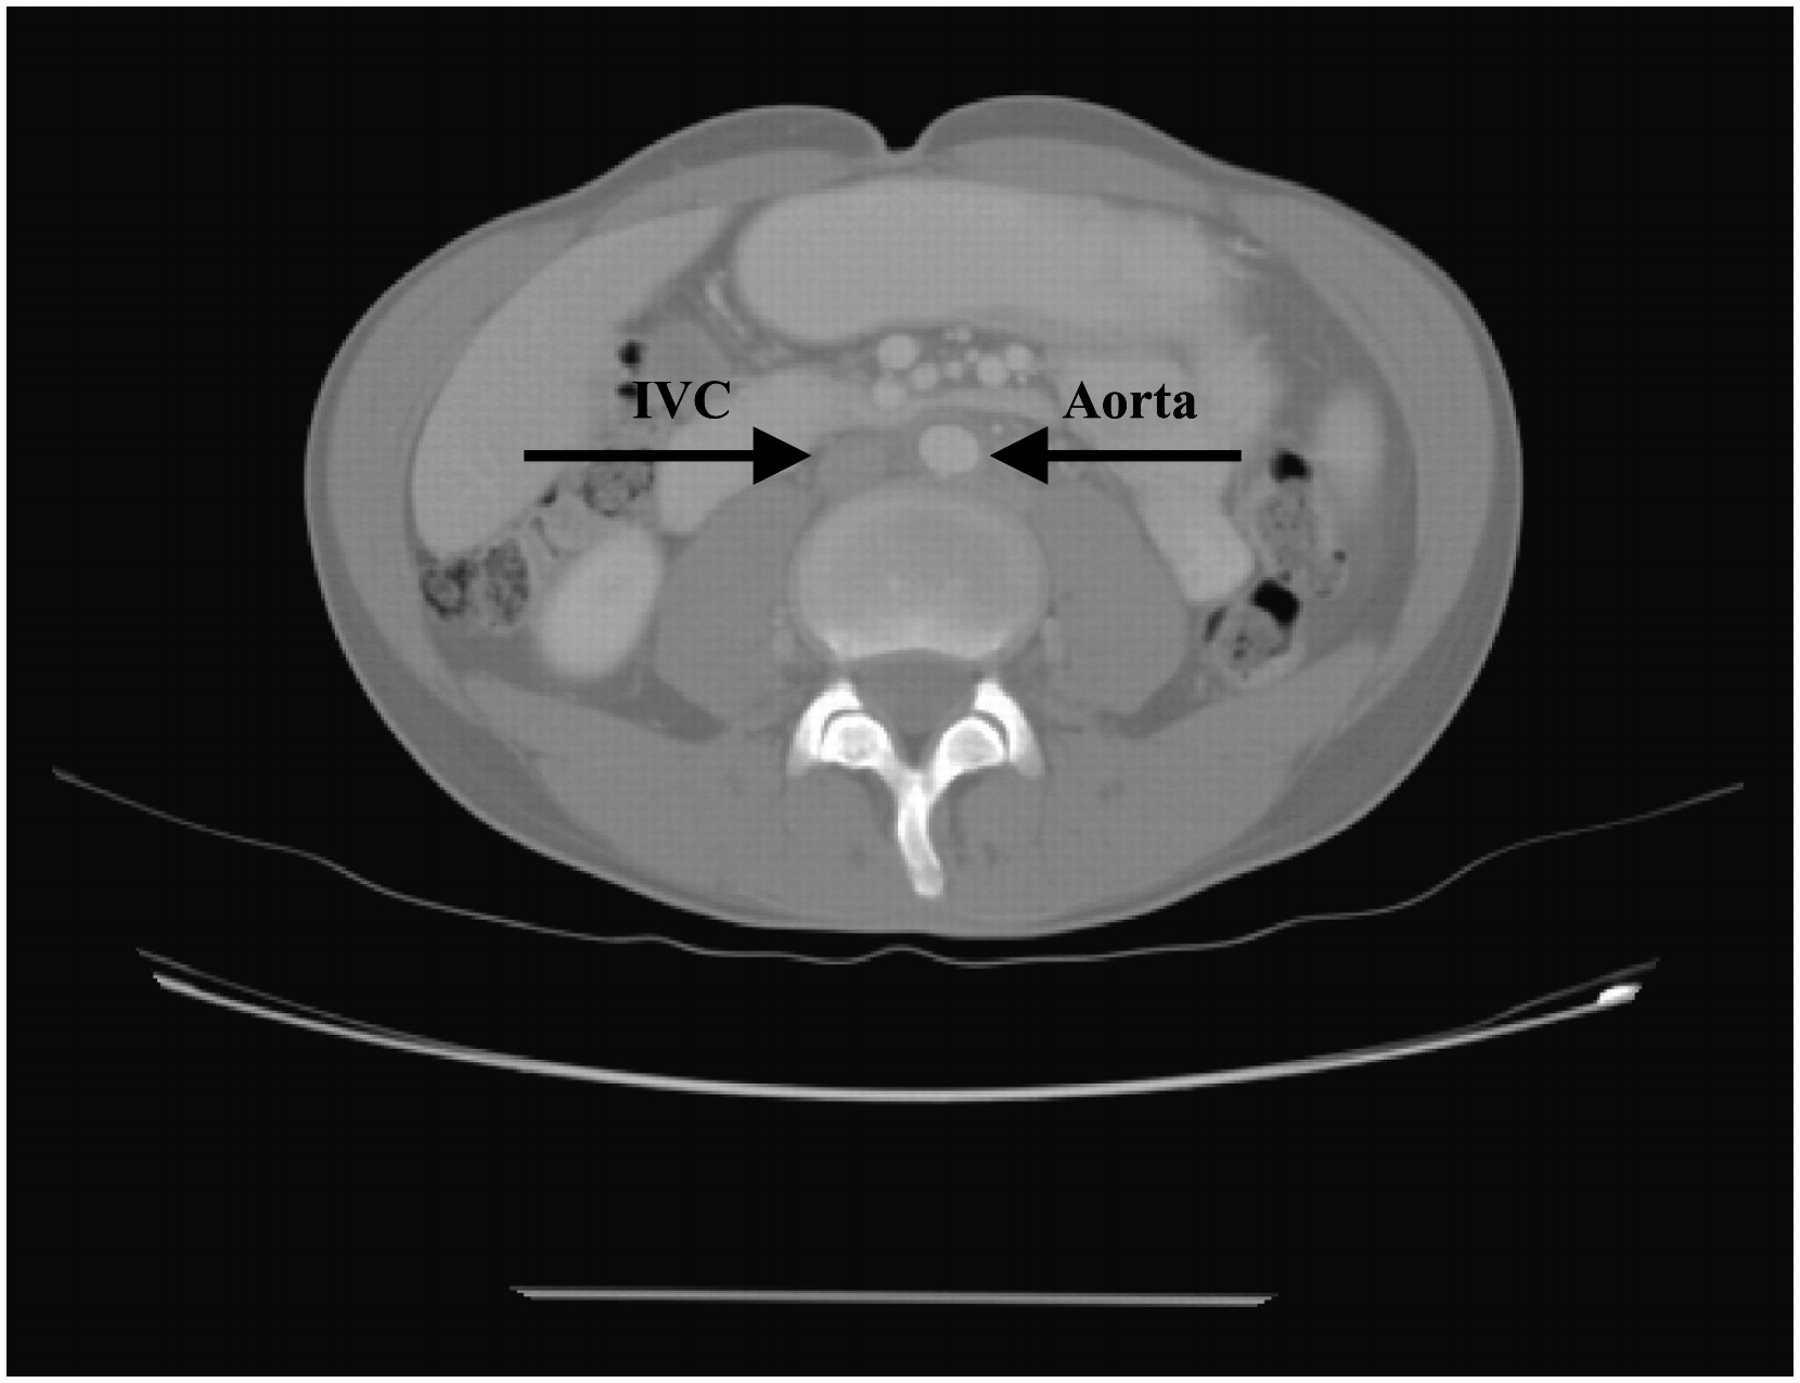
Abdominal CT images of 26 patients receiving intravenous administration of 111In- or 131I-labeled tumor-targeted radionuclide conjugates were magnified (or zoomed) to measure the inside diameters of the aorta and inferior vena cava (IVC) at the top of L2 and bottom of L4 and to measure the length of this vessel segment (Fig. 1). Most CT image slices were either 3 mm thick or 5 mm thick; the remainder were of 10-mm thickness. If the aorta divided to become the iliac vessels above the image at the bottom of L4, the lowest slice before the split was used for the aortic diameter whereas the length was measured from the bottom of L4. The volume of this length of the aorta and IVC was calculated assuming a linear slope between the upper and lower lumen diameters or was calculated using the Eclipse computer volumetrics program (Varian Medical Systems, Inc.) after the area of each vessel had been determined from CT slices 3 mm apart for the entire vessel segment. The length was measured from scout views for which the accuracy of the couch position in the inferior/superior direction is 1 mm. The IVC was usually ellipsoid; thus, the area was calculated from measurements of the short and long axes. The percentage overlap of the aorta and IVC with the vertebral body was assessed visually by placing a perpendicular line from the posterior surface at the edge of the vertebra to determine the portion not directly anterior to the vertebra. The mean of the percentage overlap from the superior border of L2, the inferior border of L4, and the center of the L2–4 region was used for background radioactivity correction.

CT image of lumbar ROI illustrating relative position and depth of aorta and IVC compared with spine.
Image and Blood Data Collection and Analysis
The scheme for imaging and for blood data collection and analysis consisted of the following steps: image acquisition, blood sample collection and cumulated activity determination, image quantification of lumbar vertebrae, and correction of the cumulated activity of lumbar vertebrae from that of blood vessels. All these steps were described in detail previously (16–18), except for correction of the cumulated activity of lumbar vertebrae from that of major blood vessels. Briefly, planar conjugate views were acquired with a dual-detector camera. Medium-energy collimators were used for 111In, and high-energy collimators were used for 131I. Whole-body scans were acquired immediately and at approximately 24, 48, 72, and 120–168 h after the dose injection; pretargeted studies were also acquired 2 h after the injection images.
Serial blood samples were collected at approximately 15 min, 30 min, and 1, 2, 4, 24, 48, 72, and 120 h after injection. In the pretargeted studies, blood samples were also collected at 6, 8, and 12 h after injection. The radioactivity concentration in the blood samples was determined by co-counting a calibrated standard to convert counts per minute to Bq. The cumulated activity concentration in the blood was determined by a biexponential (A·e(−0.693t/Tα) + B·e(−0.693t/Tβ)) or monoexponential (A·e(−0.693t/T)) fit of the time–activity curve, depending on the characteristics of the clearance. The cumulated activity in the major blood vessels within the L2–L4 region was then determined by multiplying the blood volume by activity per milliliter.
With the exception of background correction, the radioactivity in the L2–L4 lumbar spine was quantified as described by DeNardo et al. (5), Macey et al. (7), and Lim et al. (6).
Because the lumbar spine was not visualized on the anterior views for most patients, images were quantified using the posterior ROI and attenuation was corrected using depths from the posterior body surface. The distances from the posterior body surface to the center of the aorta and IVC were applied to correct depth attenuation for individual patients using the effective linear attenuation coefficient μ, which was determined from phantom measurements (17). The contribution of the radioactivity in this overlapping vessel segment was subtracted as background radioactivity from radioactivity in the L2–L4 ROI. The change in calculated marrow dose using this more precise background subtraction was compared with that using a usual background region lateral to the spine.
Statistical analysis included calculation of the mean and median of various measured parameters.
RESULTS
Blood Vessel Volume Measurement
In the upper chest the aorta is to the left of the spine. It moves medially with descent and is anterior to the vertebrae in the lumbar spine. We found that the diameter of the aorta narrowed from proximal to distal points measured. In the lumbar region, the IVC may be entirely anterior to the vertebral body, but frequently a portion of it is lateral to the spine. Lateral and anterior displacement is common in patients with retroperitoneal adenopathy. The medians and means were identical for the aortic diameter at L2 and at L4 and for the area at L2; there was only a 6% difference between the mean and median aortic diameter at L4. The difference in the cross-sectional area of the aorta versus the IVC observed at the L2 and L4 levels is presented in Table 1. There was less than a 2-fold difference between the smallest and largest aortic diameters measured. The range for the area of the IVC was greater than that of the aorta but less than 4-fold so. The area of the IVC was greater than that of the aorta in most patients.
Cross-Sectional Area of Aorta and IVC Measured at L2 and L4 Levels
The volume of the aorta between L2 and L4 varied from 10 to 33 mL, with an average of 19 mL (Table 2). The diameter of the IVC was less consistent in configuration changes over the length of the L2–L4 spine than was the diameter of the aorta. One patient had an excessively dilated IVC, and another had partial compression. The volume of the IVC between L2 and L4 varied from 15 to 69 mL, with an average of 31 mL. As shown in Table 2, the total blood volume for the aorta and IVC in the L2–L4 region varied from 25 to 94 mL, with a mean of 51 mL (medians were <3% from means). This volume is 76% of the mean marrow volume from 3 lumbar vertebrae measured from trabecular bone in a similar group of patients, some of which are in the study (18).
Aortic and IVC Volumes from L2–L4: Comparison with Trabecular Lumbar Marrow Volume
Depth measurements were also compared from the posterior skin surface to the mid vertebral body versus the mid aorta and IVC at the L2 and L4 levels in a subset of 21–23 patients (Table 3). In this subset, the maximum posterior depth of the aorta was 20.2 cm and that of the vertebral body was 16.3 cm. For individual patients, the difference in the posterior depth between the aorta and vertebral body was 1.7–7.6 cm (mean, 3.0 cm) at the L2 level and 1.3–4.2 cm (mean, 3.0 cm) at the L4 level. These depths are illustrated in Figure 2, which shows the depth to the mid axial plane of the aorta, IVC, and vertebral body for individual patients at the L4 level. Figure 2 shows that the mid aorta was closer to the surface than was the mid IVC in most patients and was at the same depth in the remainder. As shown in Table 3, the mean mid planes of the aorta, IVC, and vertebral body were further from the posterior skin at the L4 level than at the L2 level. For individual patients, the difference in the posterior depth between the mid vertebral body at L4 and L2 was a mean of 1.60 cm, with a median of 1.44 and a range of 0.11–5.1 cm. The mean difference from the aorta and IVC to the vertebral body from the posterior surface was about 3 cm at the L2 and L4 levels, although the maximal difference was more than 7 cm.
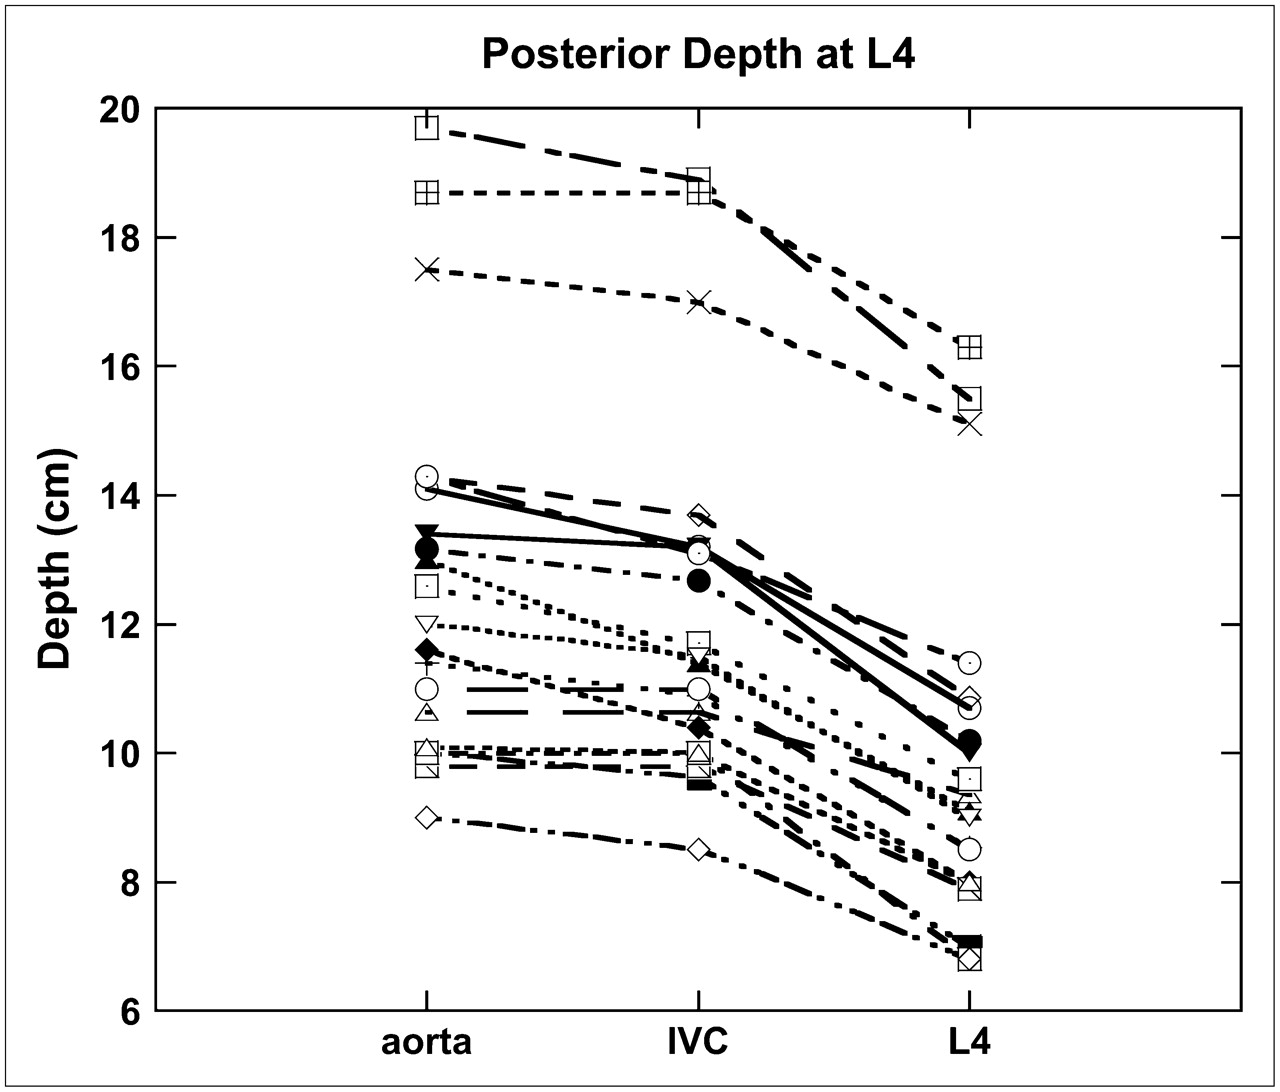
Comparison of depth of aorta, IVC, and vertebra from posterior surface at L4. Each line represents data from an individual patient.
Comparison of Depth (cm) of Mid Aorta, IVC, and Vertebral Body from Posterior Surface at L2 and L4
Comparison is made in Table 4 of parameters (effective blood and whole-body half-life [T1/2] and blood concentration) for the subgroups of this study based on radionuclide conjugate. The cumulative blood radioactivity was expressed as GBq-s/mL of blood. The group of patients showing the smallest blood vessel radioactivity contribution (1%–7%) to marrow dose is the group that had the shortest effective T1/2 of radioactivity in blood and the whole body as well as the lowest blood concentration by direct sampling (Table 4). The marrow dosimetry estimates for the remaining patients were reduced by 6%–28% when correction was made for blood activity in the major vessels that were included in the lumbar spine ROI.
Impact of Effective T1/2 and Cumulated Blood Activity Concentration on L2–L4 Imaging-Based Marrow Dose
DISCUSSION
Radioactivity in the blood of the major vessels included in ROIs of lumbar vertebrae introduces errors to dosimetry estimates based on lumbar marrow imaging. In previously reported methods (6,7), the radioactivity in the blood of the lumbar vessels was implicitly corrected using 2 background ROIs immediately adjacent to the L2–L4 ROI. These background ROI selections assume, implicitly, that a portion of blood vessels in the L2–L4 ROI (or behind L2–L4 in the posterior view) is somewhat equivalent to the portion of blood vessels in the background ROI immediately adjacent to the L2–L4 ROI. In the current study, we evaluated this implicit assumption and developed an explicit method to correct the blood vessel contribution for patients with various blood volumes and clearance half-lives of the radiopharmaceuticals.
There was greater than a 2-fold variation in the total volume of blood in the L2–L4 segment of the patients evaluated. This variation did not appear to correlate with the height of the individuals, but the blood volume was affected by disease states such as the degree of atherosclerosis and tumor compression of the IVC. The mean blood volume of 51 mL is 76% of the mean marrow volume of 67 mL (range, 46−102 mL) previously measured in 3 lumbar vertebrae (18). Thus, accounting explicitly for the amount of radioactivity in the vessels should improve dosimetry accuracy. The dosimetry effects from radioactivity in the major vessels are influenced by their relative position and cumulative radioactivity. Considering attenuation from posterior measurements, the mean distance was 3 cm between the mid plane of the vertebral body and that of the aorta. Previously, we used the effective point source method to determine 111In in vertebrae with a measured linear attenuation coefficient of 0.109 cm−1, which resulted in a derived attenuation correction factor range of 2.02–3.20, with a mean of 2.46 (18). In that report, which includes a subset of the patients of this study, a single point measurement in the mid L2–L4 region showed a mean depth from the posterior surface of 8.2 cm, (range, 6.5–10.7 cm). A prior study of Macey et al. (7) found a mean depth of 7.9 cm, which was relatively independent of the patients' height, weight, or abdominal girth, but the report did not indicate if the depth measured was at the L3 vertebra, which would be the midpoint of the ROI studied. Our current study showed a mean depth of 9.0 cm from the posterior skin at the top of L2 and 9.8 cm at the bottom of L4. For attenuation correction in the current study, we used the mean of the depth of L2 and L4 vertebrae for individual patients. The mean depths of L2 and L4 were slightly greater than previously reported (7,18). The depth of the vertebrae and major vessels varied more in individual patients than the difference between the mid vertebral body and vessels. The mid IVC was closer to the vertebral body than was the mid aorta in most patients, but taken as a whole, these measures between the vertebra and vessels were about 3 cm. The largest difference in this series was in patients who had adenopathy that displaced the vessels anteriorly from the vertebrae.
In the studies reported by Macey et al. (7) and Lim et al. (6), background ROIs were drawn on both sides of the lumbar spine ROI for quantification of background activity. Based on the anatomy in our series, the right background region may have included a portion of the IVC for some patients. The width of vertebral bodies among our patients was similar to the 5.2 ± 0.2 cm measured from CT scans in 20 patients in a prior report of Lim et al. (6). Lim et al. (6) did not report whether measured values for background on the right and left 1 cm lateral to the ROI differed. Such differences would be expected because the right side is likely to include a portion of the IVC whereas the aorta is usually totally overlapped with the vertebral body on the left and therefore not contributing to a background ROI lateral to the vertebra.
It would be expected that the larger the cumulative blood radioactivity of the radiopharmaceutical is, the greater the error will be when one does not account for this radioactivity in lumbar spine imaging-based dosimetry. Our data using 4 groups of patients who received radionuclide conjugates with varying times of circulation were consistent with this concept but also showed greater than a 4-fold variation between individual patients receiving the same radiopharmaceutical. Because this was a pilot study, insufficient numbers of patients in each group were analyzed to provide meaningful statistical analysis for correlation between cumulative blood radioactivity and calculated marrow dose. Although one goal of more accurate marrow dosimetry is to improve the correlation between calculated dose and toxicity, the current study does not lend itself to that analysis because of the multiple divergent factors among a relatively small group of patients. Factors such as prior and concurrent chemotherapy are known to affect toxicity but are not accounted for in the dosimetry calculations. Another recent method of marrow dosimetry that has shown improved correlation between imaging-based dosimetry and toxicity parameters used serial quantitative SPECT (19). The SPECT technique may be more precise but is not as practical for most clinical settings as are planar whole-body scans, which are widely used. Also in agreement with our study is the SPECT study of Boucek and Turner (19), who found a relatively high uptake in major vessels within the ROI on planar images after 5 d and indicated that activity in the aorta and adjacent lymph nodes could not easily be distinguished from marrow. Because our study did not address uptake in paraaortic nodes, it is expected that marrow doses would be overestimated by planar imaging–based dosimetry when paraaortic nodes show uptake. A potential small error that we were not able to assess is consideration for a higher level of radioactivity in arterial blood (aorta) than in the IVC. In this report, the blood quantitated was venous, and it was assumed that arterial and venous blood had the same radioactivity per unit volume as that sampled.
Additional uncertainties remain in this pilot study. First, the CT images used were obtained before treatment and might not have reflected changes in adenopathy or other factors that affect the volume of blood in the IVC at the time of the dosimetry study. Second, only approximations of the percentage IVC overlap with the adjacent vertebral body were used. More precise volumetrics would require additional effort for small changes. Third, additional small errors come from the lack of a perfectly circular aortic diameter because of irregularities such as plaque. A computer volumetrics program—such as that used for some of the patients in this study—that allows edge detection rather than manual measurements of each slice could improve accuracy. Fourth, blood pharmacokinetics and cumulated activity were calculated using the best fit of periodic sampling. The relatively frequent blood sampling for pharmacokinetics is preferable to fewer sampling points but is invasive, inconvenient, and rarely done outside a clinical trial. Fifth, we chose to use the average depth from the L2–L4 measurement, rather than the actual measurement at each end with a gradient between them. Finally, total marrow mass was assumed to be that of standard phantoms. Individual marrow volume was not established as in our prior studies or projections based on the anthropometric parameters described (20). Nevertheless, this study reflects an effort to improve background radioactivity correction, which intuitively improved the accuracy of imaging-based marrow dosimetry.
CONCLUSION
This report indicates that when one takes into account the contributions from radioactivity in the major blood vessels of the lumbar spine using imaging methods of marrow dosimetry, the estimated absorbed dose can become lower. The extent of change is affected by the cumulated activity in the blood and thus is least with radiopharmaceuticals that have a short effective T1/2 or low concentration and in patients with smaller volumes of blood. Additional study is warranted to determine whether this new method improves the correlation of dosimetry with biologic outcome.
Acknowledgments
The authors thank Tracey Cotton-Young for manuscript preparation, Gayle Elliott Hines for technologic assistance, Jeanne Connor and Dayle Craig for nursing, NeoRx and Biogen-IDEC for permission to use patient data, and the National Institutes of Health for support from grants MO1 RR00032, 1 P50 CA83591-03, 1 P50 CA89019-03, and NO1 CM-57725. This work was presented at the 2005 annual meeting of the SNM.
Footnotes
-
COPYRIGHT © 2008 by the Society of Nuclear Medicine, Inc.
References
- Received for publication July 10, 2007.
- Accepted for publication October 29, 2007.


