


Abstract
Reduced cerebral blood flow and cerebrovascular reactivity to acetazolamide have been used as predictors for subsequent ischemic stroke in patients with occlusive carotid artery diseases, called type 3 ischemia. However, recent studies have shown that reduced cerebrovascular reactivity to acetazolamide does not always represent elevated oxygen extraction fraction (OEF). The aim of this study was to establish the methodology to improve the validity of an acetazolamide test identifying elevated OEF. Methods: This study included 65 patients who developed transient ischemic attack or minor completed stroke attributable to occlusive carotid artery diseases. Hemodynamic and metabolic parameters in the bilateral middle cerebral artery territories were determined in all patients by 15O-gas PET. Results: Type 3 ischemia alone had 100% sensitivity and 83.2% specificity for identifying elevated OEF, but its positive predictive value and accuracy were low, 47.2% and 0.85, respectively. However, type 3 ischemia and delayed mean transit time combined had an 83.3% positive predictive value and 0.96 accuracy. Conclusion: The results strongly suggest that type 3 ischemia and delayed mean transit time together may be powerful predictors in identifying elevated OEF with high sensitivity and specificity, predictive values, and accuracy. SPECT may be able to define the patients with elevated OEF more easily and at lower costs than PET, although further study would be necessary to compare the results by using SPECT.
There is increasing evidence that hemodynamically compromised patients with internal carotid artery (ICA) occlusion are at higher risk for subsequent ischemic stroke. For 20 y, an elevated oxygen extraction fraction (OEF) determined by PET has been believed to represent critical reduction of cerebral perfusion pressure, also called misery perfusion or stage II ischemia, which is defined as an elevated OEF due to critically reduced perfusion pressure (1,2). Recent statistical studies have shown that elevated OEF is a powerful and independent predictor of subsequent stroke in patients with symptomatic occlusive carotid diseases (3–5).
In addition to OEF measured by PET, cerebrovascular reactivity (CVR) to acetazolamide determined by SPECT has been used as a predictor for subsequent ischemic stroke in patients with occlusive carotid artery diseases, because SPECT is more widely available and can be performed at lower cost than PET (6,7). However, recent studies have shown that reduced CVR does not always represent elevated OEF. According to studies by Kuroda et al. and Nemoto et al., only about half of the patients with reduced CVR had an elevated OEF (8,9). Based on these results, therefore, Kuroda et al. (8) concluded that type 3 ischemia, which is defined as a reduced cerebral blood flow (CBF) and CVR (10), includes 2 pathophysiologically different conditions: misery perfusion due to hemodynamic compromise and matched hypometabolism due to incomplete infarction (8). Further observation has proven that the patients with type 3 ischemia can also be categorized into 2 subgroups with different prognosis, because the patients with type 3 and elevated OEF were at significantly higher risk for subsequent ipsilateral stroke than those with type 3 but normal OEF (11). Despite these recent observations, a SPECT scan and an acetazolamide test would be still useful modalities to select the patients at higher risk for subsequent ischemic stroke at lower costs than PET. It is important to establish the methodology to detect misery perfusion or stage II ischemia more efficiently with SPECT, because 15O-gas PET is not widely available.
In this study, we aimed to improve the predictive power of an acetazolamide test to identify elevated OEF by using variables, such as CBF, CVR, cerebral blood volume (CBV), and mean transit time (MTT), that can be determined by SPECT. We quantified CBF, CVR, CBV, and MTT in patients with occlusive carotid artery diseases, using 15O-gas PET, and evaluated the sensitivity, specificity, predictive values, and accuracy of each parameter for detecting elevated OEF.
MATERIALS AND METHODS
Patients
The present study included a total of 65 patients (44 men, 21 women; mean age, 62.3 y [range, 32–79 y]) who were admitted to our hospital from April 2003 to March 2007. All of the patients met the following criteria: severe stenosis (>90%) or occlusion of the ipsilateral ICA or middle cerebral artery (MCA); no or, if any, small infarction on MRI; and history of transient ischemic attacks or minor completed stroke (Rankin score, 1 or 2) due to carotid occlusive disease. Clinical symptoms included transient ischemic attacks in 16 patients and minor completed stroke (Rankin score, 1 or 2) in 49. Digital subtraction angiography or MR angiography showed ICA occlusion in 21 patients, ICA severe stenosis in 23, MCA occlusion in 12, and MCA severe stenosis in 9. All PET studies were performed at least 4 wk after the last ischemic episode, because the studies in an earlier period might affect the correct interpretation of the data (10).
PET Measurements
All patients were scanned with an ECAT EXACT HR+ (Siemens) as described previously (8,11,12). Briefly, the PET scanner provides 63 tomographic images with 2.425-mm intervals by the continuous axial motion of the gantry. The image slices were parallel to the orbitomeatal line. Before emission scanning, a transmission scan using a 68Ga line source was obtained to correct tissue attenuation. One-minute inhalation of 15O-CO (2 GBq/min) followed by 3-min static scanning and 3-time arterial blood sampling were performed to measure CBV. After 15 min of inhalation of 15O-O2 (0.5 GBq/min), a steady-state O2 image was obtained and 3-time arterial blood sampling was performed for 5 min to measure OEF and cerebral metabolic rate for oxygen (CMRO2). Finally, to determine CBF, a steady-state CO2 image was scanned and 3-time arterial blood sampling was performed for 5 min, after 15 min of inhalation of 15O-CO (0.5 GBq/min). Ten minutes after the resting CBF measurement, an intravenous injection of 10 mg of acetazolamide per kilogram was administered. Fifteen minutes later, the CBF was measured by the same procedure as for the resting state. As described previously (6,8,11), CVR to acetazolamide was quantitatively determined using the following equation: CVR (%) = 100 × (CBFACZ − CBFrest)/CBFrest, where CBFrest and CBFACZ represent CBF before and after intravenous injection of acetazolamide, respectively. MTT was also calculated on the basis of the ratio of CBV/CBF. Ten-millimeter-diameter circular regions of interest (ROIs) were drawn on ipsilateral and contralateral MCA territories, except for the infarction area, on 15O-gas PET images in each patient.
Control values (mean ± SD) of CBF (44 ± 4 mL/100 g/min), CMRO2 (3.3 ± 0.3 mL/100 g/min), OEF (0.4 ± 0.05), CBV (3.4 ± 0.5 mL/100 g), and MTT (0.08 ± 0.02 min) in the MCA territory on 15O-gas PET were obtained from 6 healthy volunteers free of cerebrovascular disease. The values were rated as reduced when any value was less than the mean − 2 SDs and rated as elevated when any value was more than the mean + 2 SDs. Based on our previous studies, CVR was judged as reduced when the value was less than 14% (6,8,11). We have classified each ROI into the following 4 groups: type 1 (normal CBF and CVR), type 2 (normal CBF and reduced CVR), type 3 (reduced CBF and CVR), and type 4 (reduced CBF and normal CVR). In this study, we defined reduced CBF (<36 mL/100 g/min) and reduced CVR (<14%) as type 3 ischemia (6,8,11).
Data Analysis
The PET images were automatically coregistered to axial T1-weighted MR images to avoid drawing the ROIs in an infarct area and were registered using a fully automatic multimodality image registration algorithm on a Unix-based workstation (Indigo 2; SGI Inc.) (8). All data were expressed as mean ± SD. The data between 2 groups were compared by unpaired t test. Relationships between 2 PET parameters were evaluated using a linear or nonlinear regression analysis. Differences with a P value of less than 0.05 were considered statistically significant.
RESULTS
The PET parameters including CBF, CVR, CBV, CMRO2, MTT, and OEF were quantitatively determined in a total of 130 ROIs for 65 patients in this study. As shown in Table 1, CBF and CMRO2 were significantly lower than control values (P < 0.01). On the other hand, OEF and MTT were significantly higher than control values (P < 0.05 and P < 0.01, respectively).
Characteristics of Study Controls and Subjects
First, we evaluated the relationships between OEF and the PET parameters CBF, CVR, CMRO2, CBV, and MTT in 130 ROIs. The results are summarized in Figure 1. A significant correlation between CBF and OEF (OEF = 0.6095 – 0.0099 × CBF + 0.0001 × CBF2; P = 0.004) was demonstrated. Of 77 ROIs with decreased CBF, 17 (22.1%) had significantly elevated OEF (Fig. 1). A significant correlation between OEF and CVR (OEF = 0.4241 – 0.0015 × CVR + 0.00002 × CVR2; P = 0.01) was also shown. All of the 65 ROIs with normal CVR had normal OEF. Of 65 ROIs with reduced CVR, 17 (26.1%) had significantly elevated OEF (Fig. 1B). As shown in Figure 1C, there was no correlation between OEF and CBV (P = 0.18). Figure 1D shows a linear correlation between OEF and CMRO2 (OEF = 0.3523 + 0.0239 × CMRO2; P = 0.02). The OEF values were positively and nonlinearly correlated with the MTT values (OEF = 0.398 – 0.463 × MTT + 5.035 × MTT2; P < 0.001). Of 33 ROIs with delayed MTT, 15 (45.5%) had significantly elevated OEF (Fig. 1E). However, these correlations between OEF and other PET parameters were not so distinct.
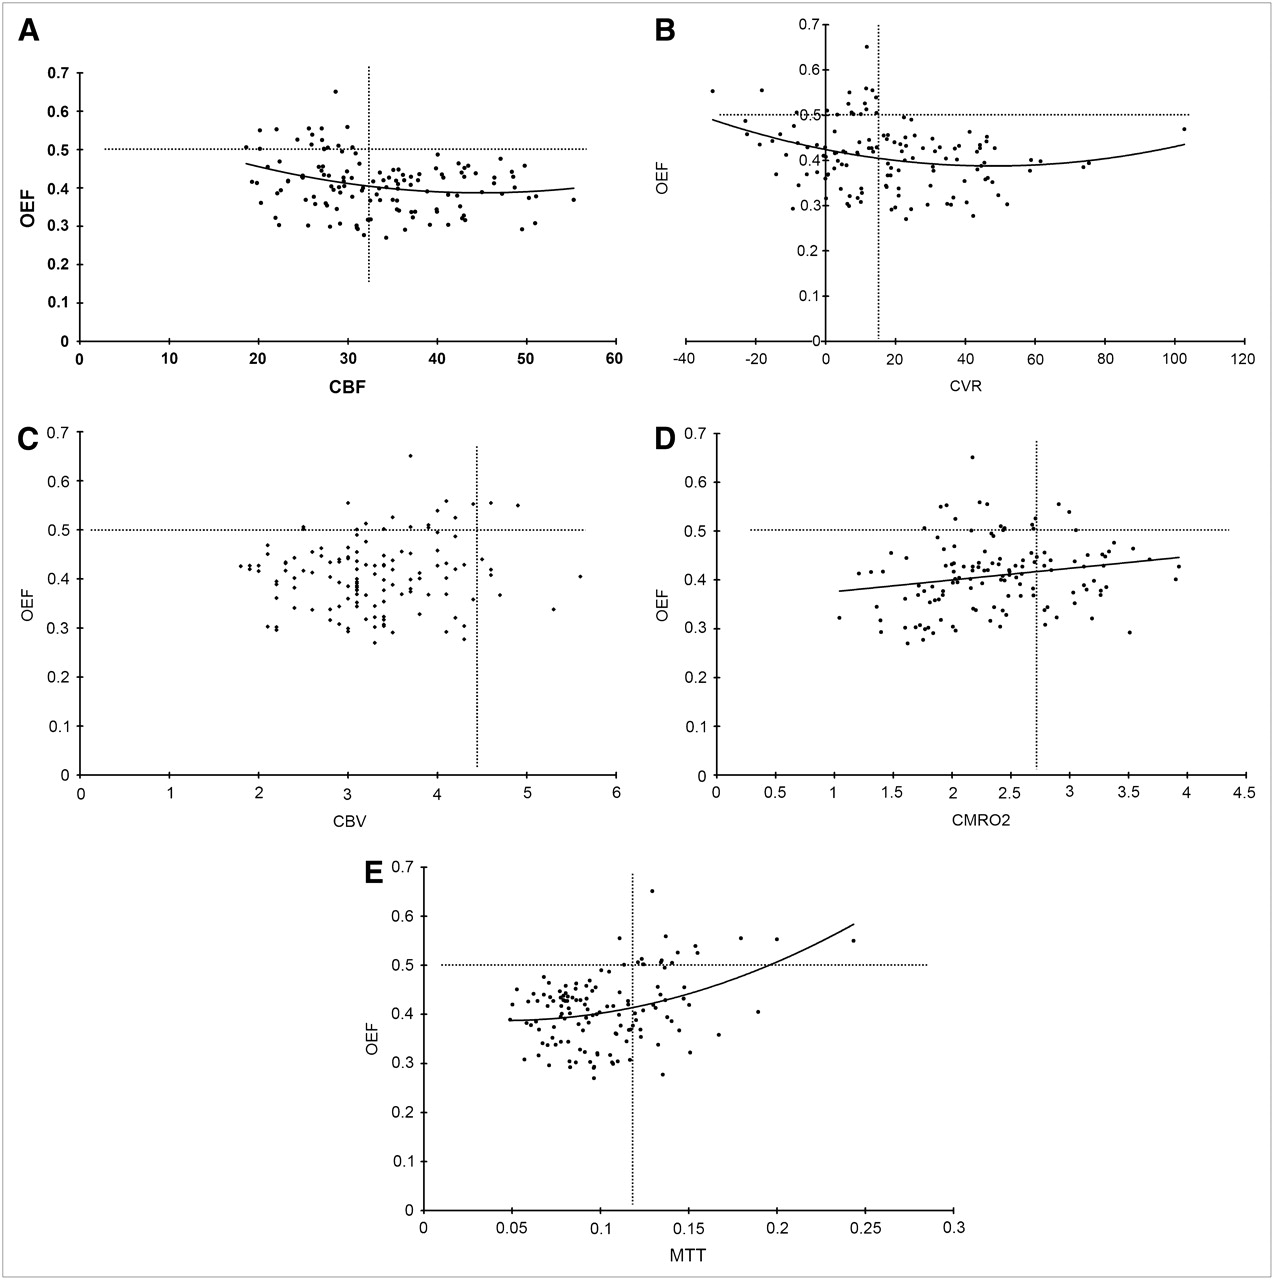
(A–E) Relationship between OEF and other PET parameters, including CBF, CVR, CMRO2, CBV, and MTT (CBV/CBF) in total of 130 ROIs of 65 patients with occlusive carotid artery diseases. Dotted lines of y-axis represent upper limit of control value of OEF. Dotted lines of x-axis represent lower limits of control values of CBF (A), CVR (B), and CMRO2 (D), respectively. Likewise, dotted lines of x-axis indicate upper limits of control values of CBV (C) and MTT (E), respectively.
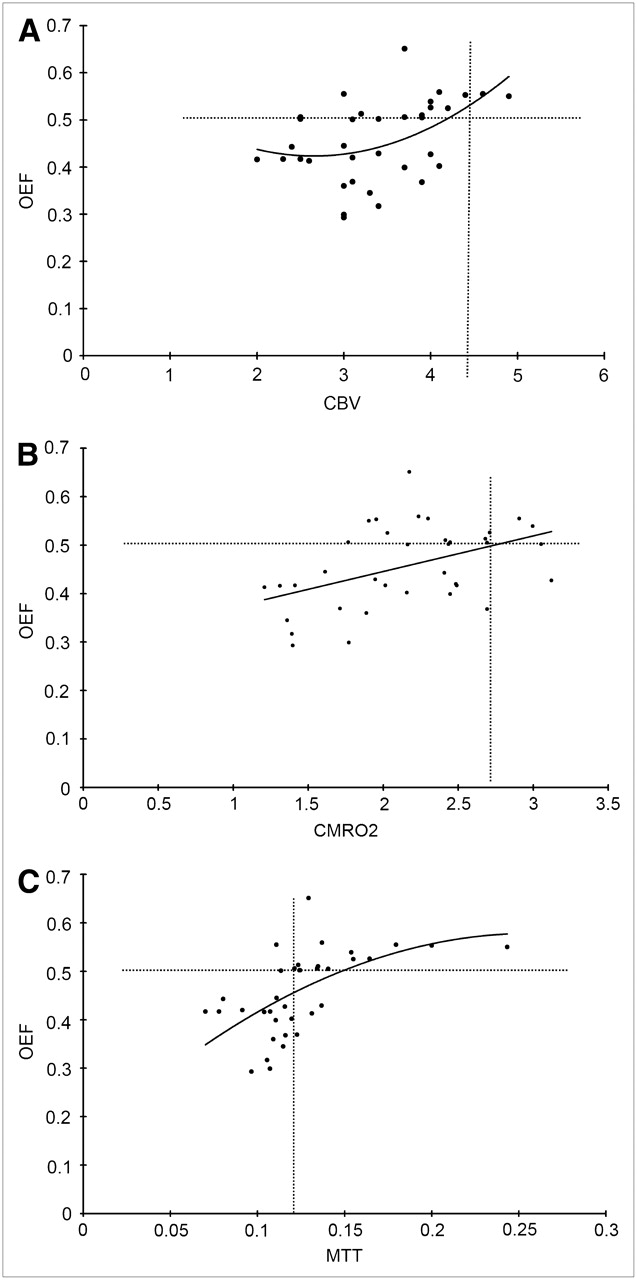
Next, we assessed the relationships between OEF and the PET parameters CMRO2, CBV, and MTT in 36 ROIs judged as having reduced CBF and CVR (type 3 ischemia) (6,8,11). As shown in Figure 2A, a significant correlation was observed between OEF and CBV (OEF = 0.6584 – 0.1772 × CBV + 0.0334 × CBV2; P = 0.01). A total of 3 ROIs with increased CBV had significantly elevated OEF. Figure 2B shows a linear correlation between OEF and CMRO2 (OEF = 0.2985 + 0.0735 × CMRO2; P = 0.004). Of the 4 ROIs with normal CMRO2, 3 (75.0%) had significantly elevated OEF. There was also a positive and nonlinear correlation between OEF and MTT (OEF = 0.1443 + 3.369 × MTT – 6.5398 × MTT2; P < 0.001). Of 18 ROIs with delayed MTT, 15 (83.3%) had significantly elevated OEF (Fig. 2C).

(A–C) Relationship between OEF and other PET parameters, including CMRO2, CBV, and MTT, in 36 ROIs judged as type 3 ischemia with occlusive carotid artery diseases. Dotted lines of y-axis represent upper limit of control value of OEF. Dotted lines of x-axis represent lower limits of control values of CMRO2 (B). Likewise, dotted lines of x-axis indicate upper limits of control values of CBV (A) and MTT (C), respectively.
Validities of hemodynamic parameters to identify elevated OEF were analyzed in each ROI. The results are summarized in Table 2. Of 64 ROIs judged as reduced CVR, only 17 ROIs (26.6%) had significantly elevated OEF, whereas 47 (73.4%) had normal OEF. Therefore, the sensitivity and specificity of reduced CVR for determining OEF elevation were 100% and 51.3%, respectively. The positive predictive value (PPV) and negative predictive value (NPV) of reduced CVR were 26.6% and 100%, respectively. Of 36 ROIs judged as having reduced CBF and CVR (type 3 ischemia), 17 ROIs (47.2%) had significantly elevated OEF, whereas 19 (52.8%) had normal OEF, which supports our previous results (8). Therefore, the sensitivity and specificity of type 3 ischemia for determining OEF elevation were 100% and 83.2%, respectively, and the PPV and NPV were 47.2% and 100%, respectively. Likewise, the sensitivity and specificity of increased CBV for determining OEF elevation were 17.6% and 92.9%, respectively, and the PPV and NPV were 27.3% and 88.2%, respectively. The sensitivity and specificity of normal CMRO2 for determining OEF elevation were 23.5% and 72.6%, respectively, and the PPV and NPV were 11.4% and 86.3%, respectively. Finally, the sensitivity and specificity of delayed MTT for determining OEF elevation was 88.2% and 84.1%, respectively. The PPV and NPV of delayed MTT were 45.5% and 97.9%, respectively.
Statistical Findings for Prediction of Elevated OEF
We then evaluated whether the predictive power of type 3 ischemia to identify significantly elevated OEF improved when combined with another PET parameter (Table 2). OEF was significantly elevated in 15 of 18 ROIs with type 3 ischemia and delayed MTT, but in only 2 of 112 other ROIs. Thus, the sensitivity and specificity of type 3 ischemia and delayed MTT for determining OEF elevation were 88.2% and 97.3%, respectively, and the PPV and NPV were 83.3% and 98.2%, respectively. Sensitivity markedly decreased when CMRO2 or CBV was combined with type 3 ischemia, although both PPVs improved. Furthermore, accuracy of type 3 ischemia was 0.85. The value noticeably improved to 0.96 when CMRO2 or CBV was combined with type 3 ischemia. Thus, type 3 ischemia and delayed MTT were considered as the most powerful predictors to identify elevated OEF with high sensitivity, specificity, PPV, NPV, and accuracy.
DISCUSSION
The present study revealed that type 3 ischemia could detect elevated OEF with 100% sensitivity, although the PPV of type 3 ischemia was rather low (47.2%). The results mirror recent descriptions that type 3 ischemia is not equal to misery perfusion or stage II ischemia (8). However, this study showed that the combination of MTT with type 3 ischemia improved both PPV and accuracy to predict elevated OEF in patients with occlusive carotid artery diseases. Thus, the quantification of MTT may improve the predictive power of an acetazolamide test to detect elevated OEF by detecting the areas with type 3 ischemia and delayed MTT. The results suggest that an elevated OEF may be defined more specifically if MTT is simultaneously measured with CBF and CVR.
Many earlier studies have evaluated the relationships between OEF and CVR (8,9,13,14). Most of these studies have concluded that there is a significant correlation between OEF and CVR to acetazolamide (13,14). However, in these studies, the number of patients included was low. On the other hand, recent studies analyzing a larger number of patients have proved that the decrease in CVR and increased OEF did not necessarily parallel each other (8,9). Nemoto et al. (9) reported that about 40% of patients with reduced CVR had normal OEF (9). Subsequently, Kuroda et al. (8) have also revealed that OEF was significantly elevated in about 40% of type 3 patients.
Previous studies have analyzed the relationship between OEF and MTT. Gibbs et al. (15) reported that the CBF/CBV value, a reciprocal of MTT, showed a linear, negative correlation with OEF in patients with ICA occlusion. Recently, Yata et al. (16) also concluded that OEF starts to elevate when the CBV/CBF value became more than 0.11 min in patients with occlusive carotid artery diseases. Furthermore, a significant correlation between CBV/CBF and CVR has been pointed out analogously (17). The results of the study by Kuroda et al. (17) are also supported by recent reports. Okazawa et al. (18) suggested that the measurement of arterial-to-capillary blood volume coupled with the acetazolamide test may predict impaired hemodynamics precisely. Kuroda et al. (8) also measured 15O-gas PET parameters in 46 patients who were judged as having type 3 ischemia on SPECT. Of 20 patients with elevated OEF, 9 (45%) had increased CBV. Of another 26 patients with normal OEF, only 4 (15.4%) had increased CBV, showing that increased CBV was more frequently denoted in patients with elevated OEF than in those with normal OEF (8). Furthermore, recent study has also indicated that an increased CBV may be a supplementary parameter to predict subsequent ischemic stroke in patients with occlusive carotid artery diseases. Derdeyn et al. (19) measured CBV in 45 patients with elevated OEF due to ICA occlusion and found that CBV was increased in 19 patients but was normal or reduced in the remaining 26. Subsequent ischemic stroke more frequently occurred in patients with elevated OEF and increased CBV than in those with elevated OEF but normal or reduced CBV (19). On the other hand, our study revealed that the predictive power of the acetazolamide test to define elevated OEF could be improved by detecting delayed MTT but not increased CBV itself (Table 2).
In addition, animal experiments have demonstrated comparable findings. Schumann et al. (20) manipulated mean arterial pressure (MAP) of anesthetized baboons and measured their CBF, CBV, CMRO2, and OEF by using 15O-gas PET. The authors clearly showed that the value of CBF/CBV demonstrated a significant correlation with MAP, although CBV varied widely and did not show significant changes in response to MAP changes (20). Although the results of the study by Schumann et al. are based on hemodynamic response to acute MAP change, the results strongly suggest that CBF/CBV can represent local CPP more accurately than CBV alone, which is consistent with the results of the current study (Table 2).
Like PET, SPECT can determine the MTT value, because CBV can be quantified by using 99mTc-red blood cell (RBC) or 99mTc-human serum albumin (17,21). Kuroda et al. reported that the measurement of CBV with 99mTc-RBC SPECT was useful for detecting hemodynamic compromise in patients with occlusive cerebrovascular disease (17). Therefore, the present results strongly suggest that SPECT may be able to identify the patients with elevated OEF as accurately as can PET by quantitatively measuring CBF, CVR, CBV, and MTT. However, there exist considerable differences in radioactive tracers used, spatial resolution, sensitivity, and methods of quantification between SPECT and PET. Because all of the data obtained in this study were measured by using PET, it would be necessary to confirm the compatibility by using SPECT as well.
CONCLUSION
This study indicates that type 3 ischemia and delayed MTT are powerful predictors in identifying elevated OEF with high sensitivity and specificity, PPV, NPV, likelihood ratio for positive results, and accuracy. The findings may contribute to identifying patients at higher risk for subsequent hemodynamic stroke, at a lower cost than with PET. Furthermore, SPECT may be able to define patients with elevated OEF more easily and at a lower cost than PET. However, further study would be necessary to compare the results obtained by using SPECT with those by using PET.
Footnotes
-
COPYRIGHT © 2008 by the Society of Nuclear Medicine, Inc.
References
- Received for publication May 15, 2008.
- Accepted for publication August 19, 2008.


Jump to section
Related Articles
Cited By...
- Predictors and Clinical Features of Postoperative Hyperperfusion after Surgical Revascularization for Moyamoya Disease: A Serial Single Photon Emission CT/Positron Emission Tomography Study
- Detecting Misery Perfusion in Unilateral Steno-Occlusive Disease of the Internal Carotid Artery or Middle Cerebral Artery by MR Imaging