


Abstract
The rate of incorporation of exogenous amino acids into brain proteins is indicative of the protein synthesis rate (PSR). The objective of this study was to assess the effect of plasma concentrations of leucine and large neutral amino acids (LNAAs) on the unidirectional uptake rate constant (Kcplx) of l-[1-11C]-leucine in the brain and to estimate the amino acid pool recycled from tissue. Methods: Twenty-seven healthy adult volunteers (11 men and 16 women; age range, 20–50 y) underwent dynamic l-[1-11C]-leucine PET with arterial blood sampling. Data were analyzed with a standard 2-tissue-compartment model yielding the unidirectional uptake rate of plasma leucine into tissue (Kcplx = K1k3/(k2 + k3)) and the fraction of leucine originating from exogenous sources (λ = k2/(k2 + k3)). PSR in brain was calculated as PSR = [Kcplx/λ] × leucine. Results: The mean plasma concentration of the sum of all LNAAs was 13% higher in men (981 ± 86 μmol/L) than in women (850 ± 76 μmol/L, P = 0.012), whereas the plasma leucine concentration was found to be similar in both sexes (men, 64 ± 20 μmol/L; women, 58 ± 21 μmol/L, P = 0.57). The whole-brain value for λ was determined to be 0.64 ± 0.03 and did not show a sex difference (P = 0.66). Whole-brain Kcplx values were significantly higher in women (0.0162 ± 0.0024) than in men (0.0121 ± 0.0031, P = 0.011); however, after normalization of the Kcplx to a standard plasma concentration of the sum of all LNAAs (Kcplx′), the Kcplx′ was similar between the sexes (P = 0.21), as was the PSR′ (1.24 ± 0.49 μmol/L/min in men; 1.29 ± 0.62 μmol/L/min in women, P = 0.87). No relationship between plasma leucine and Kcplx (r = −0.13, P = 0.63) was observed. Finally, there was a significant correlation between the PSR and the Kcplx derived using Patlak graphical analysis (ρ = 0.65, P < 0.001). Conclusion: We conclude that both the Kcplx macroparameter and the PSR are stable indices of brain protein synthesis and are appropriate measures for testing altered protein synthesis in neurologic disorders.
- positron emission tomography
- 11C leucine
- brain protein synthesis
- large neutral amino acids
- compartmental modeling
PET methods suitable for identifying abnormalities in brain protein synthesis were developed more than 2 decades ago (1–3), but application of these methods was hindered by radiochemistry difficulties in the synthesis of l-[1-11C]-leucine (3) and by the lack of a reliable method to estimate the fraction of the amino acid precursor pool for protein synthesis derived from tissue proteolysis (3,4). Recent developments in the field have overcome the difficulties associated with chemical synthesis of l-[1-11C]-leucine (5), and a method for quantifying the endogenous brain amino acid precursor pool has been described and validated (6,7).
The tracer l-[1-11C]-leucine satisfies most of the criteria required for the estimation of protein synthesis rate (PSR) in vivo (2,8). The tracer shows sufficient transport at the blood–brain barrier, and in addition to protein incorporation, there is only a single pathway for its metabolism by which the metabolic products are quickly removed from the brain. Moreover, l-[1-14C]-leucine has been used in animal autoradiographic experiments in studies of protein synthesis, and this tracer has been shown to provide reliable estimates of regional cerebral protein synthesis (4,9,10).
On the basis of their previous work with autoradiography, Schmidt et al. (6) proposed a noninvasive compartmental-model approach to estimate the fraction of leucine derived from plasma and incorporated into proteins (λ). Smith et al. (7) subsequently showed the feasibility of this method in PET studies of rhesus monkeys.
The objective of the current study was to estimate the fraction of leucine originating from exogenous sources (λ) in humans using the 2-tissue-compartment model introduced by Schmidt et al. (6) and to assess the effect of plasma leucine and total large neutral amino acid (LNAA) concentrations on estimates of brain protein synthesis. In addition, we have assessed the accuracy of the Patlak graphical analysis method in estimating the unidirectional uptake rate constant (Kcplx) of leucine. Implementation of this method would allow the use of a blood time–activity curve obtained from a left ventricular region of interest (ROI) instead of arterial blood sampling and would yield a noninvasively obtained index of exogenous protein synthesis.
MATERIALS AND METHODS
Subjects
Twenty-seven healthy adult volunteers (11 men and 16 women; median age, 28 y; range, 20–50 y) were studied using l-[1-11C]-leucine PET at Children's Hospital of Michigan. Men (31 ± 11 y) and women (29 ± 7 y) did not significantly differ in age (P = 0.65). The studies were performed in compliance with the regulations of the Wayne State University Human Investigation Committee under investigational new drug application 71424, and written informed consent was obtained before all studies.
PET
The tracer l-[1-11C]-leucine was produced at Children's Hospital of Michigan using a synthesis module designed and built in-house (5). The module traps 11C-cyanide synthesized from the cyclotron-produced 11C-carbon dioxide and allows the synthesis to be done remotely inside a lead-lined hot cell. PET studies were performed using a CTI/Siemens EXACT/HR whole-body positron tomograph. To standardize LNAA levels during the study, we required all subjects to fast for 8 h before undergoing PET. To increase the uptake of LNAAs into tissue and thus increase the PET signal, we loaded the patients with 0.7 g of oral glucose per kilogram of body weight (50 g of glucose maximum) 30 min before the study (11–13). Before tracer injection, a 15-min transmission scan was acquired to correct for photon attenuation. A venous catheter was established for injection of the tracer, l-[1-11C]-leucine (13 MBq/kg), and a radial arterial catheter was established for collection of timed blood samples. To allow sufficient temporal sampling of arterial blood, we administered the tracer as a slow bolus over 60 s using a Harvard pump. Coinciding with bolus tracer injection, a 60-min dynamic scan (4 × 30 s, 3 × 60 s, 2 × 150 s, 2 × 300 s, 4 × 600 s) in 3-dimensional mode was initiated. Using the combination of a slow bolus, fast temporal arterial blood sampling, and low-noise image data derived from the initial 30-s time frames, we could reliably estimate the cerebral blood volume parameter (0.038 ± 0.004). Measured attenuation, scatter, and decay correction was applied to all PET images using the CTI/Siemens reconstruction software. After injection of the l-[1-11C]-leucine, timed blood samples (2 mL) were drawn from the arterial catheter at approximately 10-s intervals during the first 2 min and then at progressively longer intervals (12 × 10 s, 3 × 60 s, 3 × 300 s, 4 × 600 s). Subsequently, plasma was extracted from total blood by centrifugation, and the amount of 11C was determined using a NaI well counter (Packard Instruments). Protein was precipitated in separate aliquots of plasma using 5% perchloric acid, and both the supernatants and the pellets were counted in the NaI well counter. Subsequently, the aliquots of both the supernatant and the precipitate were counted in the NaI well counter to obtain the corresponding tracer concentration in each phase. Figure 1A shows a representative plot of the time course of l-[1-11C]-leucine in plasma as well as the accumulation of 11C-labeled protein. In addition, Fig. 1B shows the fraction of unmetabolized l-[1-11C]-leucine in plasma relative to the total 11C activity as a function of time. The points were fitted with a 3-parameter sigmoidal function. The input function was corrected for metabolites using either the individual or a population-derived metabolite correction. Finally, the plasma amino acid concentrations of 9 LNAAs (leucine, threonine, glutamine, tyrosine, histidine, valine, phenylalanine, methionine, and isoleucine) were determined by ion exchange chromatography on high-performance liquid chromatography using Ninhydrin postcolumn detection (14) (Baylor College of Medicine Core Laboratory) in a subset of subjects (6 men and 10 women).

(A) Time course of 11C concentration associated with total plasma, unmetabolized l-[1-11C]-leucine, and l-[1-11C]-leucine in plasma protein. (B) Fraction of unmetabolized free l-[1-11C]-leucine relative to total 11C concentration in plasma fitted with a 3-parameter (offset, α, β) sigmoidal function. Parameter values that best fit data are reported. Fitted curve explains more than 90% of variance in data.
Effect of LNAA Levels on Kinetic Parameters
One consequence of the high affinity of the cerebrovascular LNAA transport system is that the l-type amino acid transporter is nearly saturated with LNAAs at normal plasma concentrations. The percentage of saturation was previously estimated at around 96% (15). To correct for this effect, Smith et al. (15) measured the KM for the LNAAs in rats and derived a formula for the apparent KM (KM(app)), that is, a KM value for a given amino acid in the presence of other amino acids competing for the l-type amino acid transporter. Values for KM(app) for leucine can be calculated as Eq. 1where KM is the undisturbed affinity for leucine and Ci and KMi represent the concentrations and affinities of all the other LNAAs in plasma. Moreover, consistent with Michaelis–Menten kinetics, it was shown that the transport rate constant K1 for leucine is inversely related to the sum of all LNAAs in plasma and largely independent of the plasma leucine concentration (16–18). In addition, Stout et al. (18) presented data showing that the unidirectional inflow parameter K1 correlates with the total sum of all LNAAs but does not correlate with the KM(app) weighted sum of all LNAAs. Our data confirmed these earlier results showing similar KM(app) values for leucine in both men and women despite significantly different total LNAA plasma levels. To account for the effect of varying total LNAA plasma levels on the K1 transport parameter, we normalized the Kcplx to a standard total LNAA level of 1,000 μmol/L. The value of 1,000 μmol/L approximates the mean normal LNAA plasma concentration (mean for subjects in this study, 918 ± 80 μmol/L). The normalized Kcplx is then defined as
 Eq. 2and represents the Kcplx for leucine normalized to a standard total LNAA plasma concentration.
Kinetic Model
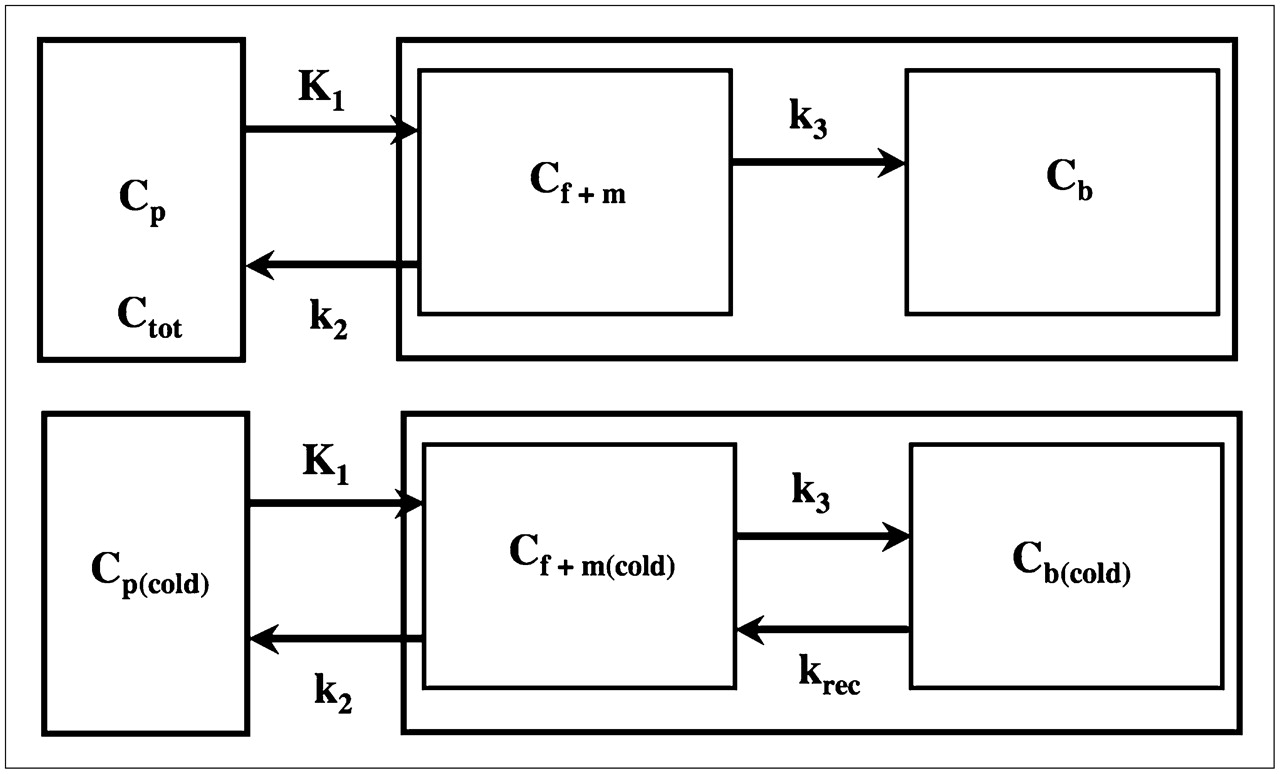
As shown previously (6), a 2-tissue-compartment model (Fig. 2, top) characterized by the rate constants K1, k2, and k3 adequately describes the obtained PET time–activity curves. Moreover, identifiability analysis of the parameter vector showed that the rate constants are well defined and result in a computationally stable estimate of the Kcplx macroparameter (K1k3/(k2 + k3)), which represents the Kcplx for leucine. The incorporation of leucine into tissue can subsequently be calculated by multiplying the Kcplx (or Kcplx′) by plasma leucine levels; however, this expression considers the contribution of exogenous plasma leucine only and does not account for the contribution of leucine originating from endogenous tissue sources. To estimate the fraction of leucine in the precursor pool that is derived from arterial plasma (λ), Smith et al. (4) proposed the following equation: Eq. 3where Cf(cold) and Cp(cold) are the concentrations of unlabeled (cold) leucine in the free precursor pool and in plasma, respectively, and Cf and Cp are the corresponding concentrations of labeled leucine. For the unlabeled leucine, a 2-tissue-compartment model can be defined (Fig. 2, bottom) with krec representing the rate of leucine recycled from the protein pool. Because unlabeled leucine in tissue is in a state of dynamic equilibrium (dCf(cold)/dt = dCp(cold)/dt = 0), the following relationship can be derived:
 Eq. 4Because Cf is equal to [K1/(k2 + k3)]Cp for labeled leucine, Equation 3 yields an estimate of the fraction of leucine in the precursor pool derived from exogenous sources, termed λ (7):
 Eq. 5Finally, under normal physiologic conditions, the total incorporation of leucine into brain tissue equals the PSR, which can be calculated as
 Eq. 6If the Kcplx′ is used in Equation 6, we obtain the PSR normalized to a standard total sum of all LNAAs (PSR′). Although Kcplx can be derived either from compartmental modeling or noninvasively using a left ventricular input function together with the Patlak graphical analysis, λ and thus PSR can be determined only by using compartmental modeling of the entire tissue time–activity curve.

(Top) Simplified 2-tissue-compartment model for labeled leucine, with k2 representing effective loss of 11C tracer from tissue and k3 representing effective incorporation of l-[1-11C]-leucine into protein. Tracer concentration in combined free and metabolic compartment is denoted as Cf+m, and tracer concentration in protein pool is denoted as Cb. (Bottom) Simplified 2-tissue-compartment model for unlabeled leucine, with krec representing recycled leucine as product of brain protein breakdown. Models describing l-[1-11C]-leucine and unlabeled leucine differ only with respect to krec, which is zero for l-[1-11C]-leucine.
Data Processing and Analysis
Parameter Estimation.
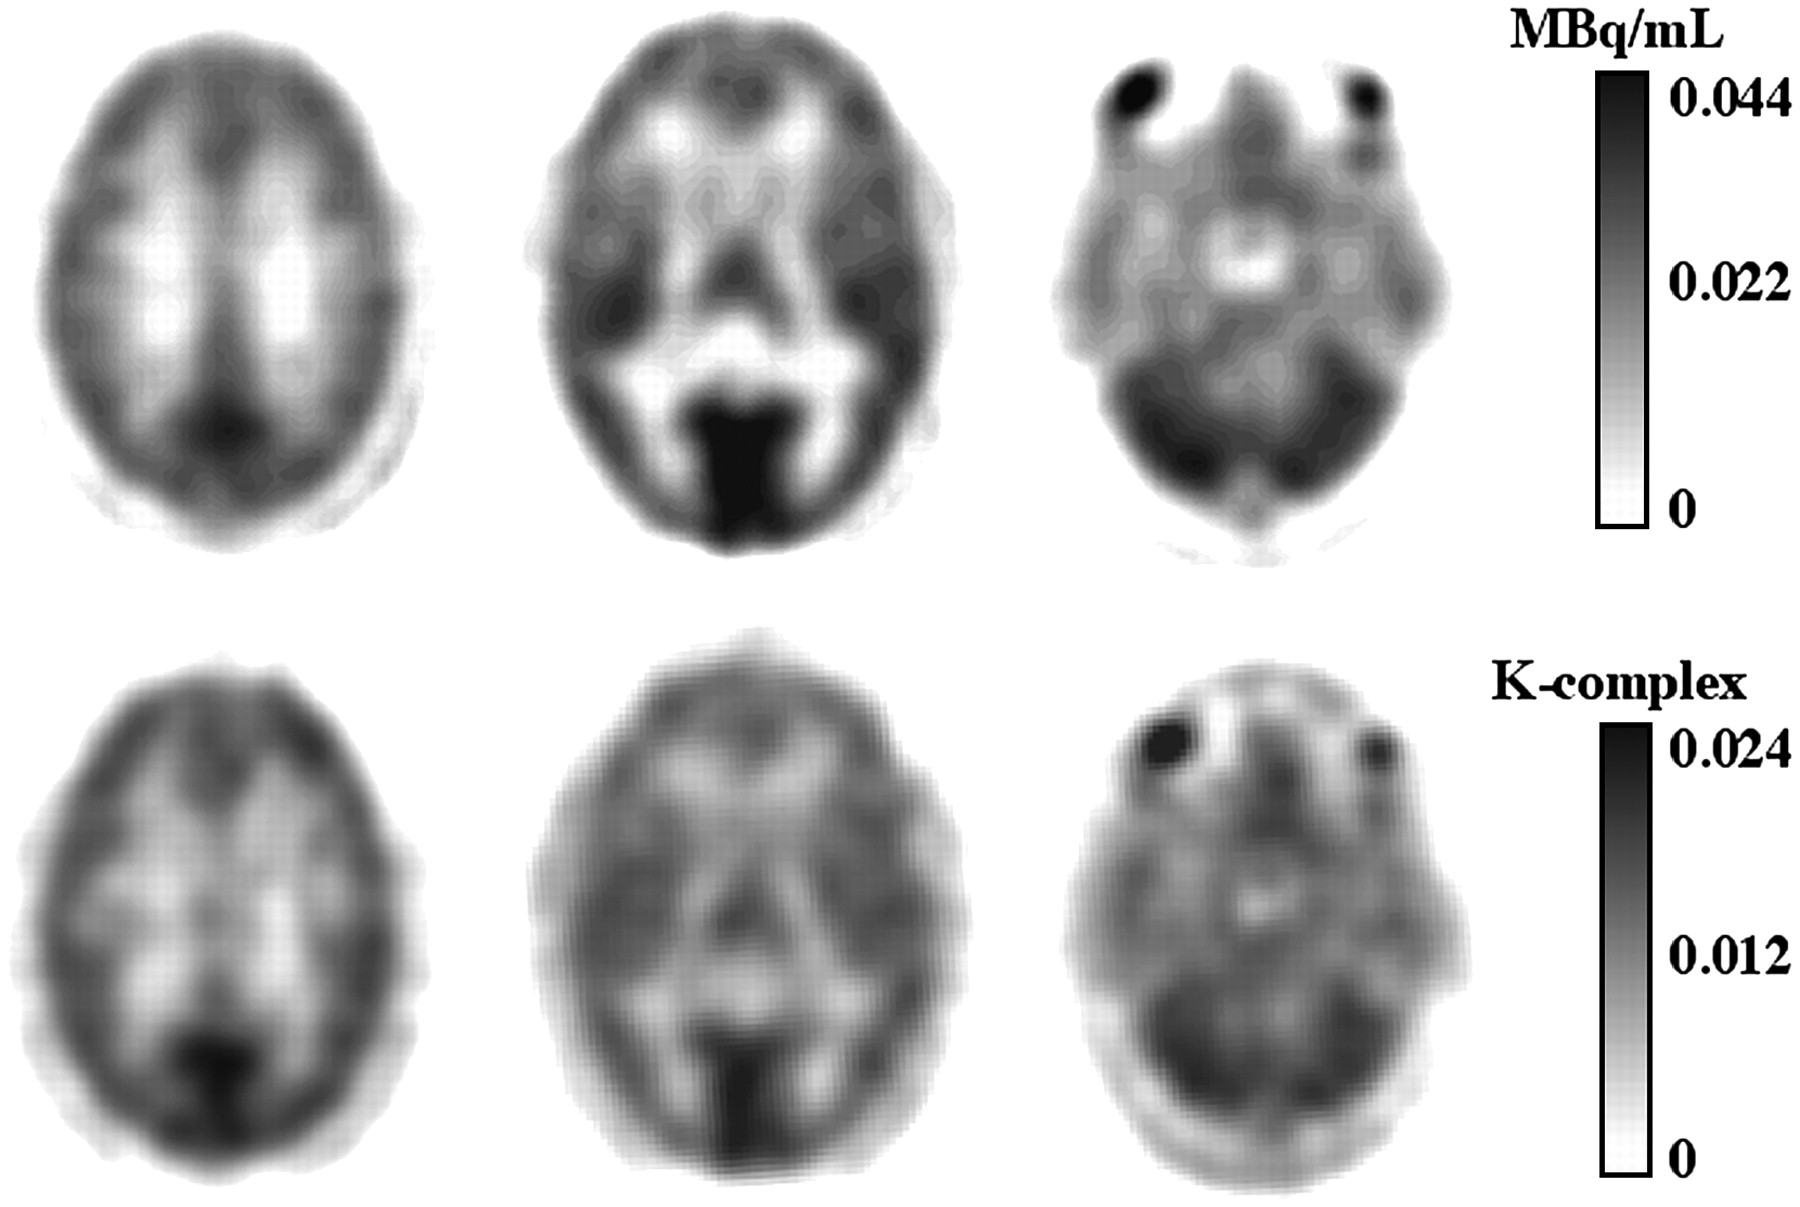
Initially, summed images (using frames between 20 and 60 min after injection) (Fig. 3, top) were used to define the following 7 anatomic brain regions: whole brain, frontal cortex, visual cortex, thalamus, cerebellum, brain stem, and white matter at the level of the centrum semiovale. ROIs were defined in all planes in which a particular structure could be identified and were copied to the dynamic image sequence, yielding a time–activity curve for each region. The time–activity curves were then fitted according to a 2-tissue-compartment model yielding estimates of the rate constants K1, k2, and k3 and of the cerebral blood volume parameter (CBV), which takes into account the contribution of activity in the vascular compartment to the overall tissue signal. Parameters were estimated using a standard Marquardt–Levenberg least-squares algorithm. For analysis of parameter identifiability, the structure of the sensitivity matrix X, Eq. 7at the solution (i.e., for minimum sum of squares = min ∑i (yi − fi (pj))2) was used (i = 1,…, N, number of points; j = 1,…, M, number of parameters). A singular value decomposition of X was computed yielding the SD of individual parameter estimates and the condition number of the model. The condition number was previously shown to characterize the identifiability of each estimated parameter in a given model configuration (19). It was determined empirically that good identifiability is associated with condition numbers of around 10 whereas ill-conditioned models are characterized by condition numbers of more than 30 (19). Our identifiability analysis yielded a condition number of 12.7 ± 1.3, which indicates good identifiability of the parameter vector derived from the 2-tissue-compartment model.
Patlak Graphical Analysis.
In addition to the estimation of individual parameters, parametric images representing the Kcplx macroparameter (K = K1k3/(k2 + k3)) were created using the Patlak graphical analysis (Fig. 3, bottom) (20,21). The linear fit included all points later than 30 min after tracer injection.

(Top) Averaged images representing Kcplx macroparameter from 20 to 60 after injection at 3 levels through brain. (Bottom) Corresponding parametric images obtained from representative subject. Kcplx values derived from parametric images agreed within 3% with those derived from compartmental analysis of time–activity curves.
Statistical Assessment.
Initially, plasma leucine, the leucine fraction in plasma, and the total LNAA plasma concentrations were compared between men and women using the unpaired t test. Regional λ-values were compared between men and women using a mixed-design ANOVA, with brain regions as the within-subject factor and sex as the between-subjects factor. To determine whether the obtained indices of brain protein synthesis differ between men and women, we repeated the mixed-design ANOVA independently for the PSR and PSR′ macroparameters. Moreover, Kcplx values determined using the Patlak graphical analysis were correlated with the PSR macroparameter. Finally, to determine the effect of a population-derived metabolite correction, we used a 1-sample t test to compare the absolute difference between Kcplx values derived using the individual and the average metabolite corrections.
RESULTS
Sex Differences in LNAA Plasma Levels
The mean plasma concentration of the sum of all LNAAs was 13% higher in men (981 ± 86 μmol/L) than in women (850 ± 76 μmol/L, P = 0.012) (Fig. 4A); whereas the plasma leucine concentration was similar in both sexes (men, 64 ± 20 μmol/L; women, 58 ± 21 μmol/L, P = 0.57). Moreover, we found a similar fraction of leucine with respect to total LNAA levels in both sexes (6.5% ± 1.7% in men vs. 6.8% ± 2.5% in women, P = 0.80). After we took into account the concentration of all other LNAAs, the KM(app) for leucine was similar in both men (0.243 ± 0.031 μmol/mL) and women (0.229 ± 0.031 μmol/mL, P = 0.40). Finally, we determined a significant sex difference in the unidirectional inflow rate constant K1 (0.034 ± 0.006 in men vs. 0.045 ± 0.008 in women, P = 0.010), in the outflow rate constant k2 (0.112 ± 0.015 in men vs. 0.094 ± 0.005 in women, P = 0.005), and in the metabolic rate constant k3 (0.060 ± 0.007 in men vs. 0.051 ± 0.007 in women, P = 0.042). The sex differences in kinetic parameters may be in compensation for the sex differences in total LNAA concentration, because the LNAA transporter is saturated under normal physiologic conditions (15).
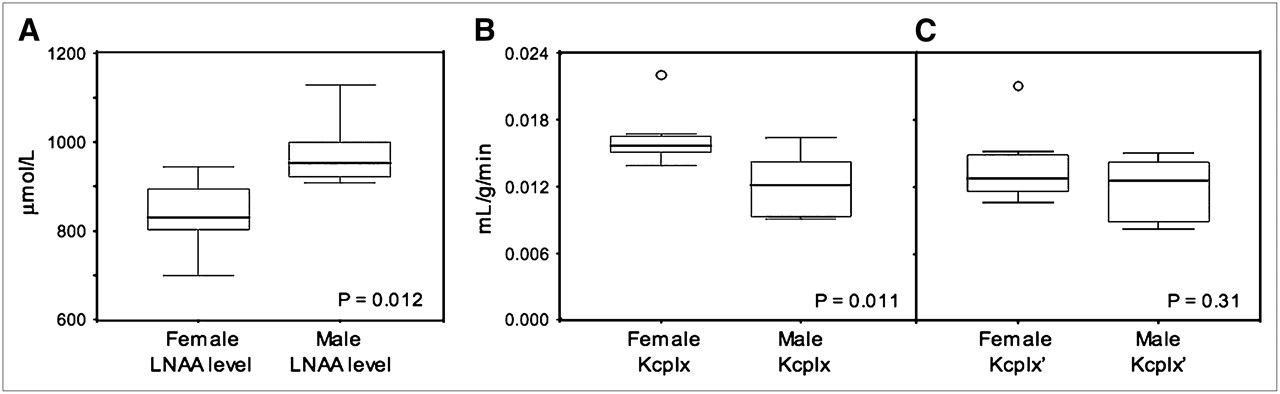
Box plot showing inverse relationship between plasma concentration of sum of all LNAAs (A) and Kcplx macroparameter (B). Box itself contains middle 50% of data, with line in box indicating median value. Ends of vertical lines, representing maximum and minimum data values, and points outside this range are considered outliers. The significantly lower total LNAA levels found in women (P = 0.012) appear related to significantly higher estimates of Kcplx macroparameter in women than in men (P = 0.011). (C) Kcplx macroparameter value for men and women after normalization to standard total plasma LNAA concentration of 1,000 μmol/L.
Sex Differences in Kcplx
Whole-brain values of the Kcplx macroparameter were found to be significantly higher in women (0.0162 ± 0.0024) than in men (0.0121 ± 0.0031, P = 0.011) (Fig. 4B). However, after normalization to a standard total LNAA level, whole-brain Kcplx′ values were similar in men (0.0119 ± 0.0028) and women (0.0138 ± 0.0030, P = 0.21) (Table 1). Furthermore, regional analysis of Kcplx′ values showed the rank order to be similar in men and women (P = 0.21 for the ROI × sex interaction, P = 0.16 for the sex main effect). Finally, we determined a statistical trend in the correlation between the Kcplx parameter and total LNAA plasma levels (ρ = −0.44, P = 0.09 [Fig. 5]), whereas there was no correlation between the Kcplx parameter and plasma leucine levels (ρ = −0.13, P = 0.63) or between the Kcplx′ parameter and plasma leucine levels (ρ = 0.11, P = 0.69).
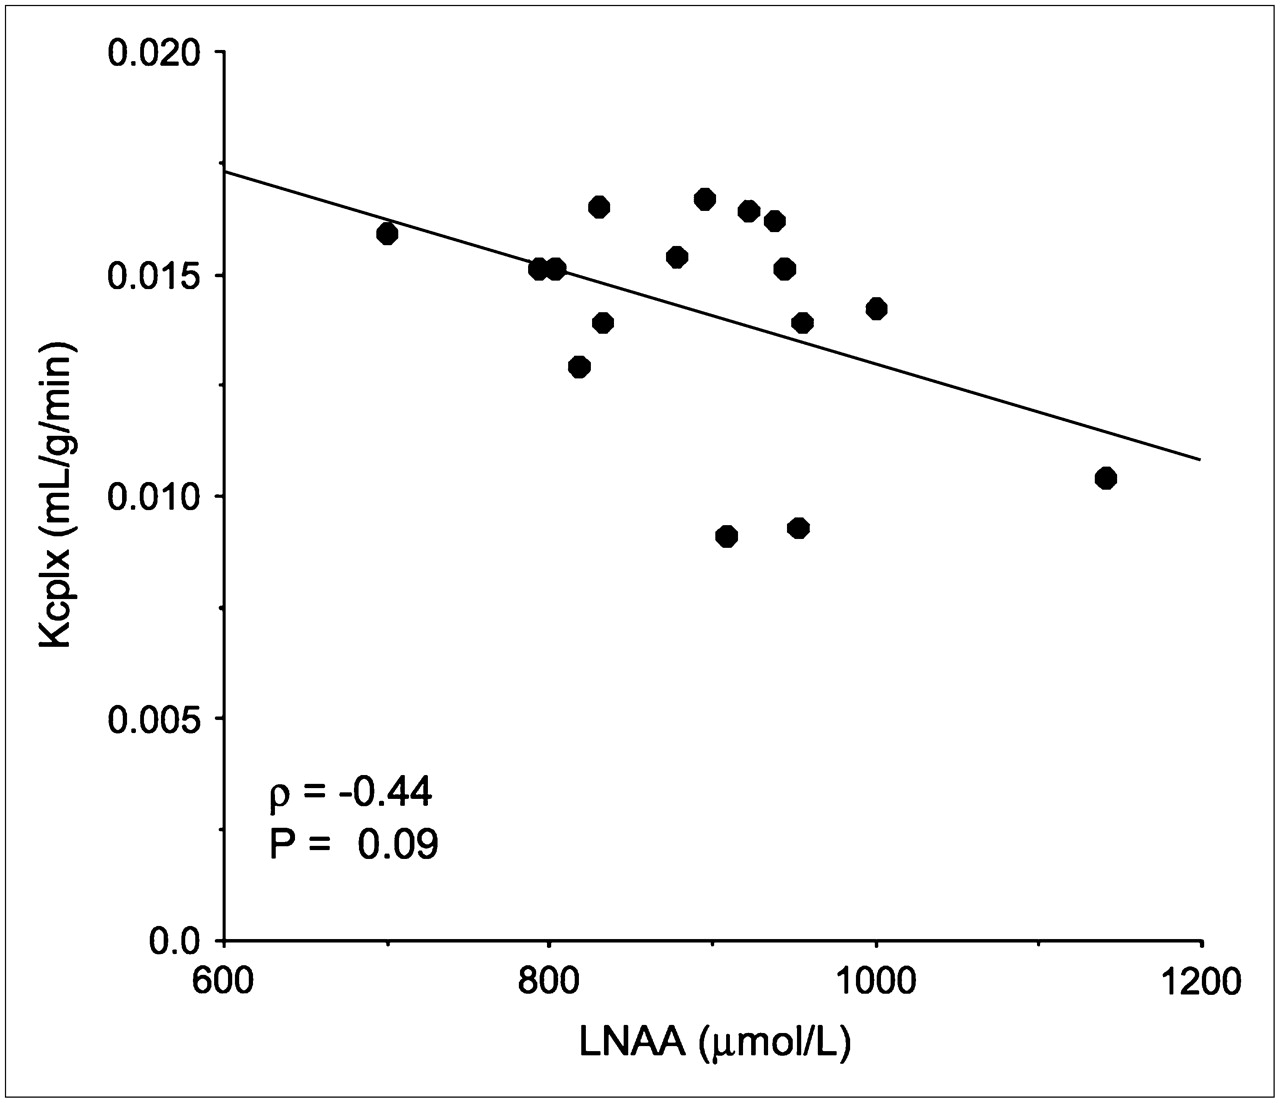
Inverse relationship between estimated Kcplx macroparameter (mL/g/min) and measured plasma total LNAA concentration (μmol/L). Correlation analysis suggests statistical trend between these 2 variables.
Regional Values of Kcplx (Normalized to Standard Plasma Total LNAA Concentration)
Fraction of Brain Leucine Originating from Exogenous Sources
Values of λ were confined to a relatively narrow range between 0.6 and 0.7, with a mean value for whole brain of 0.64 ± 0.03. Despite the small range, we found a significant regional difference between λ-values (P < 0.001), with the highest λ being found in the cerebellum (0.68 ± 0.03), followed by the white matter, thalamus, visual cortex, frontal cortex, and brain stem (0.62 ± 0.03) (Table 2). The regional pattern of λ was not significantly different between men and women (P = 0.46 for the ROI × sex interaction, P = 0.66 for the sex main effect), with an absolute mean difference between regional λ-values of 3.1% ± 2.0%. Moreover, no correlation was found between regional Kcplx and λ-values (ρ = 0.38, P = 0.13), indicating that λ is independent of the Kcplx of leucine. In addition, there was no statistically significant relationship between age and whole-brain λ-values (age range, 20–54 y, ρ = 0.09, P = 0.64).
Fraction of Brain Leucine Originating from Exogenous Sources
PSR
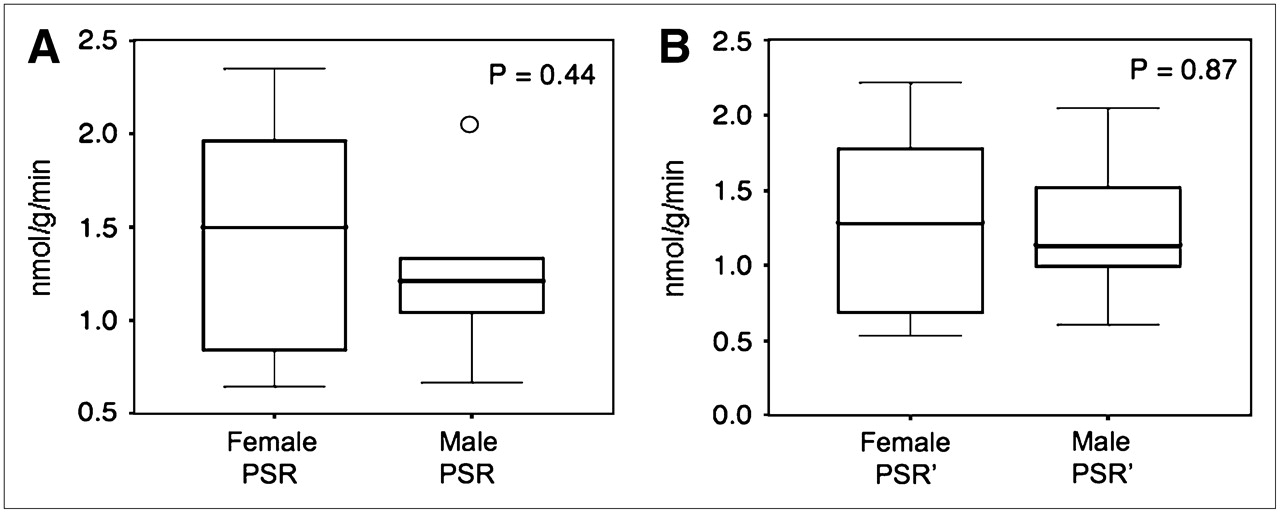
No significant sex difference was found for the whole-brain PSR (1.25 ± 0.44 nmol/g/min in men vs. 1.48 ± 0.62 nmol/g/min in women, P = 0.44) (Fig. 6A) or for the PSR′ (1.24 ± 0.49 nmol/g/min in men vs. 1.29 ± 0.62 nmol/g/min in women, P = 0.87) (Fig. 6B). Regional PSR values showed no significant differences between men and women, with a similar rank order (P = 0.63 for the ROI × sex interaction, P = 0.86 for the group main effect) (Table 3).

Box-plot comparison of whole-brain PSR values obtained for men and women. Middle 50% of data lie within box, with ends of vertical lines representing maximum and minimum data values. Points outside minimum and maximum values are considered outliers. (A) PSR values calculated on basis of leucine kinetics without correction for plasma total sum of LNAAs. (B) PSR values after normalization of plasma total sum of LNAAs to standard value of 1,000 μmol/L (PSR′). Although neither measure of PSR is significantly different between the sexes, correction for plasma total sum of all LNAAs results in smaller difference between mean male and female PSRs, indicating a small effect of total plasma LNAA levels on PSR measure.
Regional PSR, PSR Normalized to PSR′, Kcplx and Kcplx′ Derived from Compartmental Model, and Kcplx Derived Using Patlak Graphical Method
Patlak Graphical Analysis
The half-life of the free precursor pool (ln2/(k2 + k3)) was determined to be 4.7 ± 0.9 min using the compartmental model. It is commonly assumed that after 5 half-lives of the free precursor pool, dynamic equilibrium is reached. Accordingly, we applied the Patlak graphical analysis to data acquired 30 min after tracer injection. Figure 7A shows the results of the Patlak graphical analysis for various anatomic ROIs and indicates that data at times later than 30 min can be well approximated with a linear function. As can be seen in this figure and Table 3, the rank order of regional K-complex values is preserved with respect to the compartmental model. Moreover, there was a significant correlation between the PSR and the K complex derived using the Patlak graphical analysis (ρ = 0.65, P < 0.001, Fig. 7B).
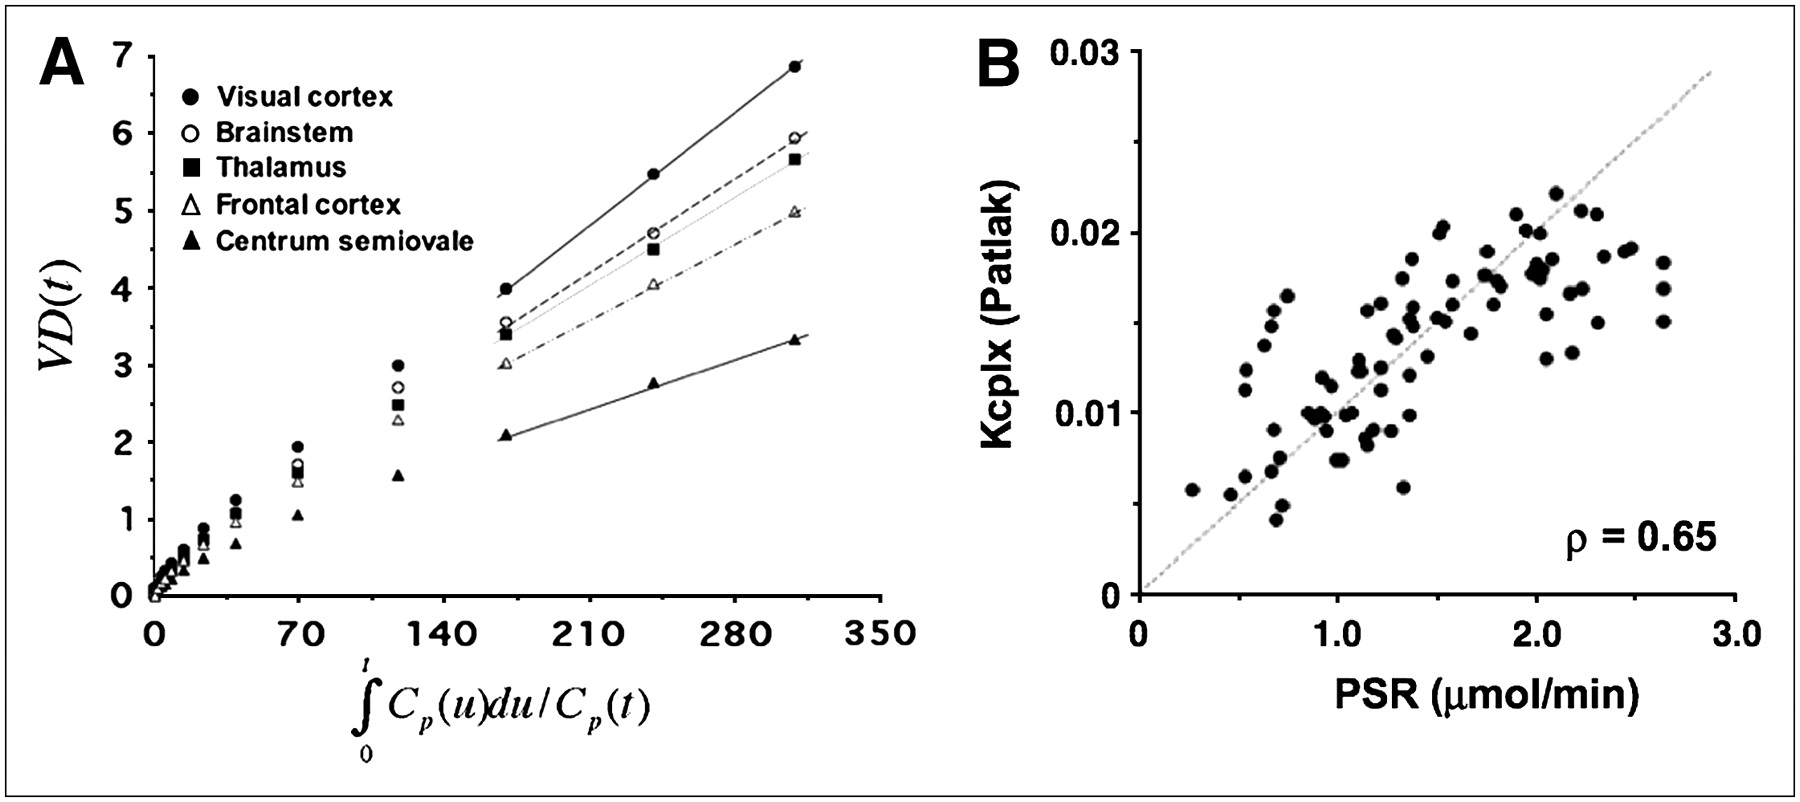
(A) Patlak plot obtained from representative subject showing linear behavior of transformed curves at times later than 30 min after injection. Slope of fitted lines represents Kcplx estimates, which closely correspond to Kcplx values derived using compartmental model. (B) Relationship between regional PSR values and Kcplx macroparameter determined using Patlak graphical analysis. Brain regions include visual cortex, brain stem, cerebellar thalamus, frontal cortex, and white matter. Line of identity is displayed as dotted line. Plot shows excellent correlation between these 2 measures of PSR (ρ = 0.65).
Effect of Population-Derived Metabolite Correction
K-complex values determined using the population-derived metabolite correction differed on average by 7% ± 6% from those derived using the individual fraction of metabolites in plasma (P = 0.18).
DISCUSSION
A major drawback of previous studies of protein synthesis measured with PET was that the models could account for the PSR estimated only from exogenously administered l-[1-11C]-leucine. However, animal studies have shown that almost 40% of leucine in the precursor pool is derived from endogenous recycling by proteolysis (4). Hence, estimates of cerebral protein synthesis without correction for the endogenous leucine pool considerably underestimated the overall PSR. Recently, Schmidt et al. (6) proposed a solution to account for the fraction of leucine derived from endogenous proteolysis. In their model, the fraction of leucine derived from plasma was defined by the factor λ, so that the leucine contribution from brain tissue proteolysis could be accounted for by the term (1 − λ). Under the assumption of dynamic equilibrium, these investigators showed that the factor λ can be derived from the estimated model parameters. A 2-tissue-compartment model proved to be well identifiable when applied to l-[1-11C]-leucine time–activity curves and resulted in stable estimates of both the Kcplx (K1k3/(k2 + k3)) and the λ (k2/(k2 + k3)) macroparameters.
Our analysis showed a significant sex difference in the Kcplx macroparameter, with female Kcplx values being on average 30% higher than male values. This difference was caused mainly by an increase in the influx rate constant K1. Because leucine influx is regulated by the blood–brain barrier LNAA l-type amino acid transporter, which is nearly saturated under normal physiologic conditions (15,22,23), all substrates compete for the same binding site. This competition for transport suggests that leucine availability in the brain is inversely related to plasma total LNAA concentration. In agreement with this mechanism, we observed an inverse relationship between the K1 parameter and the total LNAA concentration in the 2 sex groups. The K1 parameter was found to be 30% lower in men, whereas the plasma total LNAA concentration was 13% higher in men than in women. Such an inverse relationship was previously reported in vervet monkeys by Stout et al. (18), who studied the effects of total LNAA levels on FDOPA kinetics and found that both the K1 transport parameter and the Kcplx macroparameter showed an inverse relationship with plasma total LNAA levels. Moreover, these investigators also showed that the affinity-weighted LNAA sum only weakly correlated with both the K1 and the Kcplx parameters, a result that we confirmed with our data. Whereas in our data the plasma total sum of all LNAAs was significantly increased in men, the male KM(app) was only 6% higher than the female KM(app), and this difference was not significant. One might only speculate about the reason for this surprising outcome; however, although species differences might be a contributing factor, the reason for the lower correlation between the affinity-weighted sum of LNAAs and parameters derived from compartmental modeling can most likely be attributed to methodologic differences in the KM determination.
In accordance with previous reports indicating a striking difference between the sexes with respect to the plasma concentration of several amino acids (24), the population mean of male LNAA plasma concentration determined in our subjects was significantly higher than the population mean of LNAA plasma concentration in women (Fig. 4A). A higher population mean for male total LNAA concentration was found despite the fact that both sexes had fasted and received weight-adjusted oral glucose loading before the study. Possible reasons for this difference might be the higher muscle mass of men, higher protein intake and level of exercise in men, or higher rate of amino acid oxidation in women (25,26). Furthermore, it has long been known that carbohydrate ingestion reduces plasma LNAAs (12,13). Because all our subjects were glucose loaded before PET to increase the uptake of LNAAs into tissue, the concentration of plasma leucine and the concentration of the total sum of LNAAs was decreased by about 35% from normal levels.
To test whether kinetic parameters derived from labeled leucine should be corrected for the presence of other LNAAs that compete for the same transport carrier, we normalized the obtained Kcplx to a standard plasma total LNAA concentration of 1,000 μmol/L. Whereas the nonnormalized Kcplx values differed significantly between men and women, after normalization the Kcplx′ values were similar between the sexes. Subsequently, the incorporation of leucine from exogenous sources into tissue can be calculated by multiplying the Kcplx macroparameter by the leucine plasma concentration. Furthermore, after one has accounted for leucine generated by endogenous proteolysis using the λ-macroparameter, the overall incorporation rate of leucine into tissue (from both exogenous and endogenous sources) can be calculated. Under normal physiologic conditions, this value is closely related to the synthesis of cell proteins and thus can be regarded as an index of the tissue PSR. Our results show that neither PSR nor PSR′ is significantly different between men and women (Fig. 6); however, the difference between the sexes is smaller for the PSR′. It appears that under normal physiologic conditions, normalization of the Kcplx to a standard plasma total LNAA concentration is not required, but future studies on groups of patients with abnormal regional protein synthesis will be needed to determine the applicability of both these indices to quantification of in vivo PSR. The regional rank order of PSR values obtained in our study was similar between men and women and agreed well with the rank order of PSRs in nonhuman primates reported previously (6). The highest PSR values were found in the visual cortex and brain stem (both of which are brain regions with high protein synthesis), and the lowest PSR values were in white matter (Table 3).
The human whole-brain λ-value reported here (mean, 0.64 ± 0.02; range, 0.57–0.73) is consistent with previous autoradiographic study results on rats. For example, Smith et al. (4) reported an average λ-value of 0.64 in their study on the brains of anesthetized adult rats, and a recent PET study on rhesus monkeys performed by the same investigators (7) found somewhat higher λ-values in the range of 0.72–0.77. Moreover, our results suggest that λ is a more stable macroparameter than Kcplx. The variability of λ was small between subjects and within subjects across different regions. The between-subject variability of λ was in the range of 2%–7%, whereas that of Kcplx was in the range of 16%–25%. The low variability of λ suggests that in future studies the λ-macroparameter might be approximated by a constant factor with reasonable accuracy. Because arterial blood sampling is necessary for estimation of λ, replacing λ with a constant factor might simplify the data acquisition protocol, especially as the Kcplx macroparameter can be estimated noninvasively using an image-based input function and Patlak graphical analysis. Although λ appears to be constant in adults, determination of a possible age effect on λ needs to be further investigated in the developing brain.
Because the Kcplx macroparameter can be estimated from data acquired later than 30 min after tracer injection, the initial 30 min can be used to scan the left ventricle and to determine the arterial input function noninvasively from a left ventricular ROI. This method, which has been well established in pediatric imaging (27,28), requires only a few venous blood samples at later time points. The Patlak graphical analysis method can subsequently be applied to calculate parametric images of the Kcplx macroparameter. Because the Kcplx derived using the Patlak graphical analysis follows the same rank order as the PSR and is independent of fluctuations in plasma leucine levels, this noninvasive parameter might be a more reliable index of brain protein synthesis than are the calculated PSR values.
Because l-[1-11C]-leucine in plasma is rapidly incorporated into plasma proteins, and this portion is not a substrate for transport across the blood–brain barrier, the input function needs to be corrected for the accumulation of l-[1-11C]-leucine in plasma proteins. We fitted the fraction between the free l-[1-11C]-leucine and the total 11C activity in blood obtained in all subjects using a sigmoidal fit as shown in Figure 1B. The sigmoidal fit approximated the data well, explaining more than 90% of the variance. Kcplx values calculated using a metabolite-corrected input function based on a population-derived leucine fraction in plasma proteins were not significantly different from those determined using the individual correction for leucine in plasma proteins. This result suggests that, although LNAA and leucine levels might be altered in disease states and possibly affect leucine metabolism, a population-derived metabolite correction might be useful in decreasing the amount of sampled blood, especially in children. However, further studies on different patient populations are needed to establish the applicability of this approach.
CONCLUSION
Endogenous proteolysis contributes a significant but relatively constant fraction of amino acids to the brain precursor pool in healthy adults. Brain PSR can be estimated on the basis of the Kcplx of leucine, with or without correction for total LNAA levels. Moreover, the application of a noninvasive protocol using the Patlak graphical analysis method and a population-derived blood metabolite correction allows calculation of an index of protein synthesis from the exogenous leucine pool with an acceptable error margin.
Acknowledgments
We thank Joel Ager, PhD, and James Janisse, PhD, from the Center for Health Care Effectiveness Research at Wayne State University, as well as the PET Center staff at Children's Hospital of Michigan, for their collaboration and assistance in performing the studies. We also thank Joseph Fenstermacher, PhD, from the Henry Ford Health Systems in Detroit; Quentin Smith, PhD, from Texas Tech University; and Ruben Boado, PhD, from UCLA for helpful discussions about LNAA transport at the blood–brain barrier.
Footnotes
-
COPYRIGHT © 2006 by the Society of Nuclear Medicine, Inc.
References
- Received for publication June 26, 2006.
- Accepted for publication August 14, 2006.


