


Abstract
The goal of this study was to validate the accuracy of the Emory Cardiac Tool Box (ECTB) in assessing left ventricular end-diastolic or end-systolic volume (EDV, ESV) and ejection fraction (LVEF) from gated 99mTc-methoxyisobutylisonitrile (99mTc-MIBI) SPECT using cardiac MRI (cMRI) as a reference. Furthermore, software-specific characteristics of ECTB were analyzed in comparison with 4D-MSPECT and Quantitative Gated SPECT (QGS) results (all relative to cMRI). Methods: Seventy patients with suspected or known coronary artery disease were examined using gated 99mTc-MIBI SPECT (8 gates/cardiac cycle) 60 min after tracer injection at rest. EDV, ESV, and LVEF were calculated from gated 99mTc-MIBI SPECT using ECTB, 4D-MSPECT, and QGS. Directly before or after gated SPECT, cMRI (20 gates/cardiac cycle) was performed as a reference. EDV, ESV, and LVEF were calculated using Simpson’s rule. Results: Correlation between results of gated 99mTc-MIBI SPECT and cMRI was high for EDV (R = 0.90 [ECTB], R = 0.88 [4D-MSPECT], R = 0.92 [QGS]), ESV (R = 0.94 [ECTB], R = 0.96 [4D-MSPECT], R = 0.96 [QGS]), and LVEF (R = 0.85 [ECTB], R = 0.87 [4D-MSPECT], R = 0.89 [QGS]). EDV (ECTB) did not differ significantly from cMRI, whereas 4D-MSPECT and QGS underestimated EDV significantly compared with cMRI (mean ± SD: 131 ± 43 mL [ECTB], 127 ± 42 mL [4D-MSPECT], 120 ± 38 mL [QGS], 137 ± 36 mL [cMRI]). For ESV, only ECTB yielded values that were significantly lower than cMRI. For LVEF, ECTB and 4D-MSPECT values did not differ significantly from cMRI, whereas QGS values were significantly lower than cMRI (mean ± SD: 62.7% ± 13.7% [ECTB], 59.0% ± 12.7% [4DM-SPECT], 53.2% ± 11.5% [QGS], 60.6% ± 13.9% [cMRI]). Conclusion: EDV, ESV, and LVEF as determined by ECTB, 4D-MSPECT, and QGS from gated 99mTc-MIBI SPECT agree over a wide range of clinically relevant values with cMRI. Nevertheless, any algorithm-inherent over- or underestimation of volumes and LVEF should be accounted for and an interchangeable use of different software packages should be avoided.
- gated 99mTc-MIBI SPECT
- Emory Cardiac Tool Box
- 4D-MSPECT
- Quantitative Gated SPECT
- cardiovascular MRI
- left ventricular volumes
- ejection fraction
Evidence and the extent of regional and global cardiac dysfunction in coronary artery disease not only are a diagnostic criterion of heart failure but also provide essential information on the expected clinical outcome. Left ventricular volumes and ejection fraction (LVEF) as indicators of impaired systolic function have proven to be especially powerful and reliable predictors of poor long-term prognosis (1–3).
Electrocardiographically gated SPECT, a primary diagnostic technique in coronary artery disease, allows myocardial perfusion imaging (4) with subsequent analysis of regional wall motion, regional wall thickening, and calculation of global function from end-diastolic and end-systolic volumes (EDV, ESV) as well as LVEF (5–8). This integrated approach combining analysis of perfusion and function has already proven to be useful in tissue characterization (9) and prognosis prediction (10).
For computation of volumes and LVEF, the widespread, commercially available automated Quantitative Gated SPECT algorithm (QGS; Cedars-Sinai Medical Center) was most frequently validated using the current gold standard, cardiac MRI (cMRI) (11–17). 4D-MSPECT (University of Michigan Medical Center), another commonly used software algorithm, has recently been validated with cMRI by our study group (17). The third software algorithm is the Emory Cardiac Tool Box (ECTB; Emory University Hospital), which was introduced and initially compared with cMRI in 7 patients (8). A more recent article validates ECTB in 30 patients using cMRI at rest as a reference; however, the gated SPECT study was done 15 min after stress (18). In that study, QGS was evaluated simultaneously, but the results of the correlation analyses—for example, 0.72 for LVEF—were lower than those normally seen—for example, 0.82–0.94 (11–13,15–17). This discrepancy between poststress gated SPECT and rest cMRI can be attributed to stunning in ischemic or lingering hypercontractility in normal myocardium in the poststress gated SPECT study (19,20).
Therefore, validation of ECTB-assessed EDV, ESV, and LVEF from a rest gated SPECT study versus timely resting cMRI in a large patient cohort was the primary goal of this study. ECTB results were compared with those from 4D-MSPECT and QGS (both relative to cMRI) to analyze and compare software-specific characteristics.
As the standard of reference for validation of gated 99mTc-methoxyisobutylisonitrile (99mTc-MIBI) SPECT studies, cMRI has been established as the best-suited available modality in assessment of cardiac volumes and function because it does not rely on geometric assumptions of left ventricular shape (21).
MATERIALS AND METHODS
Patients
The study was comprised of 70 patients (54 male, 16 female; mean age ± SD, 59.7 ± 12.4 y; age range, 33–82 y) without MRI contraindications who were referred for routine stress–rest myocardial perfusion imaging using 99mTc-MIBI SPECT. The 2-d SPECT protocol started with the stress part followed within at a minimum of 48 h by the rest gated SPECT and cMRI study on the same day. All patients gave informed consent.
Coronary artery disease was suspected in 29 patients. Of the 41 patients with known coronary artery disease, 27 had a history of ≥1 myocardial infarction, and 11 had a coronary artery bypass graft.
Gated 99mTc-MIBI SPECT and Data Analysis
Gated acquisition (64 × 64 matrix) was done on a Multispect 3 triple-head γ-camera (Siemens Gammasonics, Inc.) 60 min after intravenous administration of 446 ± 32 MBq (mean ± SD) 99mTc-MIBI, with 20 views, at 30 s per view, and a zoom factor of 1.23. The cardiac cycle was divided into 8 equal intervals. All gates were reconstructed using filtered backprojection (Butterworth filter, third order; critical frequency, 0.5).
Both reorientation and data analysis were done by one observer (hereafter referred to as observer 1). The datasets were transferred to an ICON system (Siemens Gammasonics Inc.), where they were reoriented on the transversal planes, first parallel to the septum and then parallel to the inferior wall. The reoriented short-axis datasets (voxel size, 5.8 × 5.8 × 5.8 mm3) were stored for analysis.
Gated SPECT images were analyzed for the same functional variables with 3 different quantification packages: ECTB (version 3.5.7.13) and 4D-MSPECT (version 2.1.6.5) on a Siemens e.soft workstation and QGS (version 3.0) on a Siemens ICON system. All SPECT datasets were evaluated by observer 1, who was unaware of the cMRI results. All 3 algorithms used automatic processing. Only ECTB and 4D-MSPECT had the option of manual correction in case of inadequate anatomic delineation because the QGS was an older version that did not yet have this option. The newer QGS version on the Siemens e.soft workstation, based on the same algorithm as the ICON version, also allows manual correction. EDV and ESV values were given in milliliters and LVEF values were given in percentage.
cMRI Methodology and Data Analysis
All patients underwent cMRI directly before or after SPECT on a 1.5-T Gyroscan ACS-NT unit (Philips Medical Systems) equipped with a maximum gradient strength of 23 mT/m. MRI was done with a 5-element cardiac phased-array coil and electrocardiographic triggering. A balanced fast-field echo sequence (22) was used for all patients, with repetition time/echo time, 3.1/1.5; flip angle, 65°; matrix, 256 × 256 (field of view, 350–400 mm); and slice thickness, 8 mm. Each slice was acquired in a separate breath-hold cycle at end expiration. Twenty phases were obtained per cardiac cycle. Integrated sensitivity-encoding technology reduced acquisition time for most patients. On the bases of vertical and horizontal long axes of the left ventricle, the true short axis was determined covering the left ventricle from base to apex.
Functional analysis of MRI data occurred on a separate workstation using commercially available MASS software (version 5.0; Medis Medical Imaging Systems). A second observer, observer 2, who was unaware of the SPECT results, did all cMRI examinations and data analyses. After determining the cardiac base and apex, the first gate in each series was defined as the end-diastole and the image with the smallest ventricular volume was defined as the end-systolic phase. Left ventricular volumes were delineated by manually tracing the endocardial contours of the end-diastolic and end-systolic phase, the trabeculation, and papillary muscles segmented as part of the myocardium. EDV and ESV were then automatically computed in milliliters using the modified Simpson’s rule (21) by summing the cross-sectional areas contained by the endocardial borders of all short-axis slices included in the analysis. The ejection fraction was expressed as percentage and calculated as the stroke volume divided by the EDV.
Statistical Analysis
All statistical analyses were done using SPSS 10 (SPSS Inc.) and Origin 6.1 G (OriginLAb Corp.). Data are shown as mean ± SD. Mean values of EDV, ESV, and LVEF were tested for significance using a t test for paired samples. A significance level of P < 0.05 (after applying the Bonferroni–Holm correction for multiple comparisons) was accepted as significant. The degree of agreement was evaluated according to Bland and Altman (23); Bland–Altman limits (mean of the differences ± 2 SDs of the differences) are shown in the figures. Pearson correlation coefficients were also calculated.
RESULTS
Mean EDV, ESV, and LVEF
Mean values of EDV, ESV, and LVEF from cMRI, ECTB, QGS, and 4D-MSPECT are shown in Figure 1.

Mean values of EDV, ESV, and LVEF from cMRI, ECTB, 4D-MSPECT (4D-M), and QGS. ↔ indicates P < 0.05 (t tests for paired samples, Bonferroni–Holm corrected for multiple comparisons).
EDVs ranged from 64 to 254 mL for ECTB, from 60 to 250 mL for 4D-MSPECT, from 58 to 216 mL for QGS, and from 66 to 234 mL for cMRI. EDV from ECTB did not differ significantly from cMRI, whereas 4D-MSPECT and QGS significantly underestimated EDV compared with cMRI (131 ± 43 mL [ECTB], 127 ± 42 mL [4D-MSPECT], 120 ± 38 mL [QGS], 137 ± 36 mL [cMRI]). Intra-SPECT EDV comparisons resulted in significantly lower values by QGS than by ECTB and 4D-MSPECT; ECTB and 4D-MSPECT did not differ significantly.
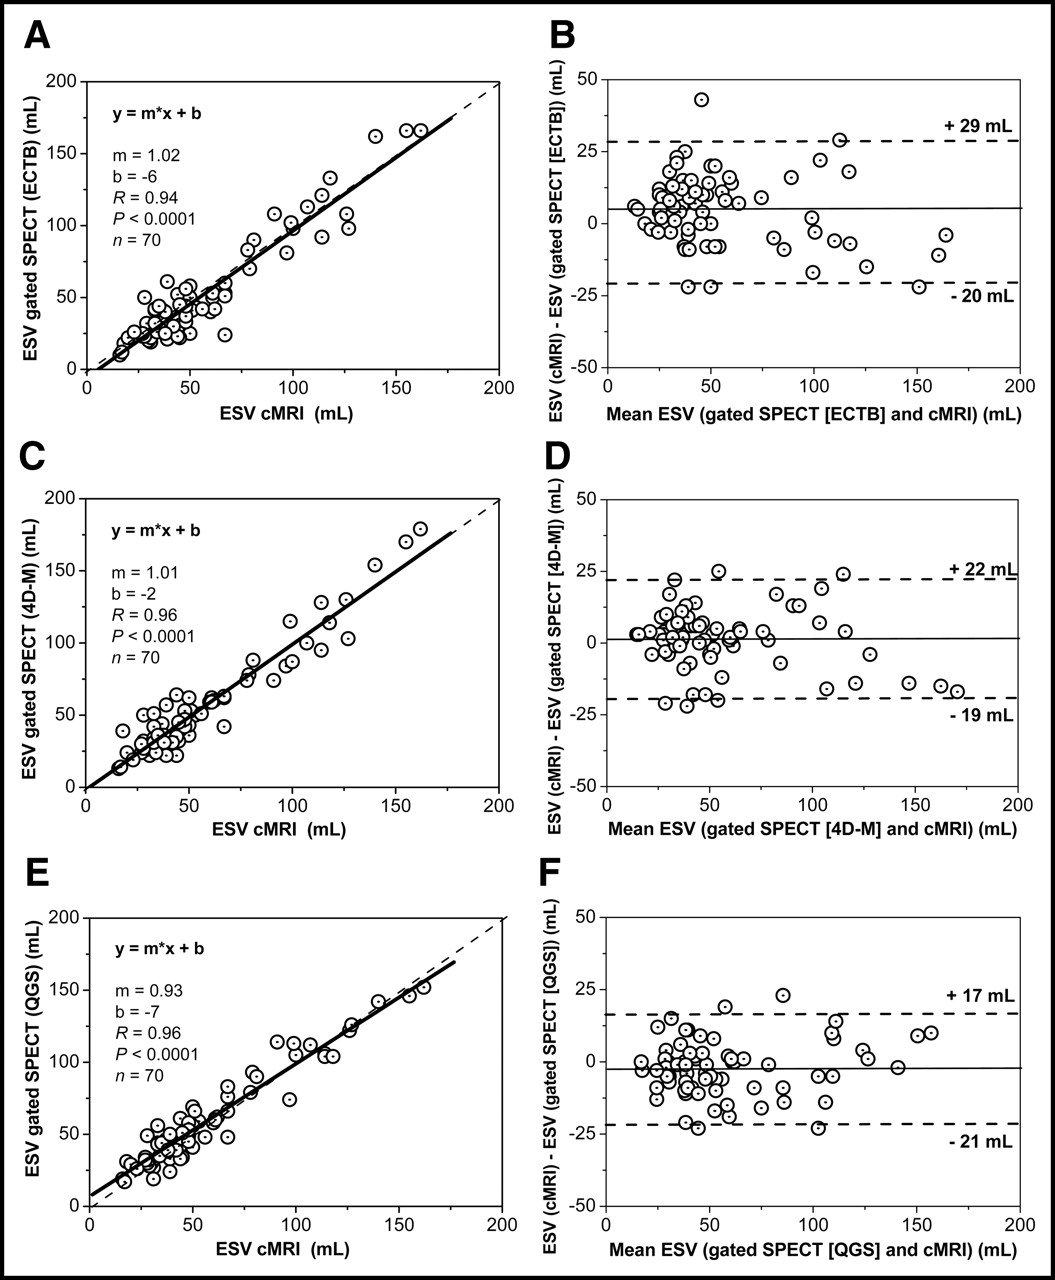
ESVs ranged from 10 to 166 mL for ECTB, from 13 to 179 mL for 4D-MSPECT, from 17 to 152 mL for QGS, and from 16 to 162 mL for cMRI. ESV from ECTB was significantly lower than that from cMRI, whereas ESV from 4D-MSPECT and QGS did not differ significantly from cMRI (53 ± 37 mL [ECTB], 56 ± 36 mL [4D-MSPECT], 60 ± 33 mL [QGS], 57 ± 34 mL [cMRI]). Intra-SPECT ESV comparisons yielded significantly lower values by ECTB than by QGS and significantly lower values by 4D-MSPECT than by QGS; as for EDV, ECTB and 4D-MSPECT did not differ significantly.
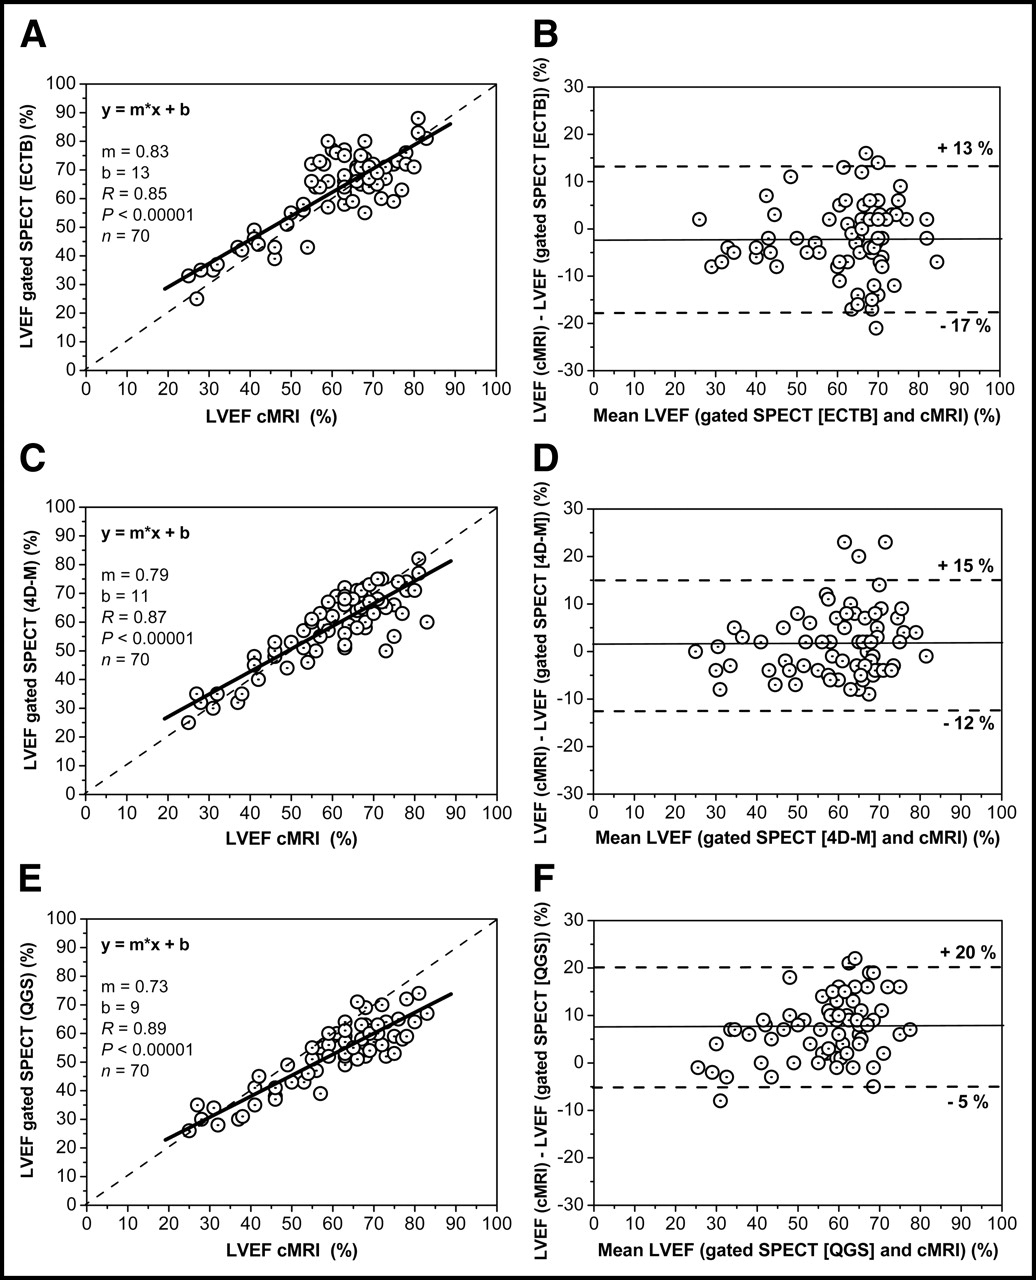
LVEF ranged from 25% to 88% for ECTB, from 25% to 82% for 4D-MSPECT, from 26% to 74% for QGS, and from 25% to 83% for cMRI. No significant differences were observed for LVEF between ECTB and cMRI and between 4D-MSPECT and cMRI, whereas QGS yielded significantly lower values than by cMRI: (62.7% ± 13.7% [ECTB], 59.0% ± 12.7% [4DM-SPECT], 53.2% ± 11.5% [QGS], 60.6% ± 13.9% [cMRI]). Intra-SPECT LVEF comparisons yielded significantly lower values by QGS than by ECTB and 4D-MSPECT and significantly lower values by 4D-MSPECT than by ECTB.
Correlation Analysis of Gated SPECT Versus cMRI
The correlation between EDV of gated 99mTc-MIBI SPECT and cMRI was high for ECTB (R = 0.90, Fig. 2A), 4D-MSPECT (R = 0.88, Fig. 2C), and QGS (R = 0.92, Fig. 2E). The slope of the regression line was 1.08 for ECTB, 1.03 for 4D-MSPECT, and 1.00 for QGS. The correlation between ESV of gated 99mTc-MIBI SPECT and cMRI was likewise very high for ECTB (R = 0.94, Fig. 3A), 4D-MSPECT (R = 0.96, Fig. 3C), and QGS (R = 0.96, Fig. 3E). The slope of the regression line was 1.02 for ECTB, 1.01 for 4D-MSPECT, and 0.93 for QGS. The correlation between LVEF of gated 99mTc-MIBI SPECT and cMRI also was comparably high for ECTB (R = 0.85, Fig. 4A), 4D-MSPECT (R = 0.87, Fig. 4C), and QGS (R = 0.89, Fig. 4E). The slope of the regression line was 0.83 for ECTB, 0.79 for 4D-MSPECT, and 0.73 for QGS.
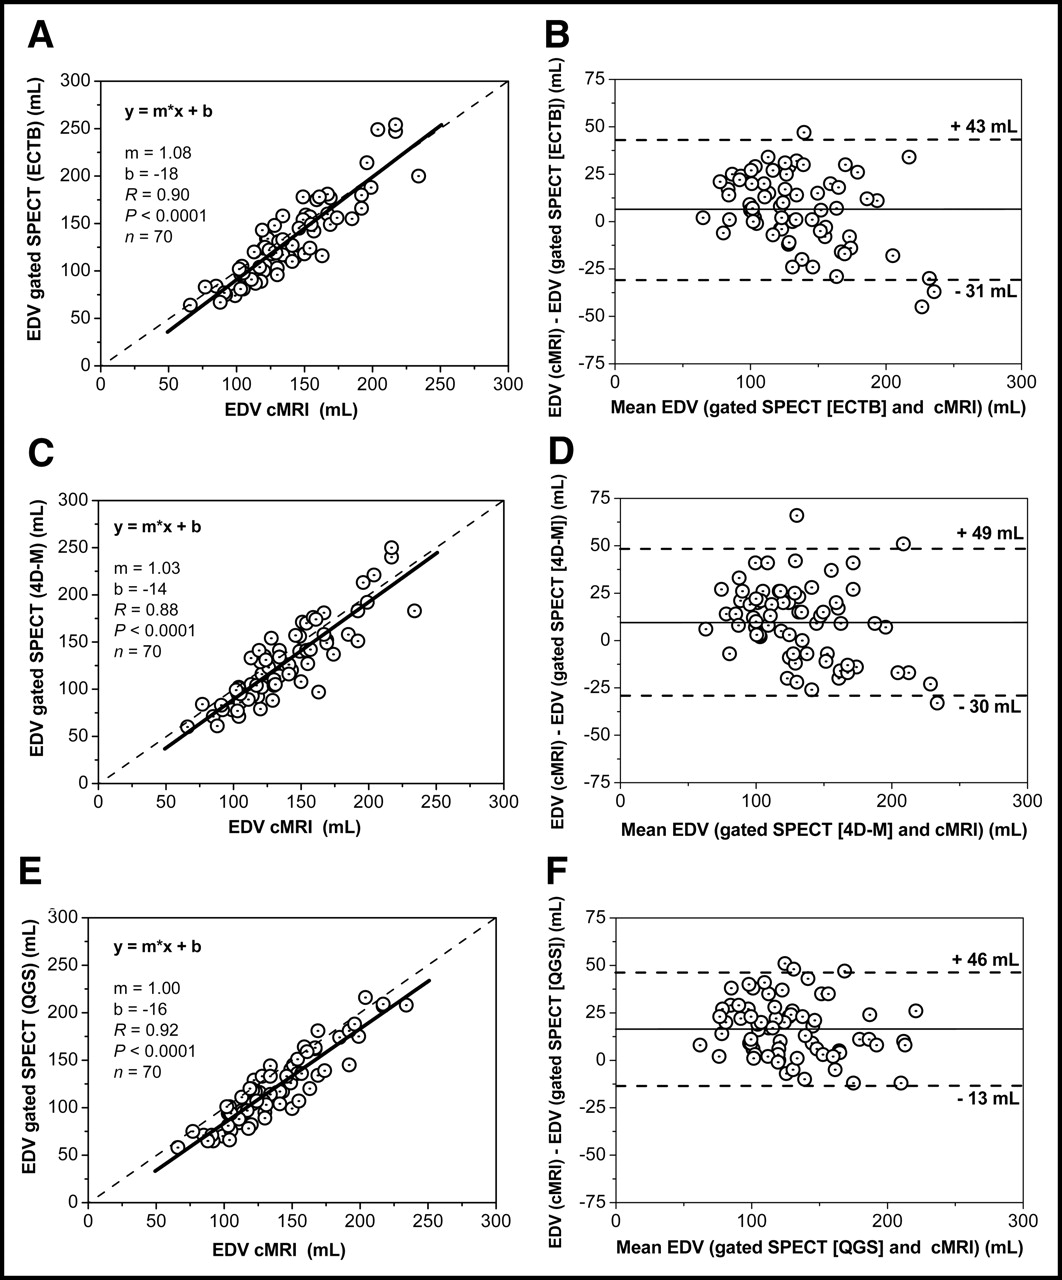
Correlation analysis of EDV estimated from gated SPECT and cMRI using ECTB (A), 4D-MSPECT (4D-M) (C), and QGS (E). Bland–Altman plots of comparisons for ECTB vs. cMRI (B), 4D-MSPECT [4D-M] vs. cMRI (D), and QGS vs. cMRI (F).

Correlation analysis of ESV estimated from gated SPECT and cMRI using ECTB (A), 4D-MSPECT (4D-M) (C), and QGS (E). Bland–Altman plots of comparisons for ECTB vs. cMRI (B), 4D-MSPECT [4D-M] vs. cMRI (D), and QGS vs. cMRI (F).

Correlation analysis of LVEF estimated from gated SPECT and cMRI using ECTB (A), 4D-MSPECT (4D-M) (C), and QGS (E). Bland–Altman plots of comparisons for ECTB vs. cMRI (B), 4D-MSPECT [4D-M] vs. cMRI (D), and QGS vs. cMRI (F).
Bland–Altman analysis revealed a small systematic underestimation of EDV by ECTB, a larger underestimation by 4D-MSPECT, and an even larger underestimation by QGS (Figs. 2B, 2D, and 2F). Bland–Altman analysis showed a small systematic underestimation of ESV by ECTB and no relevant systematic error for ESV estimation by either 4D-MSPECT or QGS (Figs. 3B, 3D, and 3F). Bland–Altman analysis revealed a small systematic overestimation of LVEF by ECTB, a small underestimation by 4D-MSPECT that was even more pronounced by QGS (Figs. 4B, 4D, and 4F), whereas analysis by QGS and cMRI showed that LVEF had the highest tendency toward a greater underestimation in ventricles with a good ejection fraction (Fig. 4F).
Correlation Analysis of ECTB Versus QGS Versus 4D-MSPECT
Correlations between the results of ECTB, 4D-MSPECT, and QGS were very high for EDV and ESV and rather high for LVEF (Table 1). Slopes of the regression lines, y-axis intercepts, and Bland–Altman limits are given in Table 1.
Results of Interalgorithm Comparisons
DISCUSSION
This study validates estimation of EDV, ESV, and LVEF using ECTB, 4D-MSPECT, and QGS with cMRI as the gold standard and with gated SPECT and cMRI conducted under resting nonpost–stress conditions within a very close time interval. Seventy patients who were representative of the heterogeneous clinical coronary artery disease spectrum with the typical age range were included. To preclude significant changes in physiologic status between the resting examinations, cMRI in our study was either performed directly before gated 99mTc-MIBI SPECT or subsequent to it. The results assessed with ECTB were further compared with those obtained with 4D-MSPECT and QGS.
cMRI was chosen as the method of reference because it represents the accepted standard for measuring global function (21). Volumetric accuracy was ensured by high tissue contrast facilitating endocardial border definition (22,24). Nevertheless, it must be kept in mind that the 2-dimensional short-axis slices are acquired separately, not simultaneously, which means that cMRI delivers nearly 3-dimensional but not true 3-dimensional data because the position of the heart is not exactly reproducible in the different breath-hold cycles. Although reproducibility of volumes and LVEF is very good for cMRI and gated SPECT, the influence of observer variability was minimized by experienced single-observer data evaluation of gated 99mTc-MIBI SPECT and cMRI.
The results of ECTB correlated very well with cMRI. ESV had the best correlation to cMRI, and EDV and LVEF had only slightly lower correlations. The same tendency was seen with 4D-MSPECT and QGS, with the best correlation of ESV to cMRI and slightly lower correlations for EDV and LVEF. The correlation of LVEF versus cMRI was slightly higher for QGS than for 4D-MSPECT, which in turn was somewhat higher than that for ECTB. The best correlation of ESV from gated SPECT with cMRI agrees well with published data (11–18), where ESV always had a better correlation than EDV and had a primarily better correlation than LVEF with cMRI. These effects can be explained by better count statistics due to the thickened wall, with less partial-volume effect in the systolic phase versus the diastolic phase. When comparing our results with those of Faber et al., who validated ECTB and QGS with cMRI in 30 patients (18), the regression coefficients for EDV are similar, with our study showing slightly better correlation coefficients for ESV and better correlation coefficients for LVEF. This can be explained by the methodologic approach of the study by Faber et al. (18), which compared gated SPECT performed 15 min after stress with true rest cMRI. Therefore, stunning in ischemic or lingering hypercontractility in normal myocardium might affect the results of the poststress gated SPECT study (19,20) compared with cMRI data acquired at rest.
When comparing the width of the Bland–Altman limits of all 3 algorithms versus cMRI, for EDV (Fig. 2) the limits of ECTB and 4D-MSPECT are somewhat wider than those for QGS, indicating that EDV values of ECTB and 4D-MSPECT seem to spread more around cMRI values than the QGS results. For ESV (Fig. 3), the width of the Bland–Altman limits is more comparable between ECTB, 4D-MSPECT, and QGS, indicating a similar dispersion. For LVEF (Fig. 4), the width of the Bland–Altman limits between ECTB, 4D-MSPECT, and QGS also indicates a similar dispersion.
Looking at the mean values, there are some characteristic systematic differences between the 3 algorithms. Using ECTB, EDV was smaller but did not differ significantly from cMRI, whereas 4D-MSPECT significantly underestimated EDV compared with cMRI, with QGS providing even lower EDV values than 4D-MSPECT, thus increasing the margin to cMRI. This finding has also been observed by most QGS versus cMRI validation studies (14–18), all describing an underestimation of EDV by gated SPECT compared with cMRI. The smaller EDV measured by ECTB, 4D-MSPECT, and QGS may be explained by the fact that the different acquisition mode of cMRI allows inclusion of outflow tract tissue, which is not part of left ventricular volume acquisition with gated SPECT because of the low counts in this area.
Comparison of the mean ESV from ECBT with cMRI unexpectedly yielded significantly lower values for ECTB, whereas comparison of the mean ESV from 4D-MSPECT and QGS with cMRI yielded no such differences. A significantly lower value by cMRI was expected because the lower temporal resolution of gated SPECT (8 gates/cardiac cycle) versus cMRI (20 gates/cardiac cycle) normally causes blurring of the much shorter end-systolic phase, resulting in overestimated ESV values by SPECT. However, in contrast to the physiologically expected overestimated ESV values with an acquisition mode of 8 gates, there is a general tendency for underestimating left ventricular volumes (as seen for EDV in our study), which attenuates or counteracts the physiologically expected ESV overestimation. However, for calculating LVEF, the systematic underestimation of expected volumes cancels out in division.
Like the data of Faber et al. (18), the comparison of LVEF from ECTB with cMRI yielded no significant differences, although a significant underestimation was expected since the lower temporal resolution of gated SPECT versus cMRI ought to result in underestimation of LVEF. 4D-MSPECT showed a very small nonsignificant underestimation of LVEF compared with cMRI, which again does not fit well with the expected underestimation. QGS showed an LVEF underestimation, which agrees with all QGS validation studies (13–18) using 8 gates per cardiac cycle as well as those using 16 gates per cardiac cycle, where this effect was not seen because differences in temporal resolution became less relevant between QGS and cMRI (11,12). As early as 1995, Germano et al. (5) showed that use of 8 frames instead of 16 resulted in a constant and predictable 4% decrease in LVEF. Nevertheless, QGS overshot the expected LVEF underestimation with 53.2% (QGS) versus 60.6% (cMRI), which may be a result of a systematic LVEF underestimation due to a constrained basal plane motion by QGS, as first hypothized by Ficaro et al. (25).
Furthermore, all 3 algorithms show a regression line (Figs. 4A, 4C, and 4E) with a slope distinctly smaller than 1, which fits the assumption that, in contractile ventricles with a good ejection fraction or hypertrophy of the myocardial wall, differences in temporal resolution become more relevant than in hypocontractile enlarged ventricles. QGS also showed the greatest deviation here, which again may be due to the constrained basal plane motion by QGS postulated by Ficaro et al. (25). With regard to clinical applications, however, it is noteworthy that a minimum deviation of LVEF is achieved in patients with moderately and severely impaired systolic function, which is the most important clinical group. The underestimation of LVEF by QGS can be explained at least in part by the acquisition mode of our data, though it remains unclear why this is not adequately pronounced with 4D-MSPECT, and completely absent with ECTB, even though all algorithms quantified the same datasets.
Direct comparisons of the results from ECTB versus QGS versus 4D-MSPECT (Table 1) gave a better correlation or smaller Bland–Altman limits for EDV, and comparable results for ESV and LVEF, than for all 3 algorithms versus cMRI. The excellent correlation for ESV in the validation versus cMRI for all algorithms as well as in the direct comparison between ECTB, 4D-MSPECT, and QGS can be explained by the better count statistics of the thickened wall, with a smaller partial-volume effect. Comparing these results with the 2 most relevant published studies of direct SPECT comparison of ECTB, 4D-MSPECT, and QGS (26,27), we found partially good agreement with those data. For EDV and LVEF intra-SPECT comparisons, the correlation coefficients in our study were comparable to those of Nakajima et al. (27) and of Lum and Coel (26). Unfortunately, both articles failed to present data for ESV. In agreement with our data, Lum and Coel found that EDV is significantly higher when estimated by ECTB than by QGS, smaller when estimated by QGS than by 4D-MSPECT, and not significantly different between ECTB and 4D-MSPECT. Also agreeing with our data, Nakajima et al. found that EDV is higher when estimated by ECTB than by QGS and not significantly different between ECTB and 4D-MSPECT. They found no significant difference for EDV between the 2 algorithms, whereas we found a smaller EDV when estimated by QGS than by 4D-MSPECT. As in our study, for LVEF, Lum and Coel and Nakajima et al. found that ECTB yielded significantly higher values than did QGS. Direct comparison of LVEF from ECTB and 4D-MSPECT yielded significantly higher values from ECTB in our study, whereas Lum and Coel and Nakajima et al. observed no significant differences. Again in agreement with our data, Lum and Coel found that LVEF from 4D-MSPECT is significantly higher than that from QGS, whereas Nakajima et al. observed no significant differences. Similar to our study, both Lum and Coel and Nakajima et al. allowed manual modification of SPECT data to correct inappropriate automatic wall tracing. Although autoprocessing had to be used for QGS due to the older version, 4D-MSPECT and ECTB could be partly user optimized. Nevertheless, since the interactive 4D-MSPECT and ECTB do not outperform the older QGS version, this limitation would not seem to be very important.
CONCLUSION
Despite small systematic differences, agreement between gated 99mTc-MIBI SPECT and cMRI is good over a wide range of EDV, ESV, and LVEF values calculated by ECTB, 4D-MSPECT, and QGS. Hence, gated 99mTc-MIBI SPECT provides clinically relevant information on cardiac function and volumes with all 3 algorithms. However, considering the importance of accurate LVEF measurement, especially in borderline values for therapeutic implications and follow-ups for evaluation of serial changes and prognostic conclusions, it should be kept in mind that the significant variations between ECTB, 4D-MSPECT, and QGS prohibit an interchangeable use of the 3 algorithms.
From a clinical point of view, each algorithm should be validated with the specific patient population as well as specific mode of SPECT acquisition and reconstruction against an accepted reference method or at least a healthy patient cohort should be used to get institutional reference values for EDV, ESV, and LVEF for the respective algorithm used.
Acknowledgments
Thanks are due to Norbert Franke from Siemens Germany for the unrestricted relinquishment of an e.soft workstation running the ECTB license and Alejandro Rodón for general and language editing. This article contains data from Dirk Standke’s doctoral thesis.
Footnotes
Received Aug. 13, 2004; revision accepted Jan. 5, 2005.
For correspondence or reprints contact: Wolfgang M. Schaefer, MD, PhD, Department of Nuclear Medicine, University Hospital, Aachen University of Technology, Pauwelsstrasse 30, 52074 Aachen, Germany.
E-mail: wschaefer{at}ukaachen.de
REFERENCES
In this issue


Jump to section
Related Articles
Cited By...
- Quantitative Clinical Nuclear Cardiology, Part 1: Established Applications
- Meta-Analyses of Human Cell-Based Cardiac Regeneration Therapies: Controversies in Meta-Analyses Results on Cardiac Cell-Based Regenerative Studies
- Development of a 2-Layer Double-Pump Dynamic Cardiac Phantom
- Absolute Quantification of Left Ventricular Global and Regional Function at Nuclear MPI Using Ultrafast CZT SPECT: Initial Validation Versus Cardiac MR
- Reference Ranges for LVEF and LV Volumes from Electrocardiographically Gated 82Rb Cardiac PET/CT Using Commercially Available Software
- Three-Dimensional Ordered-Subset Expectation Maximization Iterative Protocol for Evaluation of Left Ventricular Volumes and Function by Quantitative Gated SPECT: A Dynamic Phantom Study
- Automated Quality Control for Segmentation of Myocardial Perfusion SPECT
- An Improved Method for Automatic Segmentation of the Left Ventricle in Myocardial Perfusion SPECT
- Gated Myocardial Perfusion SPECT: Algorithm-Specific Influence of Reorientation on Calculation of Left Ventricular Volumes and Ejection Fraction