


Abstract
The biologic mechanisms involved in the intratumoral heterogeneous distribution of 18F-FDG have not been fully investigated. To clarify factors inducing heterogeneous 18F-FDG distribution, we determined the intratumoral distribution of 18F-FDG by autoradiography (ARG) and compared it with the regional expression levels of glucose transporters Glut-1 and Glut-3 and hexokinase-II (HK-II) in a rat model of malignant tumor. Methods: Rats were inoculated with allogenic hepatoma cells (KDH-8) into the left calf muscle (n = 7). Tumor tissues were excised 1 h after the intravenous injection of 18F-FDG and sectioned to obtain 2 adjacent slices for ARG and histochemical studies. The regions of interest (ROIs) were placed on ARG images to cover mainly the central (CT) and peripheral (PT) regions of viable tumor tissues and necrotic/apoptotic (NA) regions. The radioactivity in each ROI was analyzed quantitatively using a computerized imaging analysis system. The expression levels of Glut-1, Glut-3, and HK-II were determined by immunostaining and semiquantitative evaluation. The hypoxia-inducible factor 1α (HIF-1α) was also immunostained. Results: ARG images showed that intratumoral 18F-FDG distribution was heterogeneous. The accumulation of 18F-FDG in the CT region was the highest, which was 1.6 and 2.3 times higher than those in the PT and NA regions, respectively (P < 0.001). The expression levels of Glut-1, Glut-3, and HK-II were markedly higher in the CT region (P < 0.001) compared with those in the PT region. The intratumoral distribution of 18F-FDG significantly correlated with the expression levels of Glut-1, Glut-3, and HK-II (r = 0.923, P < 0.001 for Glut-1; r = 0.829, P < 0.001 for Glut-3; and r = 0.764, P < 0.01 for HK-II). The positive staining of HIF-1α was observed in the CT region. Conclusion: These results demonstrate that intratumoral 18F-FDG distribution corresponds well to the expression levels of Glut-1, Glut-3, and HK-II. The elevated expression levels of Glut-1, Glut-3, and HK-II, induced by hypoxia (HIF-1α), may be contributing factors to the higher 18F-FDG accumulation in the CT region.
PET using 18F-FDG has been widely used not only for detecting and staging malignant tumors but also for monitoring therapy response and for differentiating malignant lesions from benign lesions (1–4). These applications are based on the increased 18F-FDG uptake due to enhanced glucose utilization in most tumors. The increased 18F-FDG accumulation in malignant tumors is associated with the rate of transport across the cell membrane, the activity of hexokinase, and the rate of dephosphorylation in the tissue (5,6). The transport of 18F-FDG across cell membranes is mediated by ≥5 structurally related proteins (constituting a family of glucose transporters, Glut-1 to Glut-5) (7,8). Significantly elevated expression levels of Glut-1 and Glut-3 are considered to be a factor contributing to the accumulation of 18F-FDG in malignant tumors (9–13). It has also been suggested that the activity level of hexokinase-II (HK-II) contributes to 18F-FDG accumulation in various malignant tumors (14). These studies, however, used PET or tissue-counting techniques and correlated average 18F-FDG accumulation in the tumor with protein expression.
It is well known that various components, including nonmalignant components, are involved in most solid tumors (15–17). Tumor tissues also show intratumoral heterogeneity in their various properties, which may originate from the diverse phenotypic properties of tumor cells or may be induced by their metabolic microenvironment (18–20). In this regard, intratumoral heterogeneity in 18F-FDG distribution has been well demonstrated by autoradiography (ARG) (15). However, there have been few reports regarding the biologic mechanisms involved in the intratumoral heterogeneous distribution of 18F-FDG. The relationships between the intratumoral distribution of 18F-FDG and the regional expression of glucose transporters or hexokinases remain to be investigated. Such data should be helpful in understanding the mechanism of 18F-FDG uptake in malignant tumors and should provide the biologic basis for diagnosing, staging, and prognosticating malignant tumors and monitoring therapy response by 18F-FDG PET.
To clarify factors inducing heterogeneous 18F-FDG distribution, we determined in this study the intratumoral distribution of 18F-FDG by ARG and compared it with the regional expression levels of Glut-1, Glut-3, and HK-II in a rat model of malignant tumor.
MATERIALS AND METHODS
Animal Studies
The experimental protocol was completely approved by the Laboratory Animal Care and Use Committee of Hokkaido University. Male Wistar King Aptekman/hok (WKAH) rats, weighing 203–268 g, were inoculated with a suspension of allogenic hepatoma cells (KDH-8, 1 × 10⁶ cells per rat) into the left calf muscle. Two weeks after the tumor inoculation, when the tumors were 2–3 cm in diameter, the rats were fasted overnight (n = 7) (21). Each rat was anesthetized with pentobarbital (50 mg/kg body weight, intraperitoneally) and was injected in the tail vein with 37 MBq of 18F-FDG synthesized as previously described (22). Sixty minutes after the 18F-FDG injection, the animals were sacrificed and the tumors were quickly excised. Each tumor tissue was then sectioned at 2- to 3-mm thickness to obtain 2 adjacent slices. One of the 2 slices was embedded in Tissue-Tek medium (Sakura Finetechnical Co., Ltd.) and frozen in isopentane/dry ice for ARG studies. Formalin-fixed, paraffin-embedded specimens were prepared using the other slice for subsequent histochemical studies (23).
ARG Studies
The frozen samples were cut into 20-μm sections with a CM3050-Cryostat (Leica) at −20°C. The tumor sections were placed in a phosphor image plate cassette, together with a set of calibrated standards (17), and an overnight ARG exposure was used to detect the distribution of 18F-FDG. The tumor sections (10 μm) adjacent to those used for the ARG studies were stained with hematoxylin and eosin (HE) for use as the reference to determine the regions of interest (ROIs) on the autoradiograms.
The ARG images were analyzed using a computerized imaging analysis system (BAS 5000 Bio-Imaging Analyzer; Fuji Photo Film Co., Ltd.). The resolution of ARG of the BAS 5000 is 100 μm. To quantitatively evaluate the distribution of 18F-FDG radioactivity, 32 ROIs (0.36 mm2) were determined on each ARG image. ROIs were placed to cover mainly the central (CT; n = 8) and peripheral (PT; n = 8) regions of the viable tumor tissues, necrotic/apoptotic (NA; n = 8) regions, and the surrounding muscle (SM; n = 8), by referring to the sections stained with HE (Fig. 1); each ROI was selected microscopically by a pathologist and identified by its predominant histologic characteristic as a region of the viable tumor cells and necrotic/apoptotic cells in the CT and PT regions on the HE section. Large necrotic regions occasionally observed in the center of the tumors were excluded from the evaluation. To avoid any bias, these ROIs were determined in a blind manner for ARG images and immunologic staining (Gluts and HK-II). The ROIs placed on HE images were transferred to ARG images by using computer software (MCID-M2 Image Analyzer; Imaging Research Inc.). Briefly, coordinates were set on both HE and ARG images, the coordinates of each ROI on the HE images was determined, and then each ROI was transferred to the same coordinates of the corresponding ARG images. The radioactivity in each ROI was shown by photostimulated luminescence per unit area, PSL/mm2 (PSL = a·D·t: a = constant; D = radioactivity exposed on imaging plate; t = exposed time); then each count of PSL/mm2 from a tumor section was recorded and used to calculate the mean counts per mm2 and converted to the percentage injected dose per gram (%ID/g) of tissue by using activity of the standards, with the assumption that tissue density is 1 g/cm3 (17,24). The mean radioactivities of the 8 ROIs determined for the CT, PT, NA regions, and SM, respectively, were used to evaluate the 18F-FDG accumulation in the tissues.
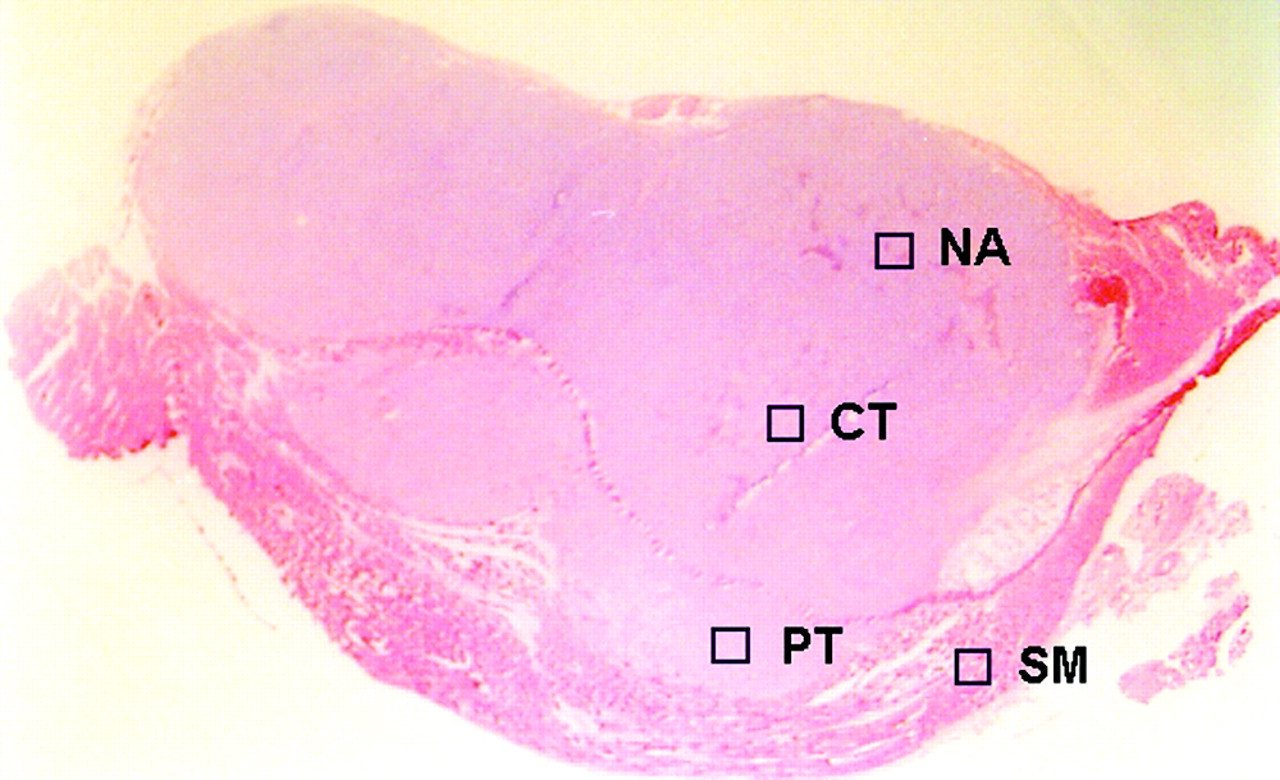
ROIs were placed on ARG image, to cover mainly central (CT) and peripheral (PT) regions of viable tumor tissues and necrotic/apoptotic (NA) regions, with reference to corresponding sections stained with HE. SM = surrounding muscle.
Histochemical Studies
The expression of Glut-1, Glut-3, and HK-II was studied in the sections of a formalin-fixed, paraffin-embedded tumor according to a standard immunostaining procedure (10,25). Briefly, after deparaffization and rehydration, endogenous peroxidase activity was blocked for 10 min in methanol containing 3% hydrogen peroxide. Thereafter, endogenous nonspecific antigens were blocked in 10% normal goat albumin (HISTOFINE SAB-PO kit; Nichirei) for 10 min at 37°C and then incubated with an anti-Glut-1, anti-Glut-3, or antihexokinase II antibody (Chemicon International Inc.) for 30 min at 37°C. The bound antibody was visualized using the avidin/biotin conjugate immunoperoxidase procedure (ABC) with the HISTOFINE SAB-PO kit and 3,3′-diaminobenzidine tetrahydrochloride. Tumor sections adjacent to those used for these histochemical studies were also stained with anti-HIF-1α (mouse antihypoxia-inducible factor 1α monoclonal IgG 2b, clone H1α67; Novus Biologicals) using the method of Zhong et al. (26) with slight modification. Briefly, after deparaffinization and rehydration, the slides were initially immersed in a target retrieval solution (10 mmol/L ethylenediaminetetraacetic acid, pH 8.0) and heated in a microwave oven (500 W) for 20 min. After the antigen retrieval, endogenous peroxidase activity was blocked for 5 min in methanol containing 3% hydrogen peroxide. Thereafter, endogenous nonspecific antigens were blocked in 10% hog albumin (Cosmo Bio., Ltd.) for 10 min and then incubated overnight with the primary antibody at 4°C. Finally, the bound antibody was visualized using the ABC procedure with the HISTOFINE MAX-PO (M) kit (Nichirei) and 3,3′-diaminobenzidine tetrahydrochloride. Tumor sections adjacent to those used for the immunostaining were stained with HE.
For immunohistochemical grading, ROIs placed on the HE-stained sections were transferred to immunologically stained sections as described. The intensity of staining and the percentage of positively stained cells in the CT (n = 8) and PT (n = 8) regions of the viable tumor tissues were evaluated microscopically. The intensity of staining (intensity) was graded from 0 to 3 (0 = not stained, 1 = equivocal, 2 = intense, and 3 = very intense) according to the criteria of Higashi et al. (27). Moreover, the percentage of positively stained cells (% positive) was classified from 1 to 5 (1 = 0%–20%, 2 = 20%–40%, 3 = 40%–60%, 4 = 60%–80%, and 5 = 80%–100%). The expression levels of Gluts and HK-II were assessed semiquantitatively using the product of these scores (intensity × % positive) (28). In HIF-1α staining, cells with completely and darkly stained nuclei were regarded as positively stained cells (29).
Statistical Analysis
All values are expressed as mean ± SD. One-way ANOVA and the Bonferroni post hoc test were used to assess the significance of differences due to the intratumoral distribution of 18F-FDG. To evaluate the significance of differences in the expression levels of Glut-1, Glut-3, and HK-II (intensity × % positive) between the CT and PT regions, an unpaired Student t test was performed. Simple regression analysis was used to compare the intratumoral 18F-FDG distribution and the expression levels of Glut-1, Glut-3, and HK-II. A 2-tailed P value < 0.05 was considered significant.
RESULTS
Intratumoral Distribution of 18F-FDG
Figure 2A shows the representative autoradiogram of 18F-FDG distribution in the tumor. The ARG images showed heterogeneous 18F-FDG distribution with a relatively higher 18F-FDG accumulation level in the CT regions of viable tumor tissues.

(A) Representative autoradiograph of 18F-FDG distribution. ARG image shows intratumoral heterogeneous 18F-FDG distribution. (B) Quantitative evaluation of intratumoral 18F-FDG distribution. 18F-FDG accumulation level in CT region was highest, which was 1.6 and 2.3 times higher than those in PT and NA regions, respectively (P < 0.001).
Results from the quantitative evaluation of 18F-FDG distribution are summarized in Figure 2B. The accumulation of 18F-FDG in the CT region was the highest (4.43 ± 0.50 %ID/g), which was 1.6 and 2.3 times higher than those in the PT region (2.85 ± 0.22 %ID/g) and the NA region (1.94 ± 0.10 %ID/g), respectively (P < 0.001). The accumulation of 18F-FDG in the PT region was 1.5 times and was significantly higher than that in the NA region (P < 0.001). The distribution of 18F-FDG in the SM (0.18 ± 0.01 %ID/g) was lower than those in any other ROIs determined in the tumor tissues (CT, PT, and NA).
Immunohistochemical Staining
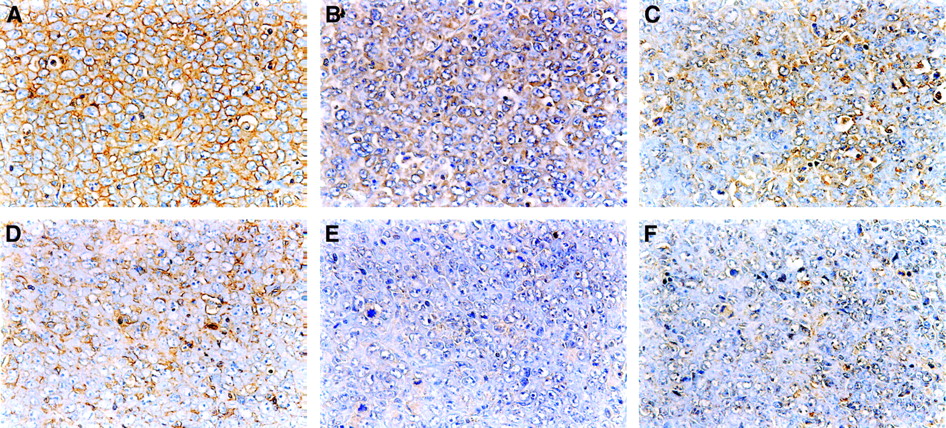
The typical immunostaining of Glut-1, Glut-3, and HK-II in the CT and PT region is shown in Figure 3. The intensity and extent of staining of Glut-1, Glut-3, and HK-II were markedly higher in the CT region than those in the PT region.

Staining with anti-Glut-1 (A and D), anti-Glut-3 (B and E), and anti-HK-II (C and F) antibodies in CT region (top) was more prominent than those in PT region (bottom) in KDH-8 tumor tissues, respectively (×400).
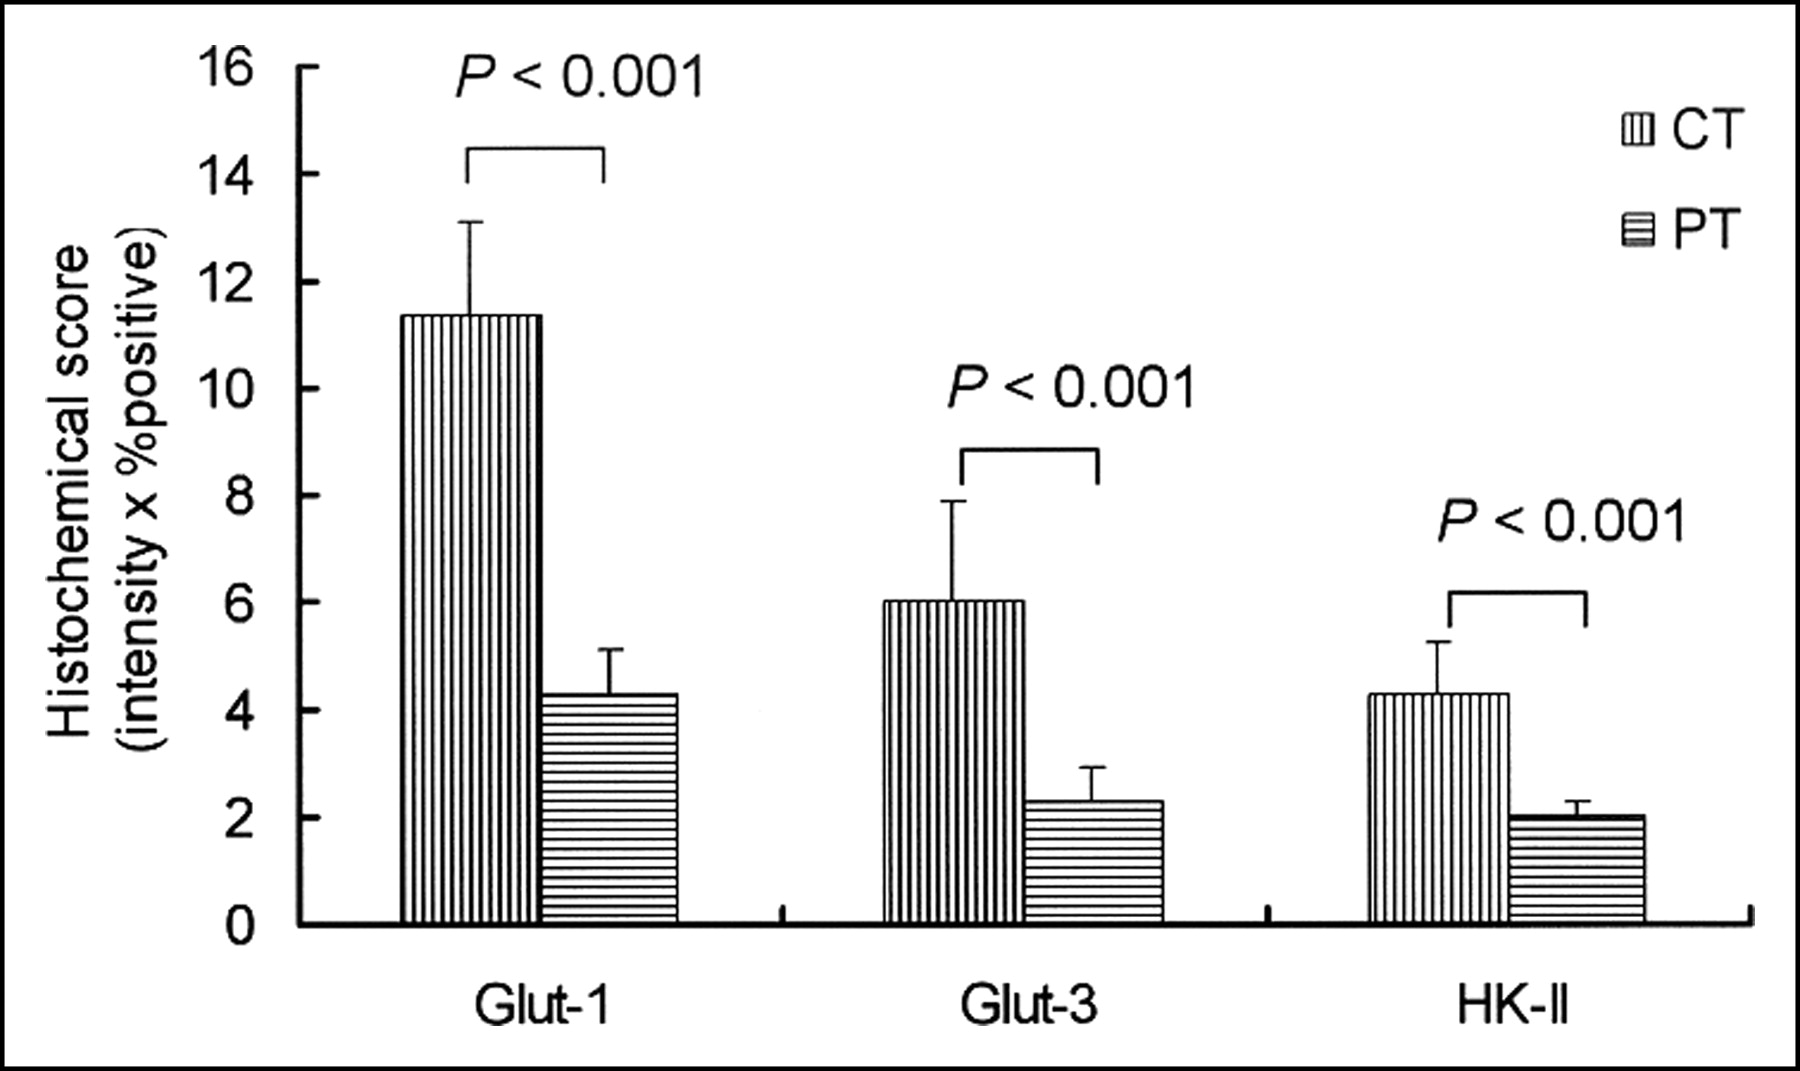
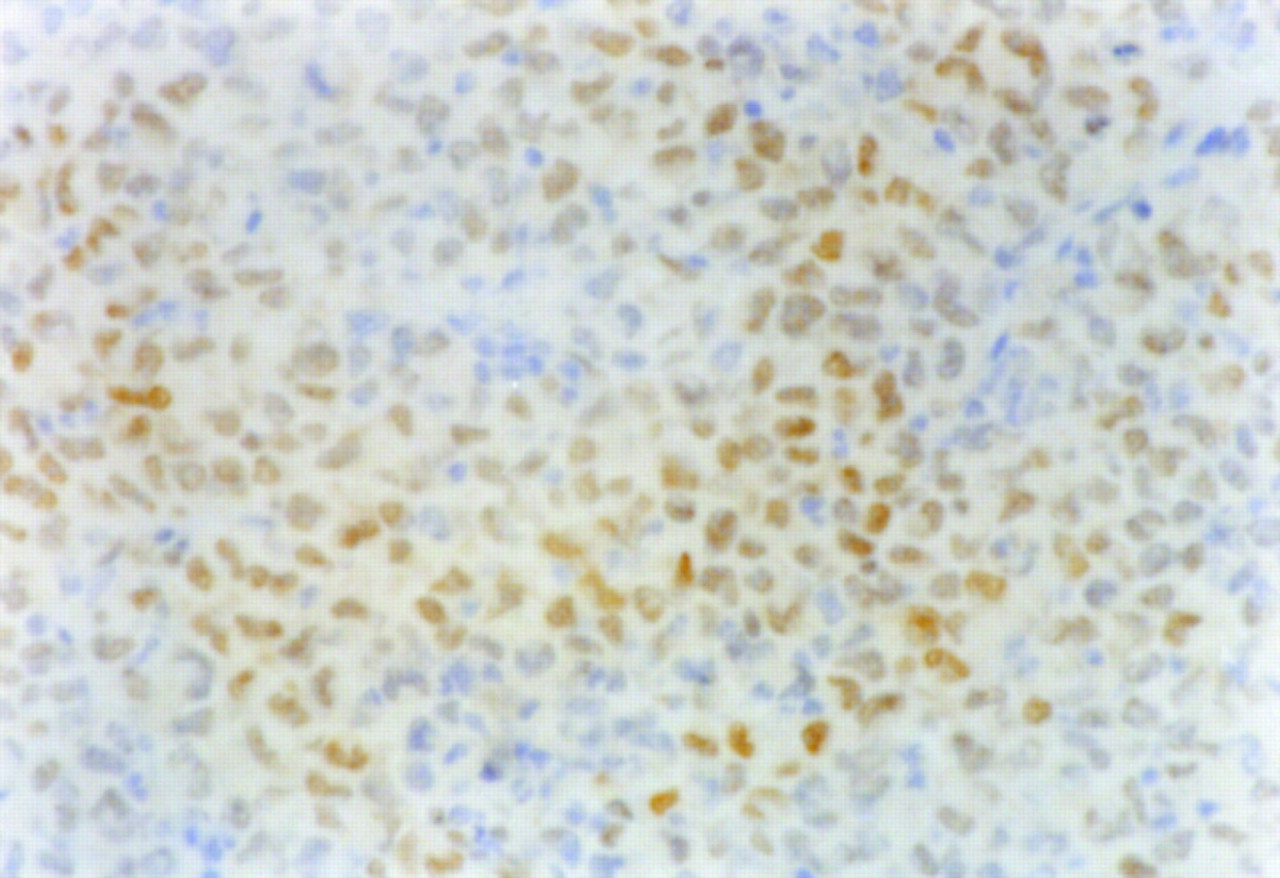
The results of immunohistochemical grading are summarized in Figure 4. The histochemical grading scores for Glut-1 and Glut-3 were significantly higher in the CT region (11.34 ± 1.78 for Glut-1 and 6.02 ± 1.83 for Glut-3) than those in the PT region (4.23 ± 0.85 for Glut-1 and 2.29 ± 0.62 for Glut-3; P < 0.001 for both). The histochemical grading score for HK-II was also significantly higher in the CT region (4.25 ± 0.98) compared with that in the PT region (2.00 ± 0.28; P < 0.001). The positive staining of HIF-1α was clearly observed in the CT region (Fig. 5) but not in the PT region.

Expression levels of Glut-1, Glut-3, and HK-II were assessed by semiquantitative immunohistochemical grading performed by calculating the product of these scores (intensity × % positive). Histochemical scores of Glut-1, Glut-3, and HK-II were significantly higher in CT region than those in PT region (P < 0.001).

Positive staining of HIF-1α was clearly observed in CT region (×400).
Relationships Between 18F-FDG Accumulation and Expression Levels of Gluts and HK-II
The accumulation of 18F-FDG and the expression levels of Glut-1, Glut-3, and HK-II were significantly higher in the CT region than those in the PT region (Figs. 2 and 4). Figure 6 shows scattergrams of histochemical grading scores and 18F-FDG accumulation. Intratumoral 18F-FDG accumulation significantly correlated with the expression levels of Glut-1, Glut-3, and HK-II: r = 0.923, P < 0.001 for Glut-1; r = 0.829, P < 0.001 for Glut-3; and r = 0.764, P < 0.01 for HK-II.
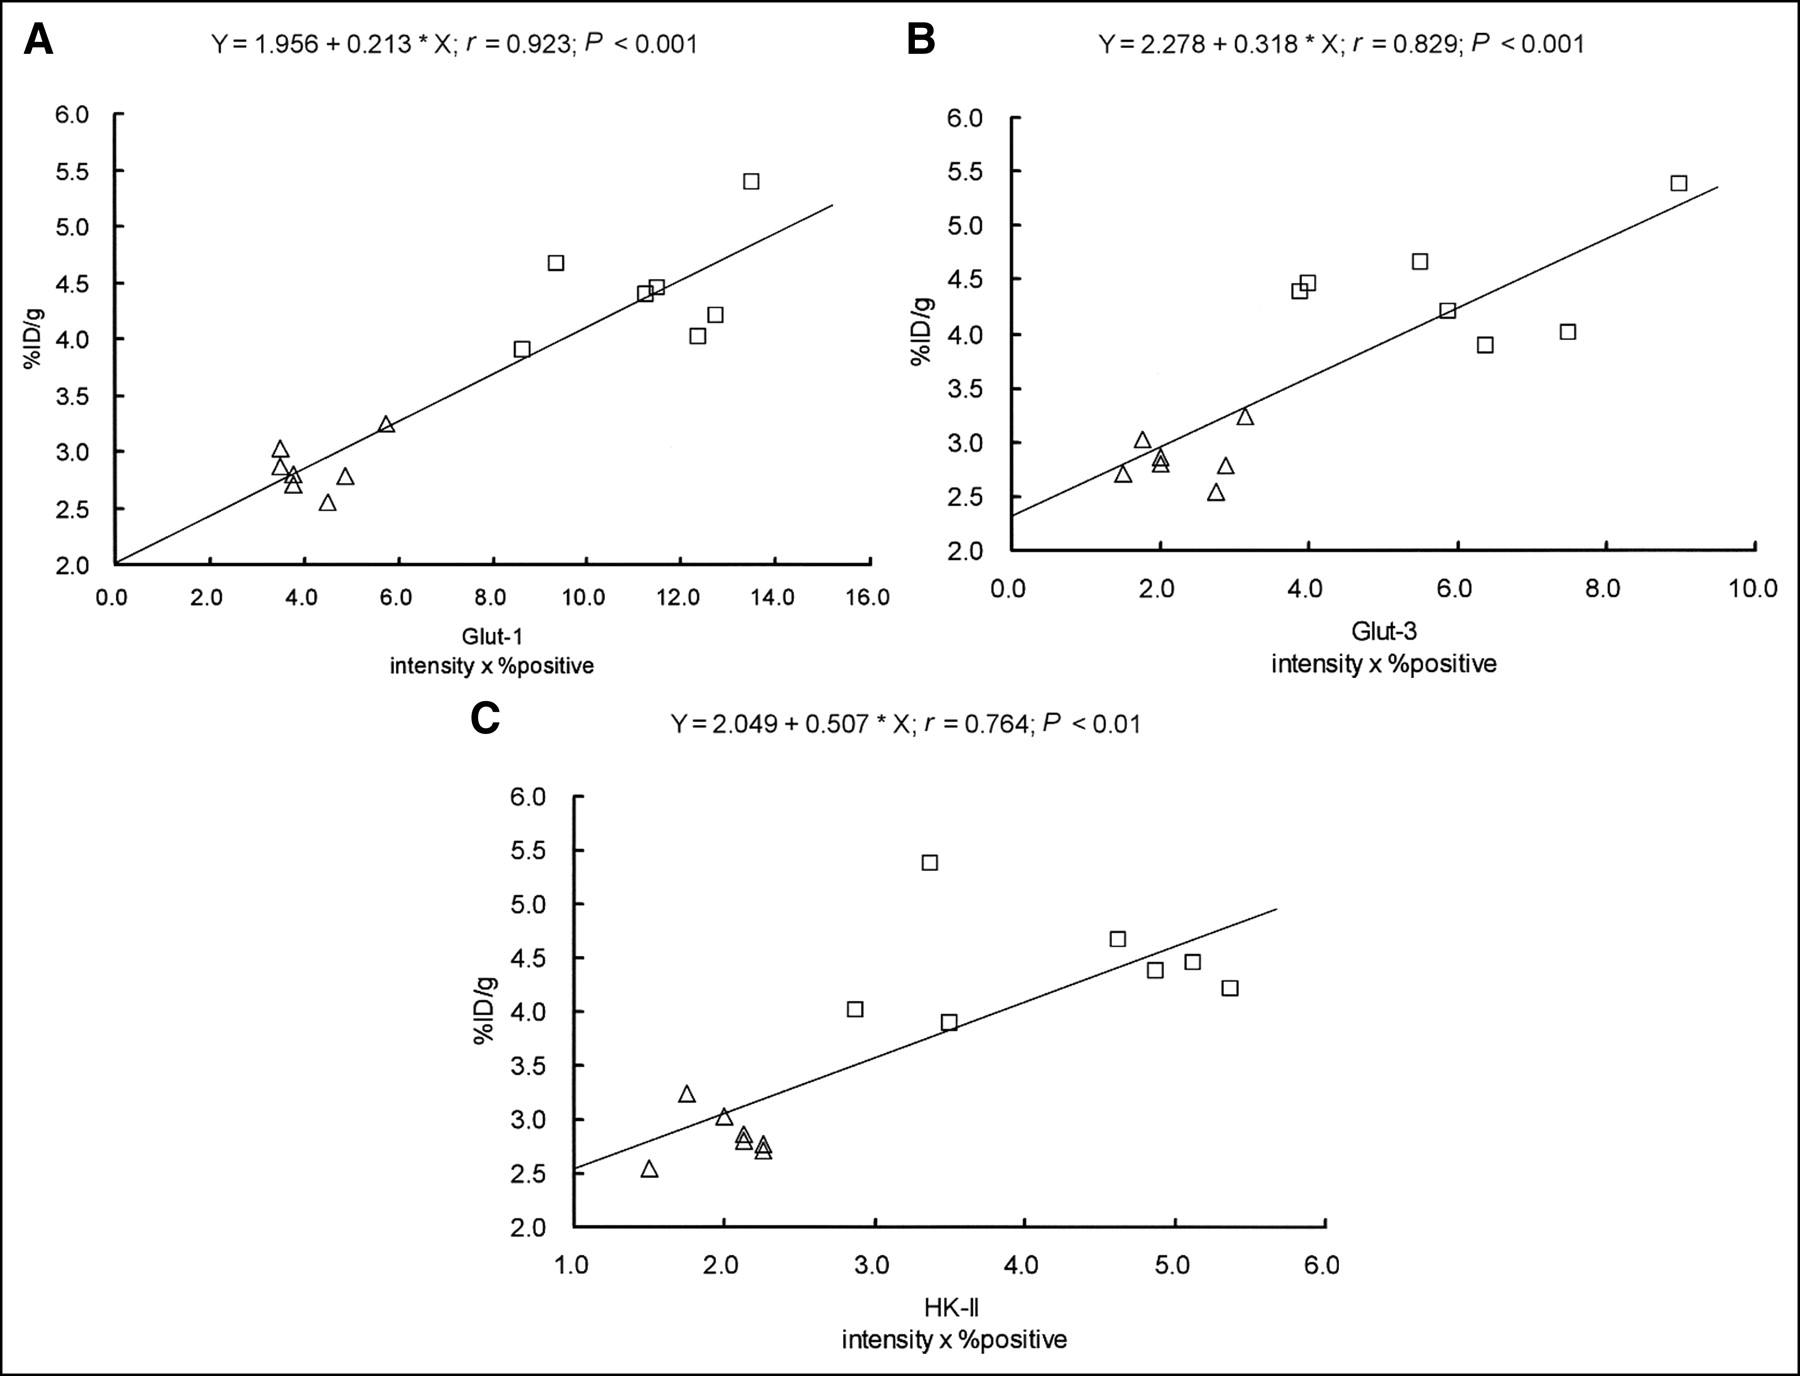
Relationships between expression levels of Glut-1, Glut-3, and HK-II and intratumoral 18F-FDG accumulation in KDH-8 tumor tissues. Intratumoral 18F-FDG accumulation significantly correlated with expression levels of Glut-1, Glut-3, and HK-II (intensity × % positive). (A) Relationship between 18F-FDG accumulation and histochemical grading score for Glut-1. (B) Relationship between 18F-FDG accumulation and histochemical grading score for Glut-3. (C) Relationship between 18F-FDG accumulation and histochemical grading score for HK-II. □, CT region; ▵, PT region.
DISCUSSION
In this study, a relatively higher 18F-FDG accumulation was observed in the CT regions, with elevated expression levels of Glut-1, Glut-3, and HK-II. Positive staining of HIF-1α was observed in these regions. Intratumoral 18F-FDG distribution significantly correlated with the expression levels of Glut-1, Glut-3, and HK-II. Consequently, the regional expression levels of Glut-1, Glut-3, and HK-II may increase in a hypoxic environment within tumor tissues and may contribute to heterogeneous 18F-FDG distribution in the tumor tissues.
Although intratumoral heterogeneity in 18F-FDG distribution has been demonstrated (15), there have been few reports with regard to the biologic mechanisms involved in the intratumoral heterogeneous distribution of 18F-FDG. The present results showed a significant correlation between the intratumoral distribution of 18F-FDG and the regional expression level of Glut-1, which is consistent with the results of syngeneic rat mammary cancer reported by Brown et al. (30). In addition, our results demonstrated—to our knowledge, for the first time—that intratumoral 18F-FDG distribution significantly correlates with the regional expression levels of Glut-3 and HK-II. The heterogeneity in 18F-FDG distribution may be ascribed to the altered expression levels of Glut-1, Glut-3, and HK-II and may reflect a metabolic microenvironment of tumors.
Aggressive tumors often have insufficient blood supply. Hypoxia occurs in tissue that is >100–200 μm away from a functional blood supply. When the tumors are exposed to a hypoxic environment, HIF-1α is activated to promote the transcription of several genes, including glucose transporters and glycolytic enzymes (31). The increased uptake of 3H-FDG in vitro by hypoxic tumor cells has been well demonstrated (32). Recently, Dearling et al. (33) have extended the previous in vitro work and confirmed the selectivity of 18F-FDG for hypoxic regions over normoxic regions in vivo. In the present study, a relatively higher 18F-FDG accumulation was observed in the CT region, with elevated expression levels of Glut-1, Glut-3, and HK-II. The positive staining of HIF-1α was observed in these regions. Taken altogether, the regional expression levels of Glut-1, Glut-3, and HK-II may be increased by HIF-1α in a hypoxic environment within the tumor tissue and may contribute to the elevated 18F-FDG accumulation.
Several studies have focused on the expression of Gluts and hexokinase activity to define the role of these proteins in the regulation of 18F-FDG accumulation (34,35). Elevated expression levels of Glut-1 and Glut-3 are considered to be factors that contribute to the accumulation of 18F-FDG in malignant tumors (9–13,23,28). It has also been suggested that the activity level of HK-II contributes to 18F-FDG accumulation in various malignant tumors (14). Chromatographic, polyclonal antibody, and amino acid analyses indicated that rat hepatoma hexokinase is most closely related to HK-II and suggests that mitochondrial hexokinase activity determines the rate of accumulation of 18F-FDG in tumors (36). These studies, however, used PET or tissue-counting techniques and correlated average 18F-FDG accumulation in the tumor with protein expression. The biologic mechanisms involved in intratumoral heterogeneity in 18F-FDG distribution have not been fully investigated. The present results demonstrate that the expression levels of Glut-1, Glut-3, and HK-II also contribute to intratumoral heterogeneity in 18F-FDG distribution in our model rats, as determined using an ARG technique. It is crucial to consider the relative contributions of Glut-1, Glut-3, and HK-II to intratumoral 18F-FDG accumulation. Unfortunately, we could not determine the relative contributions of these proteins, mainly due to the limited number of samples used in this study. Further studies are required to clarify the respective contributions of glucose transporters and hexokinase to intratumoral heterogeneity in 18F-FDG accumulation.
Intratumoral 18F-FDG distribution has been described at the cellular level by several investigators (15–20). Kubota et al. showed that 18F-FDG preferentially accumulates in macrophages and young granulation tissues surrounding necrotic foci rather than in tumor cells using a malignant tumor mouse model (15). In contrast, Brown et al. (17) observed relatively less 3H-FDG accumulation in necrotic/inflammatory infiltration compared with that in the tumor cells. Our results in rats confirmed intratumoral heterogeneity in 18F-FDG distribution. The 18F-FDG accumulation in the CT regions was 1.6 and 2.3 times higher than those in the PT and NA regions, respectively. Our results are consistent with the results reported by Brown et al.
In this study, the regions of viable tumor tissues and NA regions in ARG were identified using the HE-stained sections as reference. Apoptosis was most reliably assayed by morphologic counts using HE staining. Since there are some apoptotic cancer cells interwoven in necrotic regions and it was difficult to clearly distinguish apoptotic cells from necrotic cells in the present study, the term NA regions is used. Viable tumor cells and necrotic/apoptotic cells were also interwoven; thus, we used relatively small ROIs to clearly divide the regions between the viable tumor cells and necrotic/apoptotic cells. The larger ROIs appeared to cover both of the viable tumor cells and necrotic/apoptotic cells. Brown et al. (17) also used such ROI analysis to evaluate intratumoral distribution of 18F-FDG. On the other hand, because necrotic cells revealed cell injuries in morphology—such as the cell membrane appearing ruptured, the nuclear chromatin being markedly condensed or pyknotic, vesicular structures filling the cytoplasm, and fusion of organelles (37)—the immunohistochemical staining of Glut-1, Glut-3, and HK-II cannot reflect the antigenicity of cells. Therefore, the expression levels of Glut-1, Glut-3, and HK-II were not investigated by immunostaining and semiquantitative evaluation in the NA regions. The slices immunohistochemically stained for Glut-1, Glut-3, and HK-II were from the formalin-fixed, paraffin-embedded specimens, but those used in ARG imaging to determine regional 18F-FDG distribution were from the frozen samples. Thus, selected areas in the immunohistochemical staining for Glut-1, Glut-3, and HK-II of the CT, PT, and NA regions were not exactly congruent with those for determining regional 18F-FDG distribution on ARG imaging, although both formalin-fixed, paraffin-embedded specimens and frozen samples were adjacent. It is important to note that expression of Glut-1, Glut-3, and hexokinase II (as determined in this study) does not generally imply increased functional activity. Several studies have demonstrated that hexokinase bound to the mitochondrial membrane has a much higher catalytic activity than cytosolic hexokinase. Aloj et al. (14) have also indicated that 18F-FDG uptake correlates better with 18F-FDG phosphorylating activity of mitochondrial preparations than with the level of expression of the Glut-1 or hexokinase I or II genes. The excellent correlation between HK-II expression and 18F-FDG uptake observed in the present study may not be representative for other tumor models.
In our study, ARG imaging was performed 1 h after 18F-FDG injection. The 1-h time point is widely used also in rodent models, and no significant differences in the 18F-FDG uptake were observed in the mouse tumor tissues between 1 and 2 h after 18F-FDG injection (33). However, further studies at more than one time point are needed to give an indication of the time course of 18F-FDG uptake and to compare with the present results in rodent-bearing xenografts.
18F-FDG PET has become increasingly important not only for detecting and staging malignant tumors but also for monitoring therapy response and for differentiating malignant lesions from benign lesions (1–4). However, variable tumor accumulation of 18F-FDG has been indicated to prevent accurate diagnosis by 18F-FDG PET (38,39). Intratumoral heterogeneity in 18F-FDG distribution may also affect such diagnostic accuracy. The present study provides a biologic basis of intratumoral heterogeneity in 18F-FDG distribution, which leads to better understanding of the mechanism of 18F-FDG accumulation in tumors and contributes to the accurate diagnosis of patients with malignant tumors by 18F-FDG PET. On the other hand, recent advances in radiation therapy such as intensity-modulated radiation therapy have exploited new areas for the use of 18F-FDG PET (40). Regions of high 18F-FDG uptake can be treated with a higher radiation dose compared with a hypometabolic portion of the same mass. In addition, glucose transporters (Glut-1 and Glut-3) and glycolytic enzymes (for example, hexokinase) are promoted by activated HIF-1α (31). The present study showed an excellent correlation between regional 18F-FDG uptake and the expression of facilitative glucose transporters (Glut-1 and Glut-3) and HK-II. Furthermore, this study found that 18F-FDG uptake was more intense in tumor regions that express HIF-1α. Recent clinical data indicate that hypoxic tumors are known to be more malignant, to be more likely to metastasize, and to have a poor prognosis. HIF-1α is considered to be a key factor for tumor progression by upregulating genes involved in angiogenesis, cell survival, cell invasion, and resistance to drug therapy and radiotherapy. Thus, the findings of this study suggest that tumor areas with high 18F-FDG uptake may represent biologically more aggressive cancer cells. This has important consequences for the use of 18F-FDG PET for treatment planning—particularly, intensity-modulated radiation therapy. 18F-FDG PET could help to identify regions for dose-escalation protocols. We believe that our data also provide useful information in a precision radiation therapy protocol with modern radiotherapy modalities.
CONCLUSION
The colocalization of a high 18F-FDG level and Glut-1, Glut-3, and HK-II overexpression in regions that are likely to be subjected to hypoxia as well as the strong correlation between the transporters and HK-II expression and 18F-FDG accumulation suggest that enhanced transmembrane transport and phosphorylation may be part of an adaptive mechanism triggered by changes in the metabolic microenvironment of cancer cells. The regional expression levels of Glut-1, Glut-3, and HK-II may increase in a hypoxic environment within tumor tissues and may contribute to intratumoral heterogeneous 18F-FDG distribution. The present results lead to a better understanding of the mechanism of 18F-FDG accumulation in tumors, which may help in interpreting 18F-FDG accumulation in patients with malignant tumors.
Acknowledgments
This work was supported in part by a grant-in-aid for Scientific Research from the Japan Society for the Promotion of Science and in part by the Japanese Ministry of Education, Culture, Sports, Science and Technology and by a grant from the Rotary Yoneyama Memorial Foundation, Inc. The authors are grateful to the staff of the Nuclear Medicine and Central Institute of Isotope Science, Hokkaido University, for supporting this work. We also thank Mr. Kenichi Nishijima for technical assistance.
Footnotes
Received Sep. 3, 2004; revision accepted Nov. 23, 2004.
For correspondence or reprints contact: Nagara Tamaki, MD, Department of Nuclear Medicine, Graduate School of Medicine, Hokkaido University, Kita 15 Nishi 7, Kita-ku, Sapporo 060-8638, Japan.
E-mail: natamaki{at}med.hokudai.ac.jp
REFERENCES
In this issue


Jump to section
Related Articles
Cited By...
- Is PET Radiomics Useful to Predict Pathologic Tumor Response and Prognosis in Locally Advanced Cervical Cancer?
- Lactic Acid Accumulation in the Tumor Microenvironment Suppresses 18F-FDG Uptake
- Prognostic Impact of [18F]Fluorodeoxyglucose Positron Emission Tomography Scanning in the Era of Molecular Oncology
- Imaging the inflammatory activity of sarcoidosis
- Specific biomarkers of receptors, pathways of inhibition and targeted therapies: clinical applications
- Hypoxia But Not Inflammation Augments Glucose Uptake in Human Macrophages: Implications for Imaging Atherosclerosis With 18Fluorine-Labeled 2-Deoxy-D-Glucose Positron Emission Tomography
- High 18F-FDG Uptake in Microscopic Peritoneal Tumors Requires Physiologic Hypoxia
- Prognostic Implication of Dual-Phase PET in Adenocarcinoma of the Lung
- 18F-FDG Uptake in Lung, Breast, and Colon Cancers: Molecular Biology Correlates and Disease Characterization
- A New PET Scanner with Semiconductor Detectors Enables Better Identification of Intratumoral Inhomogeneity
- 18F-FDG PET Findings and GLUT-1 Expression in IPMNs of the Pancreas
- Intratumoral Metabolic Heterogeneity of Cervical Cancer
- Causes and Consequences of Increased Glucose Metabolism of Cancers
- In vivo imaging of molecular targets and their function in endocrinology
- Assessing Tumor Hypoxia in Cervical Cancer by PET with 60Cu-Labeled Diacetyl-Bis(N4-Methylthiosemicarbazone)
- Combining Radioimmunotherapy with Antihypoxia Therapy 2-Deoxy-D-Glucose Results in Reduction of Therapeutic Efficacy
- Hypoxia in head and neck cancer
- In Vitro Studies on the Signal Transduction of Thyroidal Uptake of 18F-FDG and 131I-Iodide
- High WT1 Expression Is Associated with Very Poor Survival of Patients with Osteogenic Sarcoma Metastasis.