


Abstract
Serotonin 1A receptors have been implicated in a variety of conditions including depression, suicidal behavior, and aggression. Dose estimates for current human studies are based on data from rat dosimetry studies. We report the biodistribution and dosimetry of the PET serotonin 1A antagonist 11C-WAY100,635 in humans. Methods: PET studies of 6 healthy human volunteers (3 male, 3 female) were acquired after a bolus injection of 11C-WAY100,635. Transmission scans of 3.5 min were obtained at each bed position before injection, and emission scans then were collected in 2-dimensional mode over 8 bed positions. Regions of interest were drawn around the brain, left and right lungs, heart, liver, stomach wall, gallbladder, left and right kidneys, spleen, and urinary bladder. Because no fluid was removed from the subjects, whole-body radioactivity was calculated using the injected dose and a calibration factor determined from a cylinder phantom. The area under the curve for each region of interest was determined by trapezoidal integration of the first 3 points, with subsequent points fit by a decreasing monoexponential. The area under the curve was then divided by counts in the whole body, and the resulting residence times were entered into the MIRDOSE3 program. Results: Primary elimination was via kidneys to the urinary bladder. There were no sex differences in organ residence times. The urinary bladder wall was the organ with the highest estimated radiation dose (1.94 × 10⁻¹ ± 3.57 × 10⁻² mGy/MBq). Except for the kidney and bladder wall, correlation was good between human dosimetry estimates and estimates reported previously from rats. The human dosimetry was 6.6 and 60.6 times higher in the kidneys and urinary bladder wall, respectively, than estimates from rats. Conclusion: The urinary bladder wall is the critical organ for 11C-WAY100,635 in humans. In the United States, according to Radioactive Drug Research Committee guidelines a single dose cannot exceed 300 MBq in a man and 227 MBq in a woman, with up to 3 such injections permitted per annum.
WAY100,635 (N-(2-(4-(2-methoxyphenyl)-1-piperazinyl)ethyl)-N-(2-pyridinyl) cyclohexane carboxamide) is a serotonin 1A antagonist with high affinity and selectivity for serotonin 1A receptors (dissociation constant = 0.1–0.4 nmol/L) (1,2). In clinical and basic science studies, the distribution and quantity of serotonin 1A receptors have been measured using the 11C-WAY100,635 radioligand with PET (3–13). To date, the acceptable radiation dose in humans has been estimated by extrapolation from dosimetry data from rats, without support for this extrapolation from empiric data. Therefore, we determined radiation dose estimates from data gathered from 6 (3 male and 3 female) healthy human volunteers.
MATERIALS AND METHODS
Subjects
Three male and 3 female healthy volunteers 29.5 ± 13.0 y old (mean ± SD) gave written informed consent after receiving an explanation of the study. Male subjects were 180.3 ± 4.4 cm tall and weighed 84.1 ± 7.6 kg. Female subjects were 167.6 ± 6.7 cm tall and weighed 55.8 ± 5.5 kg. These heights and weights are close to the values used in the MIRDOSE models, 174 cm and 73 kg for men and 164 cm and 57 kg for women. The protocol was approved by the Institutional Review Boards of Columbia Presbyterian Medical Center and New York State Psychiatric Institute. All subjects were free of medical illness as assessed by history, physical examination, and standard laboratory tests.
Radiochemistry
Preparation of 11C-WAY100,635 was as described previously (9).
PET Imaging Procedure
An ECAT ACCEL PET scanner (CPS) was used to image the body from the level of the head to the level of the lower thigh (hereafter referred to as whole body). Before injection, subjects were asked to void their bladders and then a transmission scan was obtained using 3 68Ge rod sources (each approximately 100 MBq) with stay times of 3.5 min/bed position using 8 bed positions for a total axial length of 110.6 cm. Five whole-body emission scans (frames) were acquired in 2-dimensional (2D) mode after intravenous bolus injection of 243 ± 43 MBq of 11C-WAY100,635, with a specific activity of 140 ± 35 MBq/nmol, in the right antecubital fossa. Each frame covered the same 110.6 cm (8 bed positions) as the transmission scan. Frames increased in duration to compensate for the 20-min half-life of 11C. Fifteen seconds were allowed between bed positions and 4 min between frames, resulting in the following frames: frame 1, 30 s/bed position (0–6 min); frame 2, 30 s/bed position (10–16 min); frame 3, 1 min/bed position (21–30 min); frame 4, 2 min/bed position (36–52 min); and frame 5, 3 min/bed position (59–72 min). The total duration of transmission and emission scanning was approximately 110 min.
PET Reconstruction and Image Analysis
The 2D whole-body emission scans were reconstructed using ordered-subsets expectation maximization (14) with 2 iterations and 8 subsets and employing attenuation and scatter corrections as implemented in ECAT 7.2.2 (CPS). Attenuation correction using the transmission scan and scatter correction was done using model-based scatter correction (15). A postreconstruction gaussian filter with a kernel of 4 mm in full width at half maximum was then applied to the image. The resulting image was 128 × 128 × 335 voxels, with each voxel being 3.4 mm3 (zoom = 1.5).
Determination of 11C Calibration Factor
The ACCEL scanner at the Kreitchman PET Center (accredited by the American College of Radiology) is calibrated daily, using a 68Ge cylindric source certified by the manufacturer. The dose calibrator applied to these human studies is also tested daily with a 137Cs source and is calibrated in accordance with article 175 of the New York City Bureau of Radiologic Health. To accurately convert between the 11C dose measured in the dose calibrator and the ACCEL calibration, a cylindric phantom (outer diameter = 21 cm, length = 22 cm) was injected with 158 MBq of an 11C solution and imaged in the ACCEL scanner. Two bed positions were used to scan the entire cylinder in the field of view. Three consecutive emission scans were acquired in 2D mode. Four hours after emission, transmission scans (5 min/bed) were then acquired. Each emission scan was reconstructed using the same reconstruction protocol as for the human whole body. Each image was then decay corrected to the assay time of the 11C-solution measurement in the dose calibrator. A 3-dimensional region of interest (ROI) was drawn over the entire cylinder, and the total ACCEL counts were obtained. Hence, 1 Bq of 11C measured in the dose calibrator was equivalent to 0.66 Bq in our 68Ge-calibrated 2D ACCEL image.
Dosimetry
Images were transferred into the image analysis software Medx (Sensor Systems, Inc.). ROIs were drawn around the brain, liver, stomach wall, gallbladder, left and right kidneys, left and right lungs, heart, spleen, and urinary bladder. ROIs were drawn on as many transaxial slices (Fig. 1, bottom row) on which the structure could be distinctly identified. Medx creates 3-dimensional ROIs from the 2D ROIs drawn transaxially and projects them in the orthogonal slices (i.e., coronal projections displayed in Fig. 1, top row). Only structures that could be identified clearly on all scans were included for calculation of the dosimetry estimates. For each ROI, a scan that showed the selected organ more prominently than the adjacent organs was chosen as a template. The brain, lungs, heart, kidneys, and liver were drawn on the first frame. The stomach wall and spleen on the second frame, and the gallbladder on the fourth frame. The bladder was drawn on the fifth frame, on which it was the fullest. No other organs were visible near the bladder. The bladder ROI was formed by isointensity contours at 2.5% of the maximum bladder activity. The intensity of the displayed images was increased to the point at which organs could be seen clearly but would not overlap with adjacent organs. All ROIs were imposed on each scan to verify that organs did not overlap and that no region was missed (Fig. 1). The bed position of each organ was determined by noting the image slices it occupied. If an organ covered 2 bed positions, the organ ROI was split into 2 organ ROIs, one for each bed position. To obtain the time–activity curves used for dosimetry calculations, the activity of each organ ROI was decayed to the bed position mid time. As a result, the 11C decay correction done by the camera within a whole-body acquisition was reversed, and the 11C physical decay was not corrected in the time–activity curves. The absorbed radiation dose was calculated using the MIRD schema (16). The area under each time–activity curve was obtained using a trapezoidal integration (17) of the first 3 time–activity curve data points through the origin and an integration of an exponential curve  , where A = amplitude, k = half-life, and t = time, for the remaining 4 time–activity curve data points taken to infinity. Because no fluid was removed from the subject, the whole-body counts were calculated using the injected dose and the calibration factor determined from the 11C phantom. The ROI residence times were then calculated from the ratio of the area under the time–activity curve to infinity over the initial whole-body activity. If the organ was the union of 2 ROIs at adjacent bed positions, the overall organ residence time was the sum of the residence times for the 2 partial ROIs.

Representative whole-body scan of a woman after bolus injection of 11C-WAY100,635. Acquisitions from frame 1 (0–6 min) (A and E), frame 2 (10–16 min) (B and F), frame 3 (20–30 min) (C and G), and frame 5 (56–72 min) (D and H) in coronal (A–D) and transaxial (E–H) planes sometimes spanned 2 bed positions (D). Time–activity curves were obtained for each ROI at each bed position.
Activity in most organs was assumed to be uniformly distributed throughout those organs and treated in the standard way within the MIRD method. Activity observed in the stomach was believed to be located in stomach wall, not stomach contents. MIRDOSE3 has no provision for using stomach wall as a source organ. Therefore, we used stomach contents as the source organ for input and then corrected the MIRDOSE3-provided estimates of stomach wall dose by correcting for the assumed difference in the electron dose component. The photon and electron components were separated in the dose from stomach contents to stomach wall, and then the electron dose from stomach contents to stomach wall was removed and the dose from stomach contents and stomach wall was added. The stomach contents–to–stomach wall electron dose component of the S value is the 11C Δ-value for all electrons (0.303 g-Gy/Bq-h) divided by twice the mass of the stomach contents (260 g in adults). The stomach wall–to–stomach wall electron dose component is the Δ-value divided by the mass of the stomach wall (158 g in adults) (18). 11C-WAY100,635 residence time in the rest of the body was obtained by subtracting the sum of all organ residence times from the reciprocal of the 11C decay constant (ln(2)/T1/2 = 0.49 h−1). This rest-of-body designation accounts for all activity outside the ROIs, including the injection site.
RESULTS
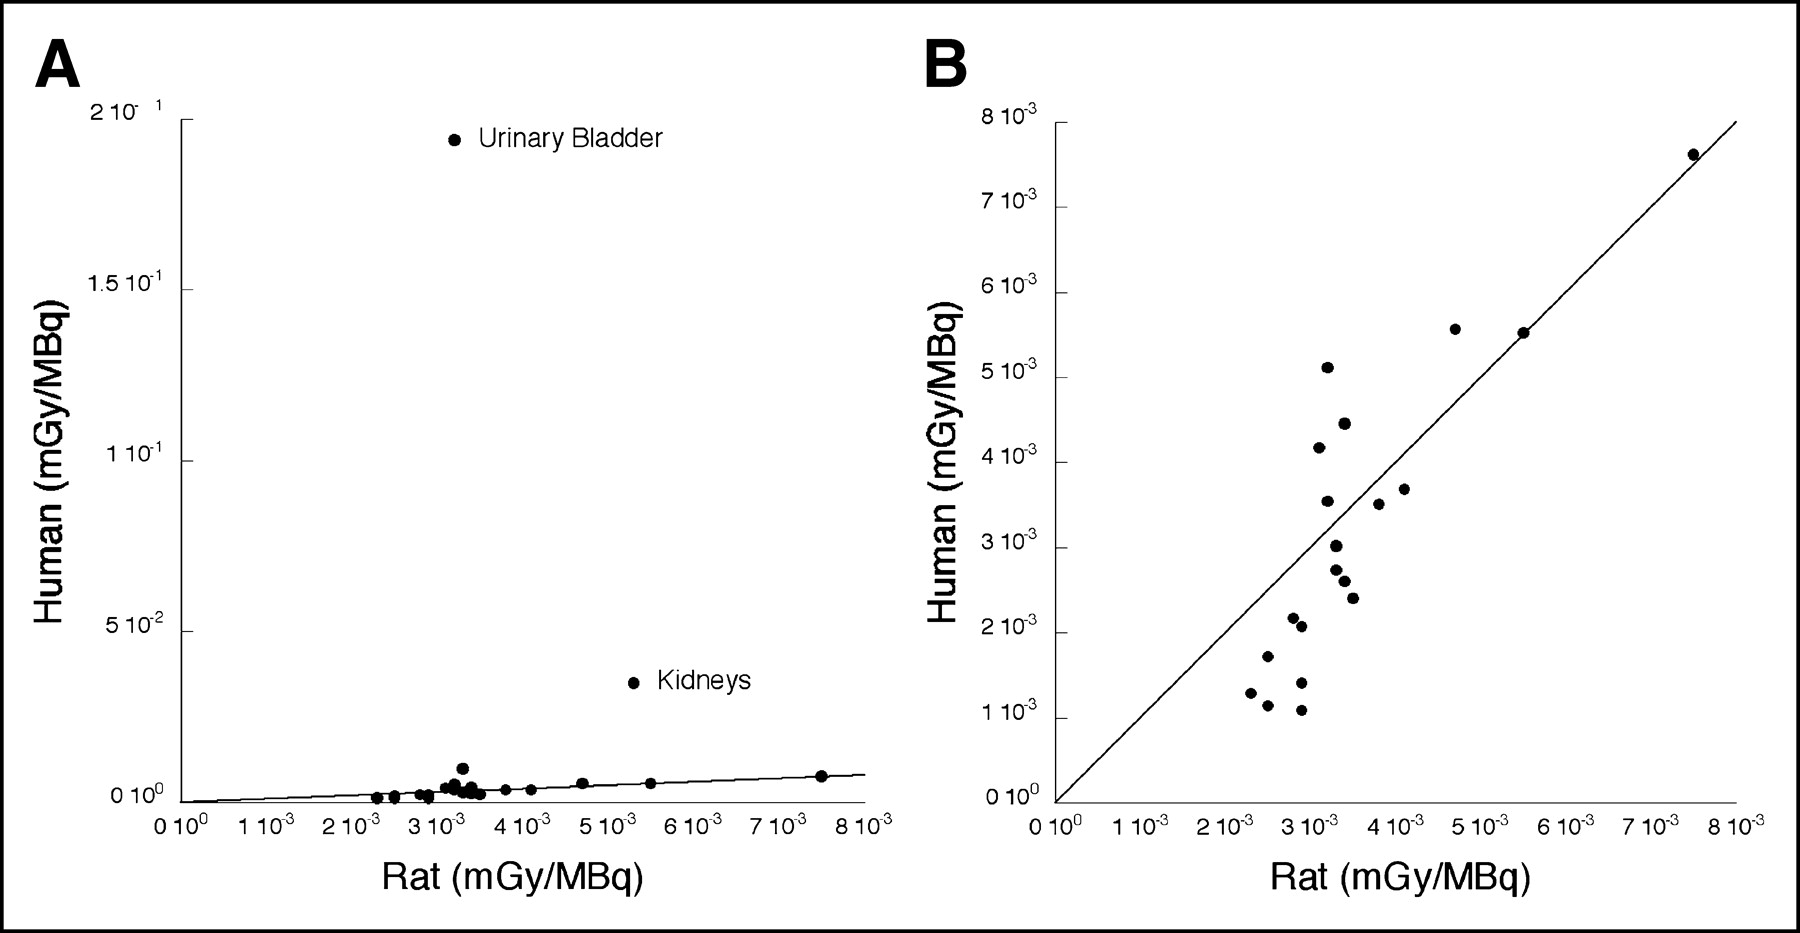
After injection of 11C-WAY100,635, several organs were clearly identifiable on the basis of anatomic location and expected radiotracer distribution from rat studies. These organs included gallbladder, stomach wall, brain, kidneys, liver, heart, lungs, spleen, and urinary bladder (Fig. 1). Other structures could not be identified clearly on all scans and hence were not included for calculation of the dosimetry estimates. Time–activity curves generated from selected regions are illustrated in Figure 2. After trapezoidal integration of the first 3 data points, the remaining area under the curve was well fit by a monoexponential decay function and calculated as the integral of the exponential functions from the fourth time point to infinity. The residence times are shown in Table 1 in descending order, with the gallbladder having the lowest residence time and the urinary bladder the highest residence time. Residence times did not differ between male and female subjects (Student t test, P > 0.05). Residence times were then used as input to the MIRDOSE3 program. Table 2 gives the dosimetry results for a 70-kg man and woman. The organ with the highest absorbed dose is the urinary bladder wall, and it is the critical organ. The human findings agree fairly well with data from rat studies (Chet Mathis, personal communication, 2002) in all organs except kidneys and urinary bladder. In the kidneys, the human dosimetry was 6.6 times higher and the urinary bladder wall 60.6 times higher than estimates from rats (Fig. 3).
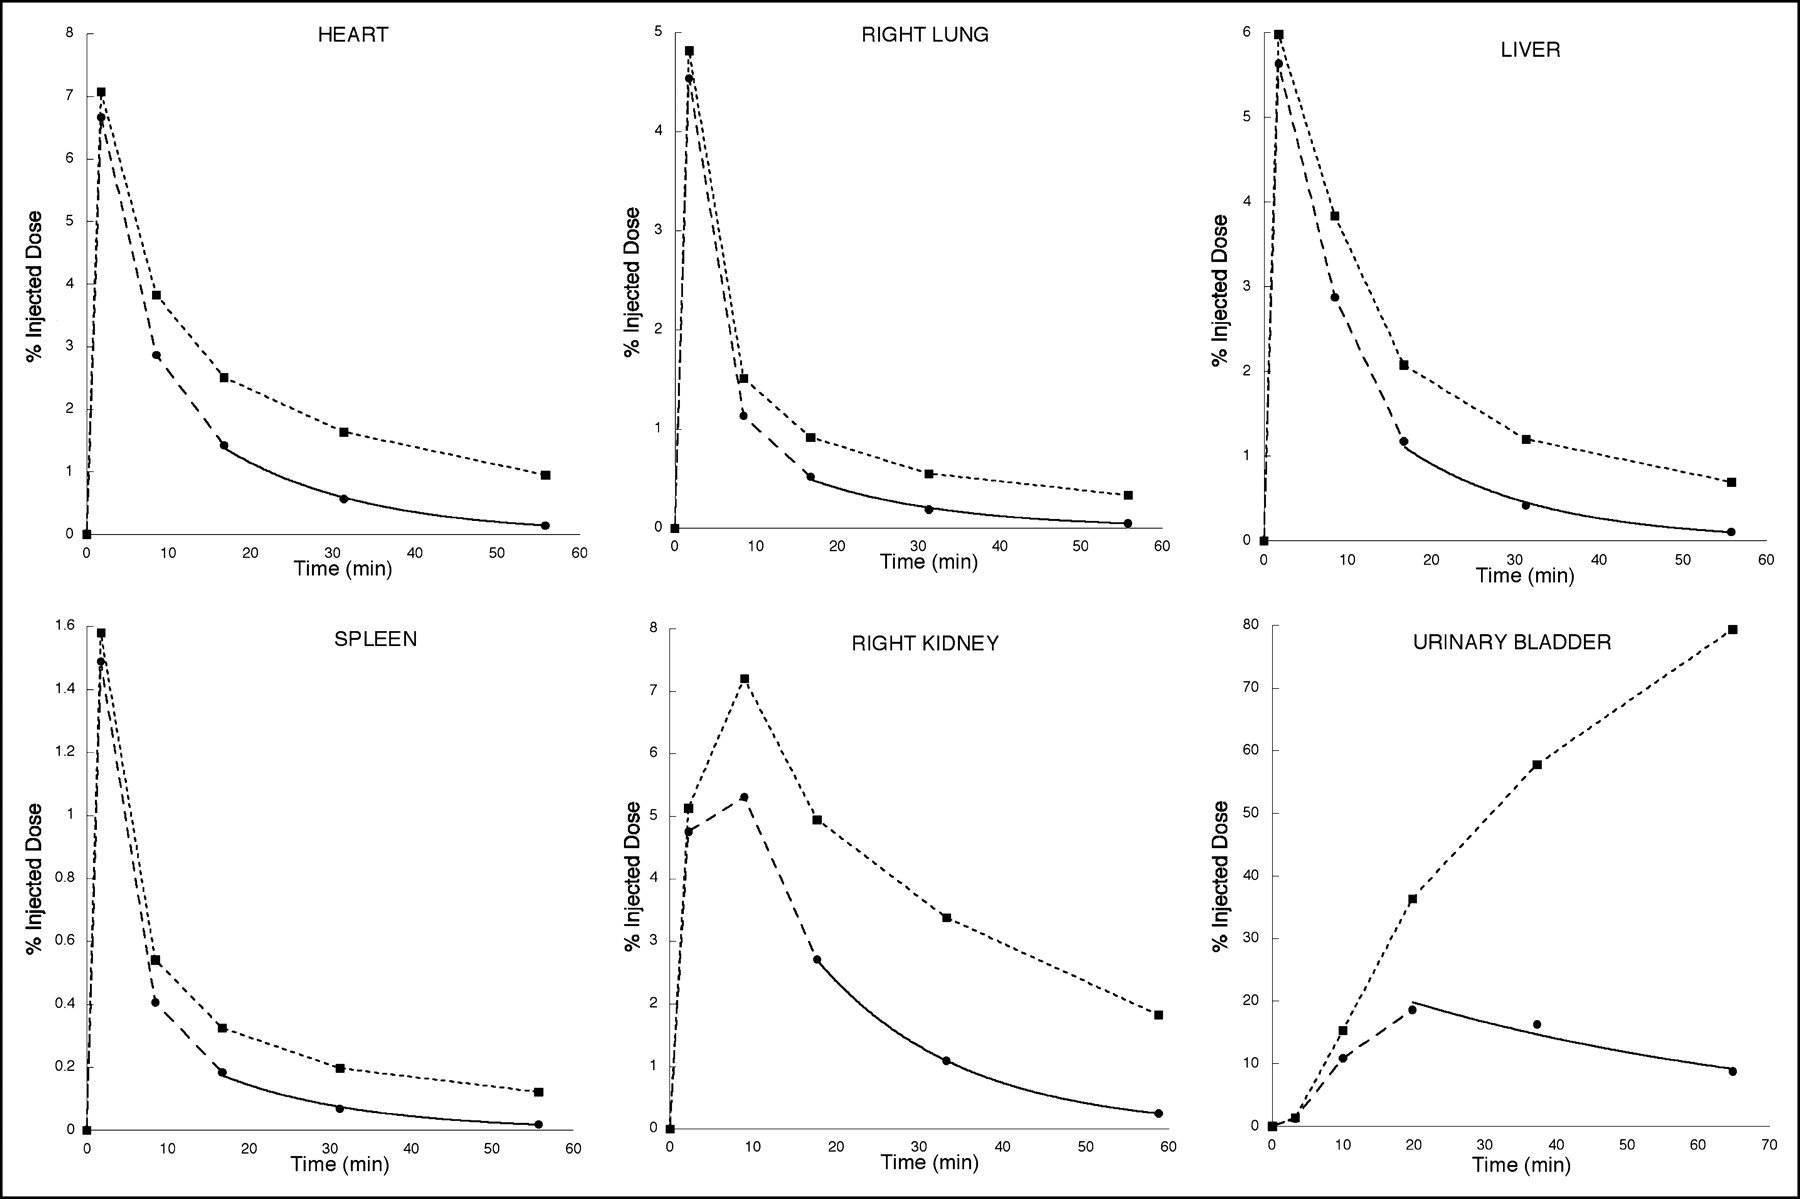
Time–activity curves generated from ROIs shown in Figure 1. Initial fast distribution of radiotracer throughout most of the body, with slower accumulation in kidneys, is followed by accumulation in urinary bladder, suggesting that major route of elimination is urinary system. Solid circles indicate activity in ROI as percentage of injected dose. Area under curve is determined by trapezoidal integration of first 3 time points through origin and integration of single exponential fit through final 3 time points. Time points are different in different organs as organs occupy different bed positions. Solid squares and dashed lines indicate decay-corrected time–activity curve.

Comparison of radiation dose estimate from in vivo human PET studies and ex vivo rat biodistribution and dosimetry studies with all data points (A) and without urinary bladder and kidneys (B). Solid line in both plots is identity.
Individual and Mean Residence Times for 11C-WAY100,635
Mean Radiation Absorbed Dose Estimates for 11C-WAY100,635
DISCUSSION
This work demonstrated that biodistribution and dosimetry studies of humans can be relatively simple and straightforward. The data suggest that the main route of elimination is the renal system, as little activity was detected in the intestinal tract whereas significant activity was noted first in the kidneys and then in the urinary bladder. Because studies on humans are not routinely done with urinary bladder catheterization, the urinary bladder will be the critical organ. Our estimation of bladder exposure would have been even higher if we had not reversed the automatic decay correction of this PET system. These human data disagree with the rat data, which suggest that the liver is the critical organ. Therefore, for this ligand, estimation of maximal allowable radiation exposure to humans from rat data may not currently be ideal.
Few human neuroreceptor PET dosimetry studies are available for comparison. With the serotonin transporter radioligand 11C-3-amino-4(2-dimethylaminomethyl-phenylsulfonyl)-benzonitrile, the organ with maximal radiation exposure is the lung, followed by the urinary bladder, kidneys, and gallbladder wall (19). The radiolabeled antidepressant 11C-mirtazapine, which has affinity for both the adrenoreceptors and the serotonin transporter, gives highest exposure to the lungs, followed by the adrenals, spleen, and gallbladder wall (20). The dopamine transporter ligand 2β-carbomethoxy-3β-(4-chlorophenyl)-8-(2-18F-fluoroethyl) nortropane gives highest exposure to the kidneys, lungs, and urinary bladder (21). A general trend observed from these studies is that the organs with the greatest calculated absorbed dose are either those with a large concentration of the radioligand target or those involved in elimination of the radioligand.
In the United States, the Radioactive Drug Research Committee limits the radiation received by research patients to 30 mSv per dose and 50 mSv per annum to the whole body, active blood-forming organs, gonads, and lens of the eye (10 Code of Federal Regulations 21, part 361). The Radioactive Drug Research Committee also limits the single dose to other organs to 50 mSv per dose and 150 mSv per annum (10 Code of Federal Regulations 21, part 361). In our dosimetry, the absorbed dose in urinary bladder limits the radioactivity in a single injection of 11C-WAY100,635 to 300 MBq in men and 227 MBq in women, with up to 3 such injections permitted per annum.
CONCLUSION
Dosimetry estimates cannot readily be extrapolated from rodents to humans without validation. Human dosimetry studies are a desirable component of the development of radiotracers for use in humans.
Acknowledgments
We thank the staff of the Kreitchman PET Center and the Brain Imaging Division of the Department of Neuroscience, in particular Mali Pratap and Kausar Ali, and we thank Dr. Chet Mathis for sharing the rat dosimetry data. This work was supported by grants MH62185, MH40695, and MH01997.
Footnotes
Received Jun. 30, 2004; revision accepted Nov. 17, 2004.
For correspondence or reprints contact: Ramin V. Parsey, MD, PhD, 1051 Riverside Dr., Box 42, New York, NY 10032.
E-mail: rparsey{at}neuron.cpmc.columbia.edu
REFERENCES
In this issue


Jump to section
Related Articles
Cited By...
- 11C Dosimetry Scans Should Be Abandoned
- Internal Dose Assessment of (-)-18F-Flubatine, Comparing Animal Model Datasets of Mice and Piglets with First-in-Human Results
- Dynamic PET Denoising with HYPR Processing
- 1-11C-Methyl-4-Piperidinyl-N-Butyrate Radiation Dosimetry in Humans by Dynamic Organ-Specific Evaluation
- Whole-Body Biodistribution and Estimation of Radiation-Absorbed Doses of the Dopamine D1 Receptor Radioligand 11C-NNC 112 in Humans