


Abstract
The optimal temporal sampling rate in electrocardiograph-gated myocardial SPECT is questionable: low rates, typically 8 frames per cardiac beat (8fr/cb), favor image quality, whereas high rates, typically 16 frames per cardiac beat (16fr/cb), favor the accuracy of left ventricular (LV) functional parameters. We examined whether Fourier temporal interpolation (FTI) from 8fr/cb to 16fr/cb can combine the advantages of low and high rates. Methods: In 34 patients imaged after stress injection of 99mTc-sestamibi, 4 sets of reconstructed gated slices were compared: a raw 16fr/cb acquisition (R16), a raw 8fr/cb acquisition (R8), a 16fr/cb set obtained by FTI of 8fr/cb projections (IP), and a 16fr/cb set obtained by FTI of 8fr/cb reconstructed slices (IS). LV ejection fraction (LVEF), end-diastolic volume (EDV), and end-systolic volume (ESV) obtained from the final LV volume curve were compared for the 4 datasets. Deviation of the whole LV volume curve was quantified for IP and IS with respect to R16. Image quality was evaluated by consensus reading of end-diastolic slices of the 4 sets. For R16, IP, and IS, cine display fluidity was quantified by a roughness index calculated from the LV volume curve. Results: No differences in EDVs or ESVs were found among R16, IP, and IS, whereas R8 gave smaller EDVs and larger ESVs. LVEF was lower with R8, IP, and IS than with R16: −3.9%, −1.2%, and −1.3%, respectively. The LV volume curve was closer to R16 with IP than with IS. Image quality was better with IP and IS than with R8 and better with R8 than with R16. Cine display fluidity was better with IP than with R16 and better with R16 than with IS. Conclusion: FTI improved image quality not only over that provided by R16 but even over that provided by R8. The sole worsened LV functional parameter was LVEF, which was slightly underestimated with respect to that estimated by R16. Of the 2 FTI variants, IP was superior to IS for cine display fluidity and accuracy of the LV volume curve with respect to the data obtained with R16. Therefore, FTI to 16fr/cb performed before reconstruction on a pixel-by-pixel basis on 8fr/cb projections improves image quality and cine display fluidity over those of both R8 and R16 acquisitions at the sole cost of a 1% underestimation of LVEF.
Although electrocardiograph-gated SPECT is a well-established method for the simultaneous analysis of myocardial perfusion and left ventricular (LV) function, the optimal temporal sampling rate still remains unclear. It has been shown that acquiring data at 16 frames per cardiac beat (16fr/cb) consistently gives a higher LV ejection fraction (LVEF) than does acquiring data at 8 frames per cardiac beat (8fr/cb) with various computation methods (1–5). To what extent this phenomenon is software dependent is not obvious (6,7). More generally, quantitative functional parameters derived from the LV volume curve have been shown to be better correlated with other cardiac imaging methods when high temporal sampling rates are used (2–4). Visual analysis of the beating slices is a cornerstone of gated SPECT interpretation, as pointed out by scientific recommendations (8). This technique involves the use of a color display to assess systolic thickening through count density changes or a gray scale with brightness saturation to assess myocardial wall motion; in both cases, it is obvious, at least theoretically, that the more frames per cardiac beat, the smoother the cine display can look and the more subtle image analysis can be. However, because scintigraphic images are based on radioactive counts, Poisson statistics apply: halving counts by doubling the number of frames per cardiac beat while keeping the same overall acquisition time mathematically increases the statistical fluctuation of counts by 41% and thus decreases image quality. Moreover, suboptimal count statistics can potentially mislead automatic myocardial contouring algorithms; low counts actually have been shown to decrease the reproducibility of LVEF quantitation (9,10).
Fourier interpolation of an 8fr/cb dataset to a 16fr/cb dataset could overcome some of the limitations of high sampling rates by preserving the statistical counting properties of low sampling rates. Such an interpolation can be performed either on projections, that is, before reconstruction, or on reconstructed slices.
This work was designed to evaluate quantitative (LV functional parameters) and qualitative (image quality) impacts of the 2 above-mentioned methods of Fourier temporal interpolation.
MATERIALS AND METHODS
Patients
Thirty-four patients referred for routine myocardial perfusion imaging were included. They were drawn from consecutive patients by use of 2 inclusion criteria: first, a regular sinus cardiac rhythm, and second, no obvious motion during acquisition. There were 23 males and 11 females. Stress was obtained by exercise in 15 cases, intravenous dipyridamole in 1 case, and combined dipyridamole and exercise in 18 cases. A summed defect score was calculated by use of a 17-segment model and a 5-point scoring system: 0–4, 24 cases; 5–8, 5 cases; and >8, 5 cases.
Acquisition Parameters
Doses of 740–1,110 MBq (20–30 mCi) of 99mTc-sestamibi were injected at stress according to body weight. Gated SPECT acquisition was started 70–90 min later by use of a dual-head camera (Forte; ADAC-Philips) with the heads at right angles; 32 projections were obtained over 180° in the supine position for 45 s each. A 20% width acceptance cycle length window was used to obtain 16fr/cb. The pixel size was 6.4 mm.
Data Reformatting and Reconstruction
The raw 16fr/cb acquisition projections were designated R16.
For each projection angle, gated images were summed 2 by 2 to obtain an 8fr/cb dataset, theoretically identical to what would have been obtained had acquisition been performed directly at this rate. This dataset was identified as R8.
The R8 projections were submitted on a pixel-by-pixel basis to a temporal Fourier analysis by use of 2 harmonics, and then 16 time points were calculated for each pixel to generate a 16fr/cb dataset of temporally interpolated projections, identified as IP.
The 3 projection sets, R16, R8, and IP, were reconstructed on a nuclear medicine computer (Pegasys; ADAC-Philips) by filtered backprojection with a Butterworth filter and a cutoff of 0.5 Nyquist frequency, that is, 0.39 cycle per centimeter, and an order of 5. The R8 transverse slices were submitted on a voxel-by-voxel basis to a temporal Fourier analysis by use of 2 harmonics, and then 16 time points were calculated for each voxel to generate a 16fr/cb dataset of temporally interpolated slices, identified as IS.
Thus, 4 series of gated slices were available for analysis and could be briefly summarized as follows: R16, raw 16fr/cb acquisition; R8, raw 8fr/cb acquisition; IP, 16fr/cb obtained from interpolated projections; and IS, 16fr/cb obtained from interpolated slices.
All 4 series were reoriented by use of an automatic software program followed, if necessary, by slight manual correction to keep the angles strictly identical and then were submitted to automatic contouring and volume computations with QGS software (Cedars-Sinai Medical Center) (1).
Analysis of Functional Parameters
For each of the 4 series, all of the individual LV volumes were listed, and the following parameters were extracted: end-diastolic (ED) volume (EDV), end-systolic volume (ESV), and ejection fraction (EF).
For the IP and IS series, the relative volume error for each of the 16 points with respect to the R16 values taken as a reference was calculated, and then the mean absolute value was expressed as a percentage and identified as the Av_Rel_Err.
Analysis of Image Quality
Because any experienced reader can easily distinguish 8fr/cb from 16fr/cb on a loop cine display of beating slices, it was not possible to use a cine display for “masked” analysis, although it would have been theoretically the most “correct” method. Two different and complementary approaches were used instead.
First, ED slices were presented as a classical 3-plane display of contiguous short-axis, vertical long-axis, and horizontal long-axis slices. Thus, for each patient, 4 color plates were generated and 2 readers scored ED image quality by consensus according to a 4-point scale closely derived from a previously described one (11): 0, very poor images—reliable interpretation is impossible; 1, poor images—reliable interpretation by experts only, not by junior readers; 2, average images—reliable interpretation by experts and junior readers; and 3, good or very good images—interpretation is reliable and easy.
The readers’ preferred color scale was used. The readers at this stage were unaware of the rationale for and of the design of the study, and color plates were labeled such that the patient’s name was the only clear information.
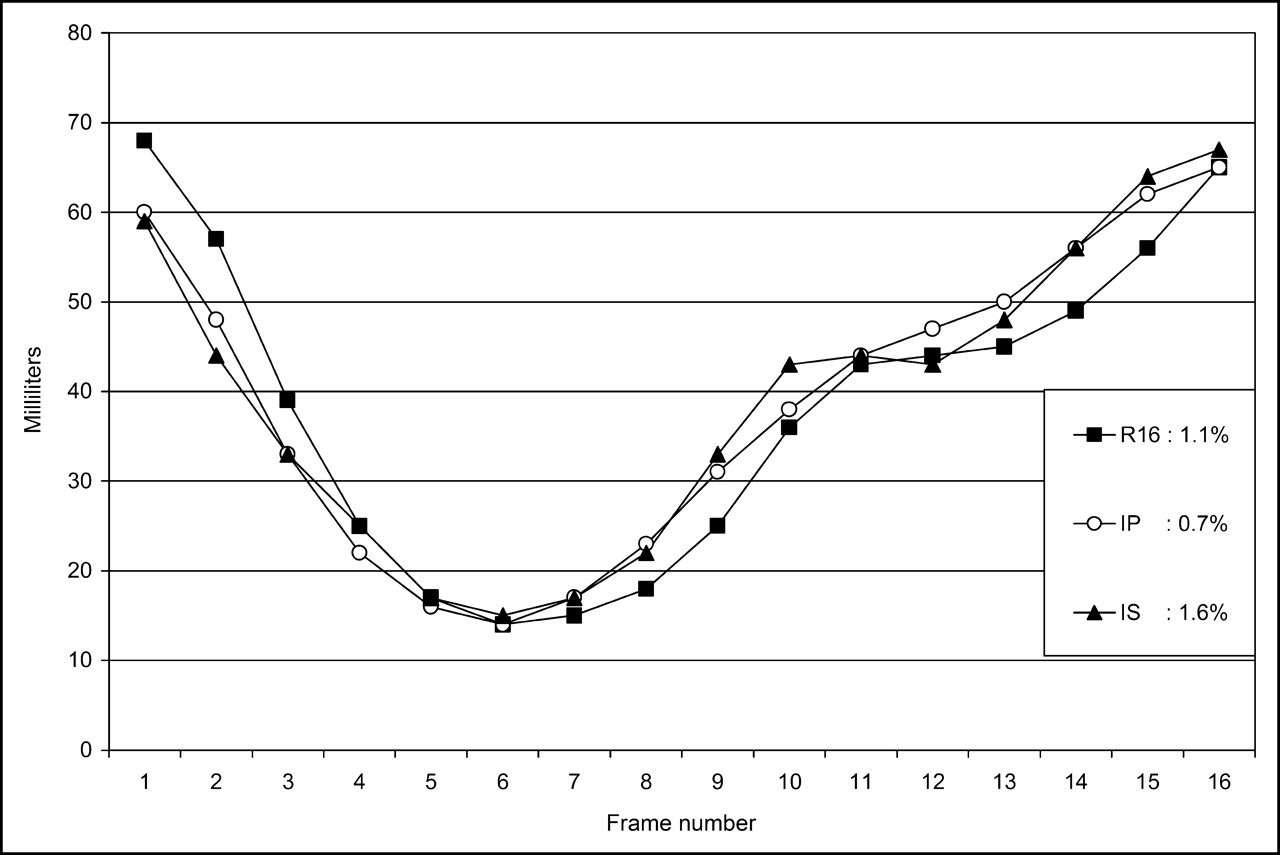
Second, to objectively quantify how smooth and easy to assess a cine display would have been, the cinematic fluidity was quantified by the following method (only R16, IP, and IS were considered). The 16-point volume curve was first smoothed by the Savitsky-Golay method (12) with a second-order polynomial model, a 5-point kernel, and cycling wraparound. Then, the absolute value of the relative deviation of the smoothed curve from the original one was calculated point by point and averaged over the 16 points, and the result was expressed as a percentage and identified as the Roughness_Index. The rationale behind the Roughness_Index is as follows: the smoother the original curve, the fewer changes induced by the Savitsky-Golay method and the lower the Roughness_Index. For a naturally very smooth curve, more precisely, for a curve for which each 5-consecutive-point subset (by use of cycling wraparound) strictly matches a second-order polynomial, the Roughness_Index would be 0. Figure 1 shows examples of various Roughness_Index values.

Examples of 3 volume curves obtained with R16, IP, and IS and their respective calculated Roughness_Index values.
Statistical Analysis
Global differences were analyzed by ANOVA, and 2-by-2 comparisons were made with the Bonferroni–Dunn test by use of Statview for Windows (Abacus Concept). The α-threshold was set at 0.05, a value that automatically leads to lower P significance thresholds for the Bonferroni–Dunn test. Results are expressed as mean ± SD, unless otherwise stated. Agreement between values was evaluated by Bland–Altman analysis (13).
RESULTS
Numeric results of analyses are shown in Table 1.
Numeric Results of Analyses*
Functional Parameters
Average values for EDV, ESV, and EF are graphically displayed in Figure 2. Bland–Altman analysis is shown in Table 2, and plots are displayed in Figure 3.

Graphic display of mean LV volumes and EF values obtained with 4 methods. See text for statistical significance.

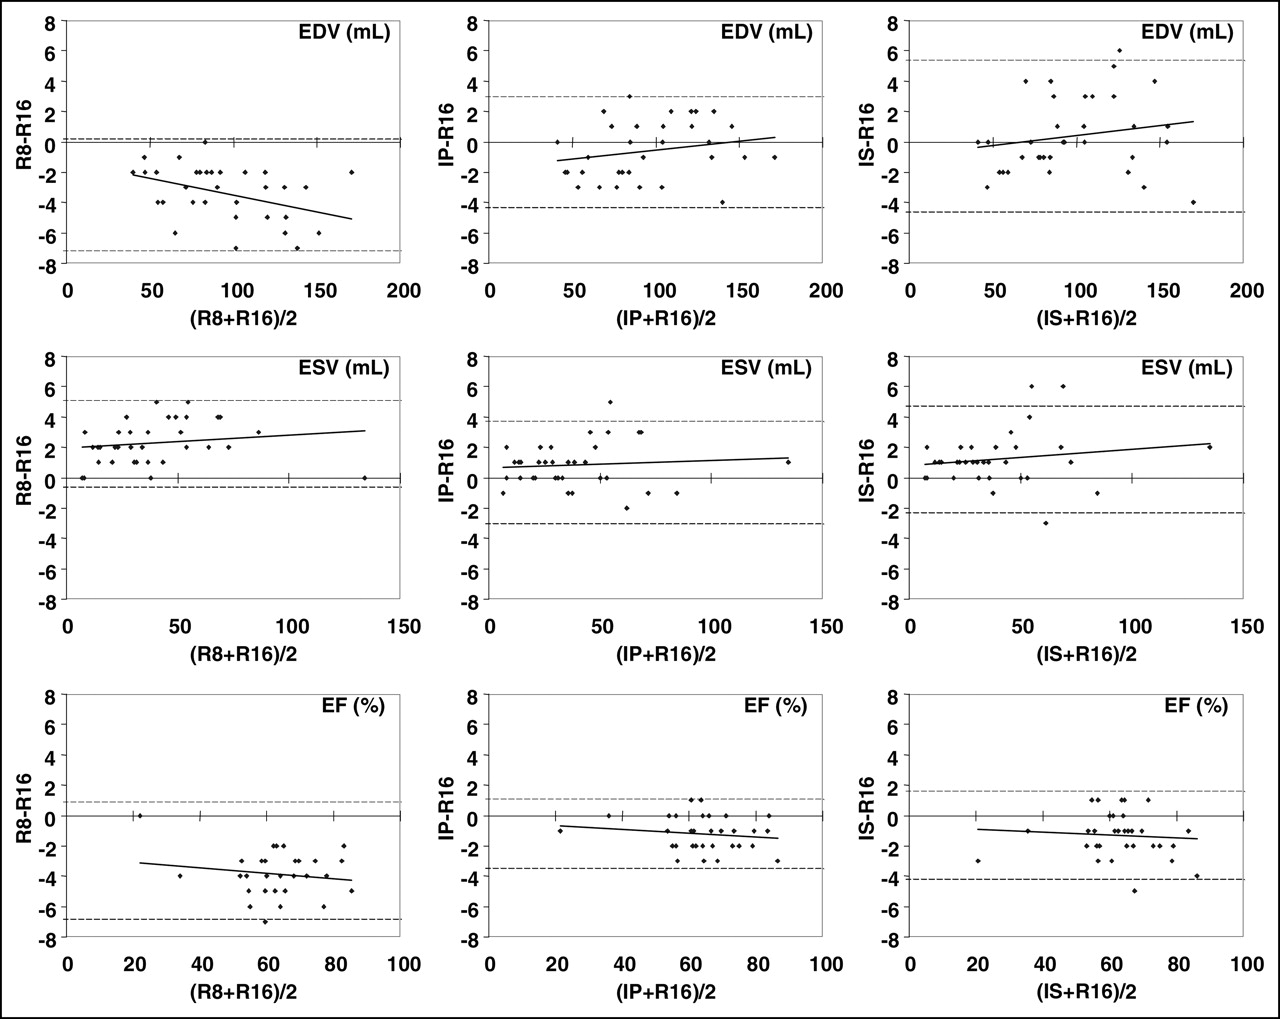
Bland–Altman plots evaluating agreement between R16 and, from left to right, R8, IP, and IS; from top to bottom, EDV, ESV, and EF. Dashed lines = 95% limits of agreement.
Bland–Altman Analysis of Agreement of R8, IP, and IS with R16
EDV was not significantly different among R16, IP, and IS, but the value with R8 was significantly smaller: −3.4 mL, that is, −3.5%. Bland–Altman analysis revealed a significant negative size-dependent trend for R8 − R16.
ESV was significantly larger with R8, IP, and IS than with R16: +2.3, +0.8, and +1.2 mL, respectively, that is, +5.8%, +2.1%, and +3.1%. Bland–Altman analysis revealed no significant size-dependent trend.
EF was significantly lower with R8, IP, and IS than with R16: −3.9%, −1.2%, and −1.3% (EF points), respectively, that is, −6.3%, −1.9%, and −2.0%. Bland–Altman analysis revealed no significant size-dependent trend.
Regarding the accuracy of the LV volume curve obtained with IP and IS compared with R16 as a reference, Av_Rel_Err was significantly smaller with IP than with IS; in other words, the IP volume curve was closer to the R16 one than the IS one.
Image Quality
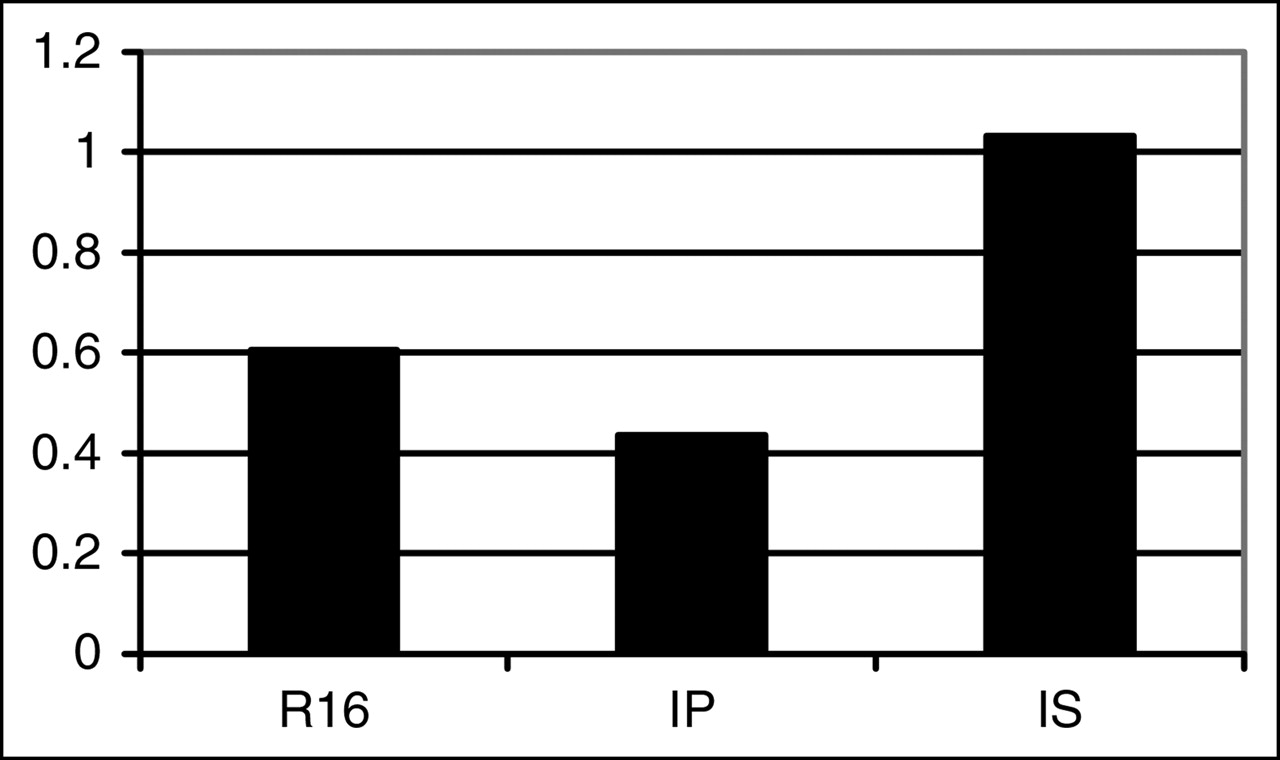
The image quality was significantly worse with R16 than with R8, and IP and IS were significantly the best methods (Table 1; Figs. 4 and 5). Recall that the image quality score was evaluated on static ED slice displays, whereas “dynamic” image quality was evaluated by use of the Roughness_Index of the volume curve; the latter was not calculated for R8 because an 8fr/cb cine display is obviously less smooth than a 16fr/cb one. The IP Roughness_Index was the lowest (i.e., IP gave the smoothest curve), the R16 value was slightly higher, and the IS value was even higher (Fig. 6); all of the differences were significant.
Mean image quality scores for 4 methods. All 2-by-2 differences were significant, except for those between IP and IS.

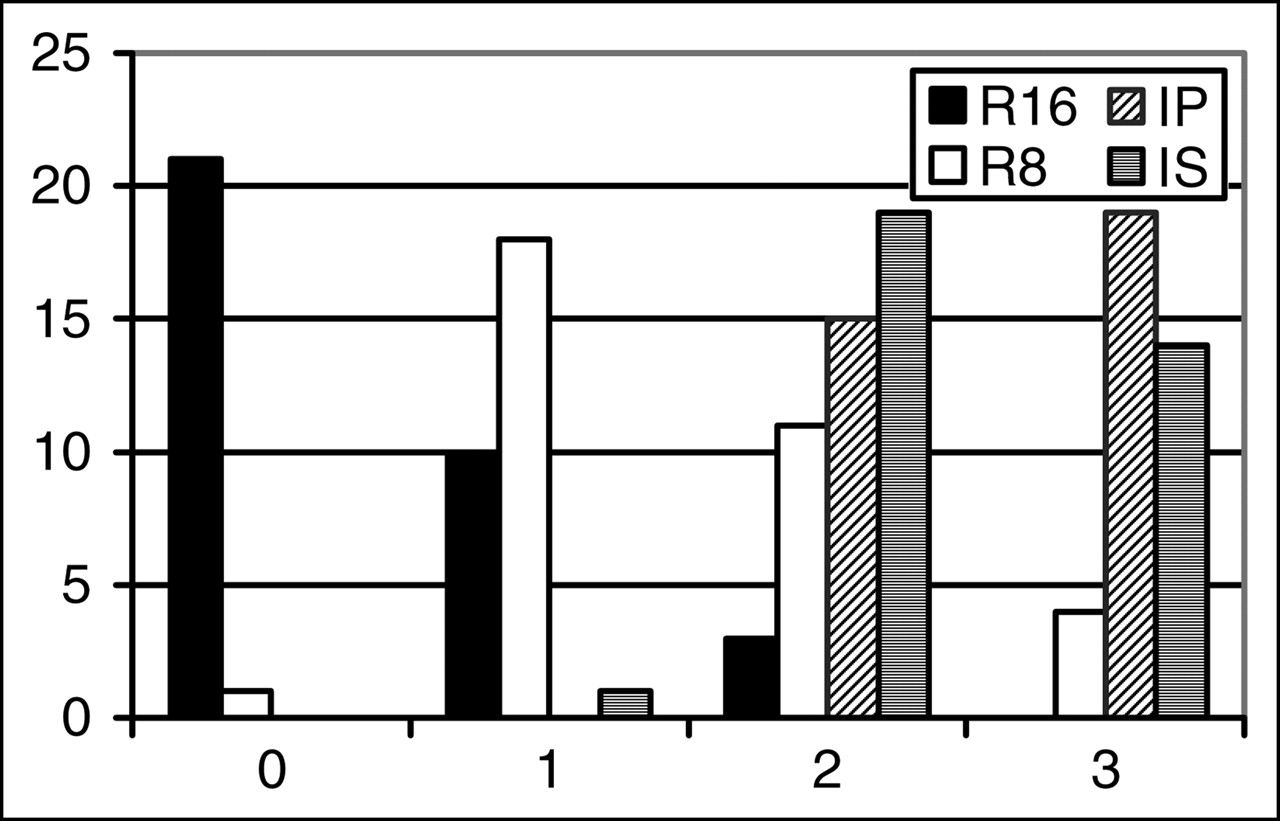
Image quality score profiles for 4 methods. Horizontal axis represents score, and vertical axis represents number of patients.

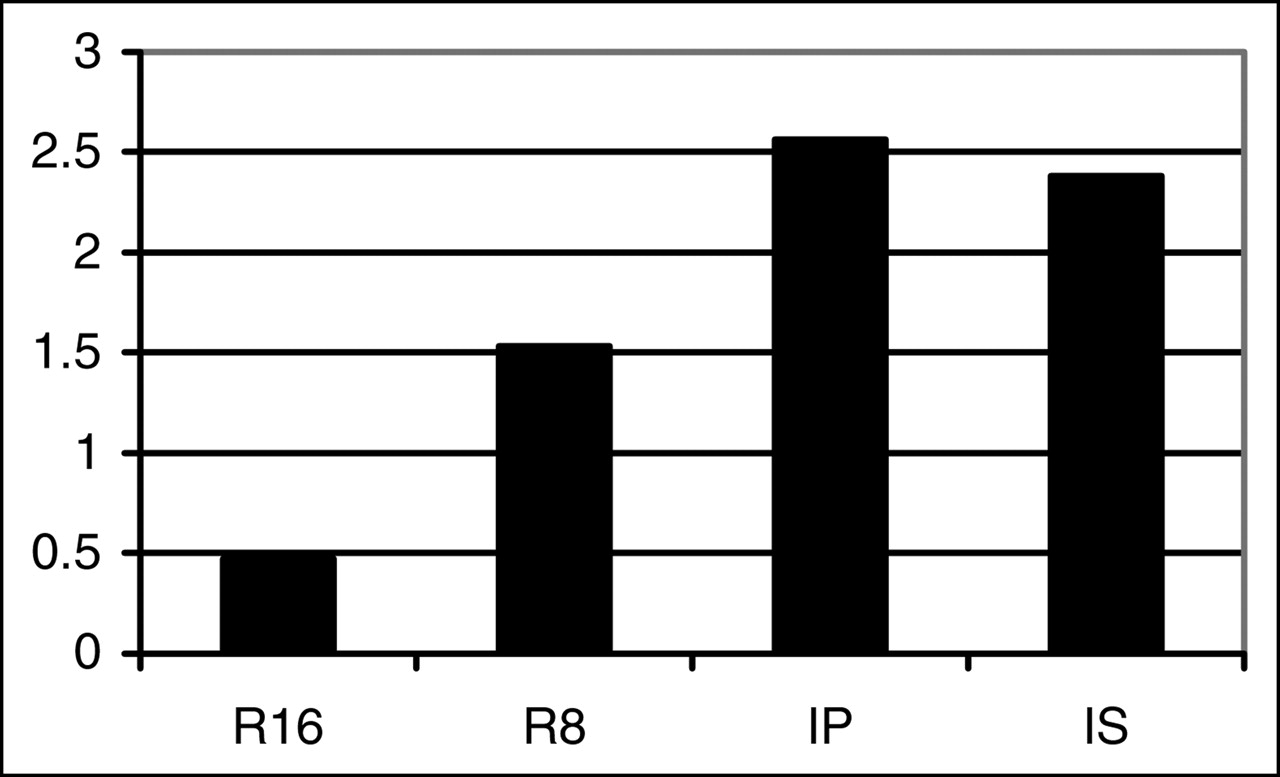
Roughness_Index values, reported as percentages. See text for details. All differences were significant.
DISCUSSION
For quantitative LV functional parameters, our results are in agreement with the results of other works in which LVEF was consistently found to be 1.5–4.5 EF points lower with 8fr/cb data than with 16fr/cb data when QGS software was used (1–4) and up to 6.3 EF points lower when another type of software was used (5). This result is attributable to the conjunction of a smaller EDV and a larger ESV, which is obviously explained by the fact that 8fr/cb data, compared with 16fr/cb data, necessarily underestimate the highest point of the curve and overestimate the lowest point of the curve through averaging of 2 neighbor points. Our 8fr/cb-to-16fr/cb interpolated datasets gave EDV values similar to those obtained with R16 and slightly larger ESV values (about 2%–3%), probably because of the intrinsic low-pass filtering effect of a 2-harmonic Fourier interpolation. This logically led to slightly lower LVEF values with IP and IS compared with R16. Such a small difference (about 1 EF point) is very unlikely to have any clinical impact; moreover, the 95% agreement range was narrow, especially for IP (−3.5 to +1.1 EF points).
The global deviation of the LV volume curve obtained with IP and IS from the R16 reference, quantified by Av_Rel_Err, was slightly lower (i.e., better) with IP than with IS. We have no sound explanation for this finding; it could have been associated with the far lower (i.e., better) value of the Roughness_Index obtained with IP than with IS.
Our results also clearly confirmed our initial hypothesis that Fourier temporal interpolation would largely improve image quality over that obtained with R16. More surprisingly, the image quality obtained with IP and IS was even better than that obtained with R8, probably because of a decrease in some statistical noise component, although the filtering process occurred only in time, not in space. With Fourier temporal interpolation, each image in the cardiac cycle benefits to a certain extent from all of the cardiac cycle counting statistics. Again, without clear explanation, this finding was especially true for IP, for which most studies scored 3 and none scored below 2 (Fig. 5), although the difference between IP and IS was not significant.
Finally, when we examine all of the results, it clearly appears that IP and IS behave similarly on many points: ESV and LVEF were very slightly different from those obtained with R16, actually far less than those obtained with R8, whereas static image quality was far better than that obtained with R16 and even than that obtained with R8. IP results were superior to IS results for the Av_Rel_Err (deviation of volume curve points from R16 values) and for the Roughness_Index, which predicts a smoother and more fluid cine display. On this latter point, IP was even slightly superior to R16. There was also a nonsignificant trend toward better image quality with IP than with IS.
Limitations to the generalization of our results could be attributable to the inclusion criteria. The lack of obvious motion during acquisition was required to avoid introducing an uncontrollable and potentially large source of artifacts, especially regarding the image quality score. Temporal sampling rate effects are probably independent of motion artifacts; thus, this inclusion criterion is probably not an actual limitation. Requiring a regular sinus cardiac rhythm was mandatory to be sure that the reformatted 8fr/cb dataset was as identical as possible to a native 8fr/cb acquired dataset. This is a real but theoretic limitation because, in the case of arrhythmia or frequent premature ventricular beats, a lower temporal sampling rate is less prone to gating artifacts, such as end-cycle undersampling. Thus, our conclusion in favor of an 8fr/cb acquisition is a posteriori and somehow paradoxically reinforced by this inclusion criterion.
CONCLUSION
Fourier temporal interpolation of gated myocardial SPECT from 8fr/cb to 16fr/cb gave quantitative LV functional parameters (EDV, ESV, and EF) similar or very close to those obtained with R16 while providing slices of far better quality. Static image quality was even slightly better than that obtained with 8fr/cb, of course with the additional advantage of a 16fr/cb cine display over an 8fr/cb one.
Comparison between interpolation of projections followed by 16fr/cb reconstruction and 8fr/cb reconstruction followed by interpolation of slices revealed that the former method yielded more accurate and smoother volume curves.
Therefore, because the reconstruction of 16fr/cb data is no longer a problem with current computers, Fourier temporal interpolation of 8fr/cb projections to 16fr/cb projections before tomographic reconstruction is a simple and efficient way to obtain a marked improvement in gated myocardial SPECT by combining the respective quantitative and qualitative advantages (and even improving some) of 8fr/cb and 16fr/cb.
Acknowledgments
The authors acknowledge Andrew Hilson for fine editing and advice.
Footnotes
Received Jun. 8, 2005; revision accepted Aug. 1, 2005.
For correspondence or reprints contact: Eric Gremillet, Centre d’Imagerie Nucléaire, C.H.P.L., 39 Boulevard de la Palle, 42100 Saint-Etienne, France.
E-mail: egremillet{at}cinse.com


