


Abstract
There is increasing evidence that cell death after myocardial ischemia and reperfusion may begin as apoptosis rather than necrosis. To determine the time course, location, and extent of this process, we studied groups of rats after a 20-min interval of coronary occlusion and reperfusion. Methods: After thoracotomy, the left coronary artery was occluded for 20 min. After release and before study, groups of animals were allowed to recover for various intervals: 0.5 h (n = 6), 1.5 h (n = 7), 6 h (n = 7), 1 d (n = 8), 3 d (n = 8), or 2 wk (n = 5). At the time of study, the rats were injected with 99mTc-annexin V (80–150 MBq). One hour later, to verify the area at risk, 201Tl (0.74 MBq) was injected intravenously just after the left coronary artery reocclusion and the rats were sacrificed 1 min later. Dual-tracer autoradiography was performed to assess 99mTc-annexin V uptake and the area at risk. Results: Extensive 99mTc-annexin V uptake was observed in the mid myocardium after 0.5–1.5 h of reperfusion. The area of annexin uptake had expanded in the subendocardial and subepicardial layers at 6 h after reperfusion and then gradually lessened over 3 d. At 0.5 and 1.5 h of reperfusion, 99mTc-annexin V uptake ratios were 7.36 ± 2.95 and 6.34 ± 2.24 (mean ± SD), respectively. The uptake ratios gradually decreased at 6 h, 1 d, 3 d, and 2 wk after reperfusion (4.65 ± 1.93, 3.27 ± 0.92 [P < 0.01 vs. 0.5 h], 1.84 ± 0.55 [P < 0.001 vs. 0.5 h, P < 0.005 vs. 1.5 h], and 1.65 ± 0.31 [P < 0.001 vs. 0.5 h, P < 0.005 vs. 1.5 h], respectively). Conclusion: These data indicate that annexin binding commences soon after ischemia and reperfusion in the mid myocardium within the area at risk and expands to include the subendocardial and subepicardial layers at 6 h after reperfusion, followed by gradual reduction of activity over 3 d.
There is increasing evidence that cell death after myocardial ischemia and reperfusion may begin as apoptosis rather than necrosis (1,2). Apoptosis can be detected both in vivo and in vitro on the basis of transfer of phosphatidylserine from the inner to the outer leaflet of the plasma membrane. In healthy cells, phosphatidylserine is actively transported from the outer to the inner leaflet of the cell membrane by an aminophospholipid translocase. Once cells activate their cell death program, phosphatidylserine from the inner leaflet of the membrane is externalized. This phosphatidylserine expression is an early sign that the cell death program is activated (3,4). Phosphatidylserine exposure on the outer leaflet of the cell membrane can easily be detected with annexin V. Annexin V, a 36-kD physiologic protein, binds with nanomolar affinity to cell membrane–bound phosphatidylserine. In in vitro studies, a fluorescein-labeled form of annexin V (i.e., Annexin V FITC; Genzyme Diagnostics) has been used with fluorescence cell sorting as a means of identifying the frequency of apoptosis in cell culture studies. Recently, 99mTc-labeled annexin V was developed to image apoptotic cell death in vivo (5–9). Scintigraphic imaging with 99mTc-annexin V in animal models with heart, liver, and lung transplant rejection, as well as chemotherapy-induced apoptosis, has been reported (10–15). Investigation of the biodistribution and dosimetry of various forms of radiolabeled annexin in humans (16,17) has demonstrated the safety of this agent and the efficacy of imaging for the detection of cardiac transplant rejection and acute myocardial infarction (18,19).
Among patients with myocardial infarction, there is intense localization in the infarct region both in those with and in those without reperfusion (20). These data suggest that a considerable number of cells in the infarct zone die by apoptosis. Although the most effective method to limit the zone of injury in areas of markedly decreased perfusion is restoration of blood flow, studies have demonstrated that reperfusion is a major stimulus for apoptosis in previously ischemic tissue, especially in nonsalvageable cells (1,2). A current concept is that apoptotic cell death occurs primarily at the periphery of the lesion, rather than in the center. However, the nonsalvageable cells should be most abundant at the center of the lesion, where oxygen deprivation should be most prevalent. Therefore, to determine the time course and distribution of apoptosis in myocardial infarction, we performed an autoradiographic study, using the tracer 99mTc-annexin V as a marker of apoptosis, on a series of rats after brief intervals of total coronary occlusion.
MATERIALS AND METHODS
Animal Model of Acute Ischemia and Reperfusion
Male Wistar rats 8–11 wk old were anesthetized with intraperitoneal administration of pentobarbital, 40 mg/kg, and were ventilated mechanically with room air. After left thoracotomy and exposure of the heart, a 7-0 polypropylene suture on a small curved needle was passed through the myocardium beneath the proximal portion of the left coronary artery (LCA), and both ends of the suture were passed through a small vinyl tube to make a snare. The suture material was pulled tightly against the vinyl tube to occlude the LCA. Myocardial ischemia was confirmed by ST-segment elevation on electrocardiography and regional cyanosis of the myocardial surface. Two series of experiments were performed: The first evaluated a 10-min interval of LCA occlusion and reperfusion to determine whether apoptosis occurs after severe ischemia; the second evaluated a 20-min interval of LCA occlusion to determine the distribution of apoptosis in infarction. Reperfusion was obtained by release of the snare and was confirmed by a myocardial blush over the risk area. The snare was left loose on the surface of the heart for reocclusion of the LCA just before sacrifice in the animals studied at 0.5 and 1.5 h, to identify the area at risk. In the remaining animals, the snare was also left loose on the surface of the heart until repeated thoracotomy. A group of animals with 10-min occlusion was studied at 0.5 h (n = 5) after reperfusion. Groups of animals with 20-min occlusion were studied at 0.5 h (n = 6), 1.5 h (n = 7), 6 h (n = 7), 1 d (n = 8), 3 d (n = 8), and 2 wk (n = 5) after reperfusion. At the time of study, 80–150 MBq of 99mTc-annexin V was injected via a tail vein. One hour afterward, 0.74 MBq of 201Tl was injected via a tail vein just after reocclusion of the proximal portion of the LCA for delineation of the area at risk. One minute later, the rat was euthanized and the heart was removed for analysis. The heart was rinsed in saline, frozen in isopentane, cooled in dry ice, and embedded in methyl cellulose. Serial short-axis heart sections 20 μm thick were obtained using a cryostat to create a series of rings for autoradiography.
Radiolabeling of Annexin V
Mutant annexin V (annexin V-117 mutant, a form of recombinant human annexin engineered to include a binding site for technetium) was prepared through expression in Escherichia coli as previously described (9). This material retains phosphatidylserine-binding activity equivalent to that of native annexin V. A specific activity of 3.7–7.4 MBq (100–200 μCi)/μg of protein with a radiopurity of more than 90% was achieved using a previously described radiolabeling protocol (9).
Dual-Tracer Autoradiography
Dual-tracer autoradiography of the left ventricular short-axis slices was performed to assess 99mTc-annexin V uptake and ischemic area (201Tl uptake). The first autoradiographic exposure on an imaging plate (BAS-MS; Fuji Film) was performed for 15–20 min to visualize 99mTc-annexin V distribution 1–2 h after sacrifice. Three days later (12 half-lives of 99mTc), the second exposure was made for 24 h to image the area at risk expressed by 201Tl distribution.
Data Analysis
99mTc-Annexin V accumulation was evaluated in 3 midventricular myocardial slices spaced 1 mm apart from one another. The distribution of the tracers was determined by analysis of the digitized autoradiographs. The photostimulated luminescence in each pixel (100 × 100 μm) was determined using a bioimaging analyzer (BAS-5000; Fuji Film). For quantitative analysis, the uptake values (UVs) of each region of interest (ROI) were expressed as the background-corrected photostimulated luminescence per unit area (1 mm2). A background ROI was set adjacent to the left ventricle. Ischemic and normally perfused areas were defined from the 201Tl image, and these ROIs were applied to the 99mTc-annexin V images to evaluate uptake of 99mTc-annexin V. The 99mTc-annexin V uptake ratio in the apoptotic area was calculated by dividing the UV of the 99mTc-annexin V uptake region by that of the normally perfused area. The ratio of the apoptotic ROI area to the ischemic ROI area was defined as the percentage of apoptotic area. The total annexin V uptake index that would reflect total apoptotic burden in the ischemic region was also calculated by the following formula: total annexin V uptake index = (relative apoptotic area) × (UV in area of significant annexin V uptake)/(UV in normally perfused area). All parameters in each rat were expressed as an average value obtained from the analysis of 3 representative slices.
In Situ Detection of Nuclear DNA Fragmentation
Short-axis frozen sections adjacent to the slices for autoradiography were mounted on slides and processed using terminal deoxynucleotidyl transferase–mediated dUTP nick-end labeling (TUNEL) staining, performed using the in situ cell death detection kit, POD, according to the manufacturer’s protocol (Roche Diagnostics GmbH). The number of TUNEL-positive cardiomyocytes was divided by the total number of cardiomyocytes to determine the ratio of TUNEL-positive myocytes within the area at risk and the normally perfused area (21). More than 50 different fields for each section were analyzed. As a positive control, we used rat intestine. Additional slices were also examined using hematoxylin–eosin staining.
DNA Gel Electrophoresis
The presence of nucleosomal laddering in hearts was investigated with a ligase-mediated polymerase chain reaction assay kit (Apoalert; Clontech). DNA was isolated from tissue samples previously frozen at −80°C. Dephosphorylated adapters were ligated to 5′ phosphorylated blunt ends with T4 DNA ligase (during 16 h at 16°C) and served as primers in a ligase-mediated polymerase chain reaction under the following conditions: hot start (72°C for 8 min), 23 cycles (94°C for 60 s and 72°C for 180 s), and postcycling (72°C for 15 min). Amplified DNA was subjected to gel electrophoresis on 1.2% agarose gel containing ethidium bromide.
Histopathologic Examinations with Light Microscopy
Hematoxylin- and eosin-stained slices adjacent to the slices used for autoradiography were examined histopathologically by light microscopy. For the 10-min occlusion model, 5 rat specimens after 1 d of reperfusion were examined in addition to the specimens after 0.5 h of reperfusion.
Statistical Analysis
All results were expressed as mean ± 1 SD. Statistical analyses were performed using a Macintosh computer (Apple Computer, Inc.) with StatView software (version 5.0; SAS Institute Inc.). Groups were compared using ANOVA, followed by the Scheffé test to identify differences among groups. A value of P < 0.05 was considered statistically significant.
RESULTS
Size of Area with 99mTc-Annexin V Uptake Against Area at Risk
For the animals with a 20-min occlusion, the percentage of apoptotic area charted against the area at risk at each time point is depicted in Figure 1. The percentage of apoptotic area at 0.5 and 1.5 h after reperfusion was 55.4% ± 18.2% and 58.0% ± 7.5%, respectively, and increased to 67.1% ± 9.8% at 6 h and 67.2% ± 8.1% at 1 d after reperfusion. The area decreased to 63.0% ± 14.9% at 3 d and 48.3% ± 19.8% at 2 wk after reperfusion. However, these changes were not statistically significant.
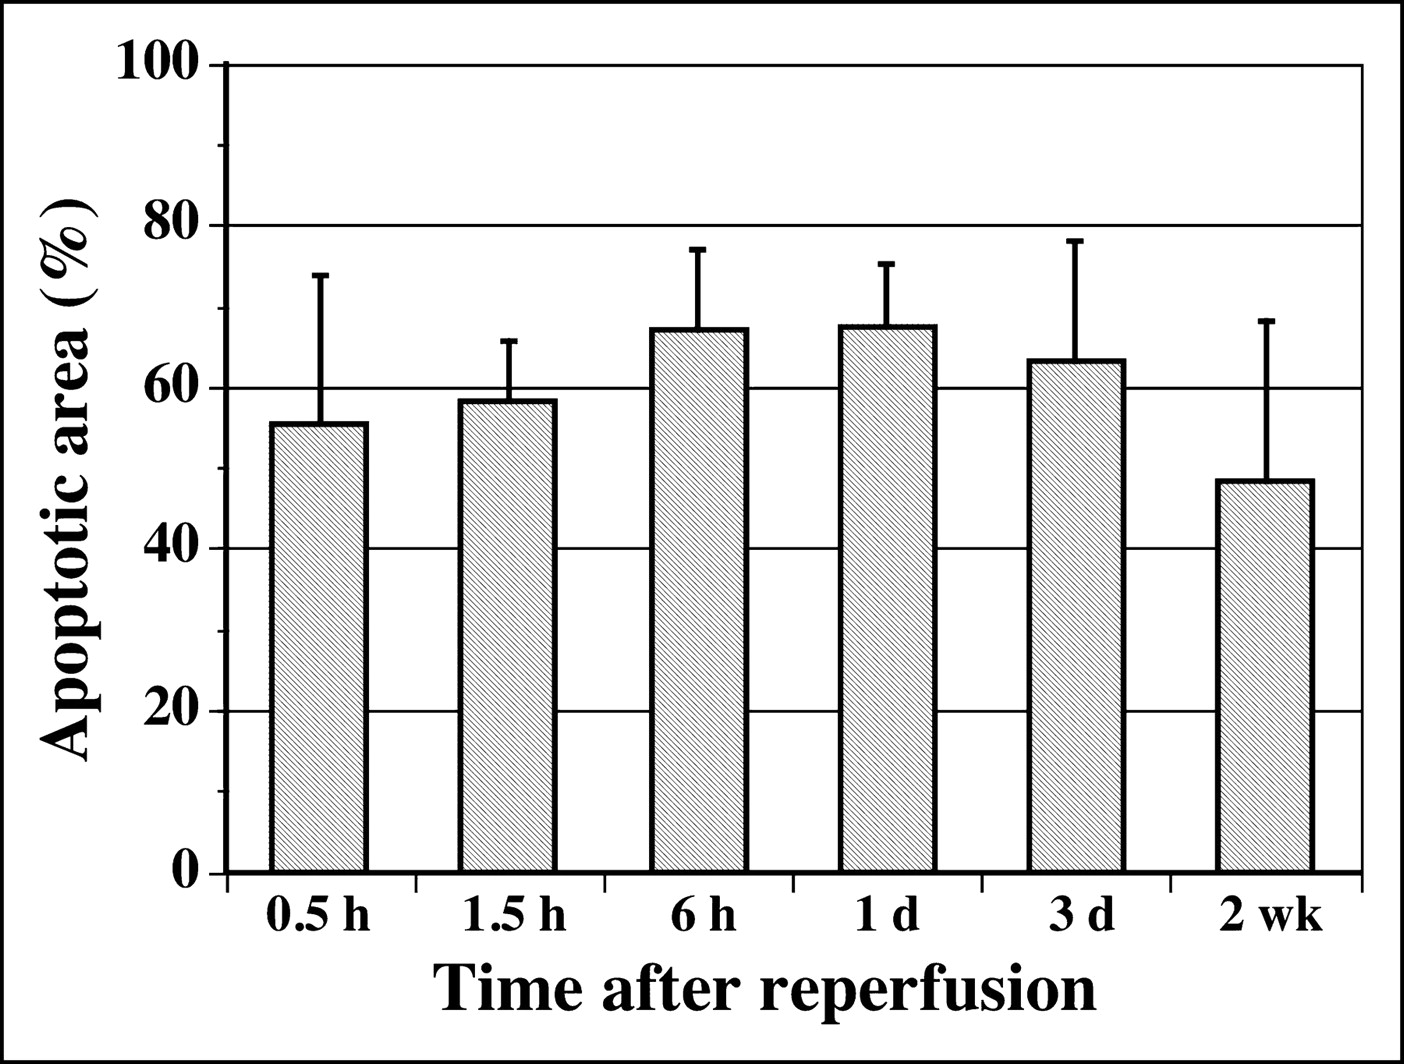
Time course of 99mTc-annexin V uptake area.
For the group with 10-min occlusion and 30-min reperfusion, the percentage of apoptotic area was 57.5% ± 5.2%.
99mTc-Annexin V Uptake
An irregular area of 99mTc-annexin V uptake was observed in the area at risk at every time point after reperfusion. Significant uptake was observed predominantly in the mid myocardium (central uptake pattern) at 0.5 and 1.5 h after reperfusion (Fig. 2). Epicardial or endocardial uptake was not seen in all cases. At 6 h after reperfusion, annexin V uptake was observed dominantly in the endo- and epicardial layers and also at the lateral border zone of ischemia, demonstrating a peripheral uptake pattern in 6 of 7 rats. After 1 d of reperfusion, annexin V uptake still had a peripheral pattern in half the rats, with the remainder showing inhomogeneous uptake throughout the endo- and epicardial layers. At 3 d to 2 wk after reperfusion, only weak uptake was seen (Fig. 2).

Autoradiography of 99mTc-annexin V and 201Tl. After 20 min of ischemia, 99mTc-annexin V was injected at 0.5 h, 1.5 h, 6 h, 1 d, 3 d, and 2 wk after reperfusion. Single midventricular slices are shown from representative animals from each group. 201Tl images (bottom row) demonstrate the area at risk. Annexin images (top row) demonstrate the area of and intensity of apoptosis. 99mTc-Annexin V uptake was significant in the area at risk and decreased with time after reperfusion. Significant uptake of 99mTc-annexin V was predominantly in the mid myocardium at 0.5 and 1.5 h after reperfusion and expanded to the subendomyocardial and subepicardial layers and lateral border zone of ischemia at 6 h after reperfusion. Annexin V uptake was still observed after 1 d of reperfusion and decreased over the 3 d after reperfusion.
The intensity of 99mTc-annexin V uptake in the apoptotic area, compared with normal myocardium, in the animals with a 20-min occlusion was higher at 0.5 h after reperfusion (7.36 ± 2.95) than at 1.5 h (6.34 ± 2.24). Uptake intensity decreased at 6 h (4.65 ± 1.93) and declined progressively at 1 d (3.27 ± 0.92, P < 0.01 vs. 0.5 h), 3 d (1.84 ± 0.55, P < 0.001 vs. 0.5 h, P < 0.005 vs. 1.5 h), and 2 wk (1.65 ± 0.31, P < 0.001 vs. 0.5 h, P < 0.005 vs. 1.5 h) after reperfusion (Fig. 3A).

(A) Time course of 99mTc-annexin V uptake ratio in the apoptotic area after ischemia and reperfusion. Time after reperfusion indicates the time of 99mTc-annexin V injection. 99mTc-Annexin V uptake ratio was highest shortly after reperfusion. (B) Time course of total 99mTc-annexin V uptake index, showing results similar to those for 99mTc-annexin V uptake ratio. Total uptake was highest at 30 min after reperfusion and decreased with time over the next 3 d. (C) Time course of the percentage of TUNEL stain–positive cardiomyocytes after reperfusion. Time after reperfusion indicates the time of 99mTc-annexin V injection. TUNEL positivity increased up to 1 d after reperfusion and then significantly declined at 3 d after reperfusion.
The total annexin V uptake index demonstrated similar results (Fig. 3B). Total uptake was highest at 0.5 h after reperfusion (4.18 ± 2.30) and decreased with time (3.75 ± 1.59, 3.09 ± 1.39, 2.17 ± 0.49, 1.15 ± 0.41 [P < 0.01 vs. 0.5 h, P < 0.05 vs. 1.5 h], and 0.82 ± 0.45 [P < 0.01 vs. 0.5 h, P < 0.05 vs. 1.5 h] at 1.5 h, 6 h, 1 d, 3 d, and 2 wk after reperfusion, respectively).
In the group with a 10-min occlusion and 30 min of reperfusion, weak but apparent uptake was observed in the ischemic area in all rats: The 99mTc-annexin V uptake ratio was 1.81 ± 0.32, and the total annexin V uptake index was 1.05 ± 0.28. The 99mTc-annexin V uptake ratio in the ischemic area of these animals was much lower than that in the animals with a 20-min occlusion and 30 min of reperfusion (P < 0.001).
TUNEL-Positive Cardiomyocytes and DNA Gel Electrophoresis
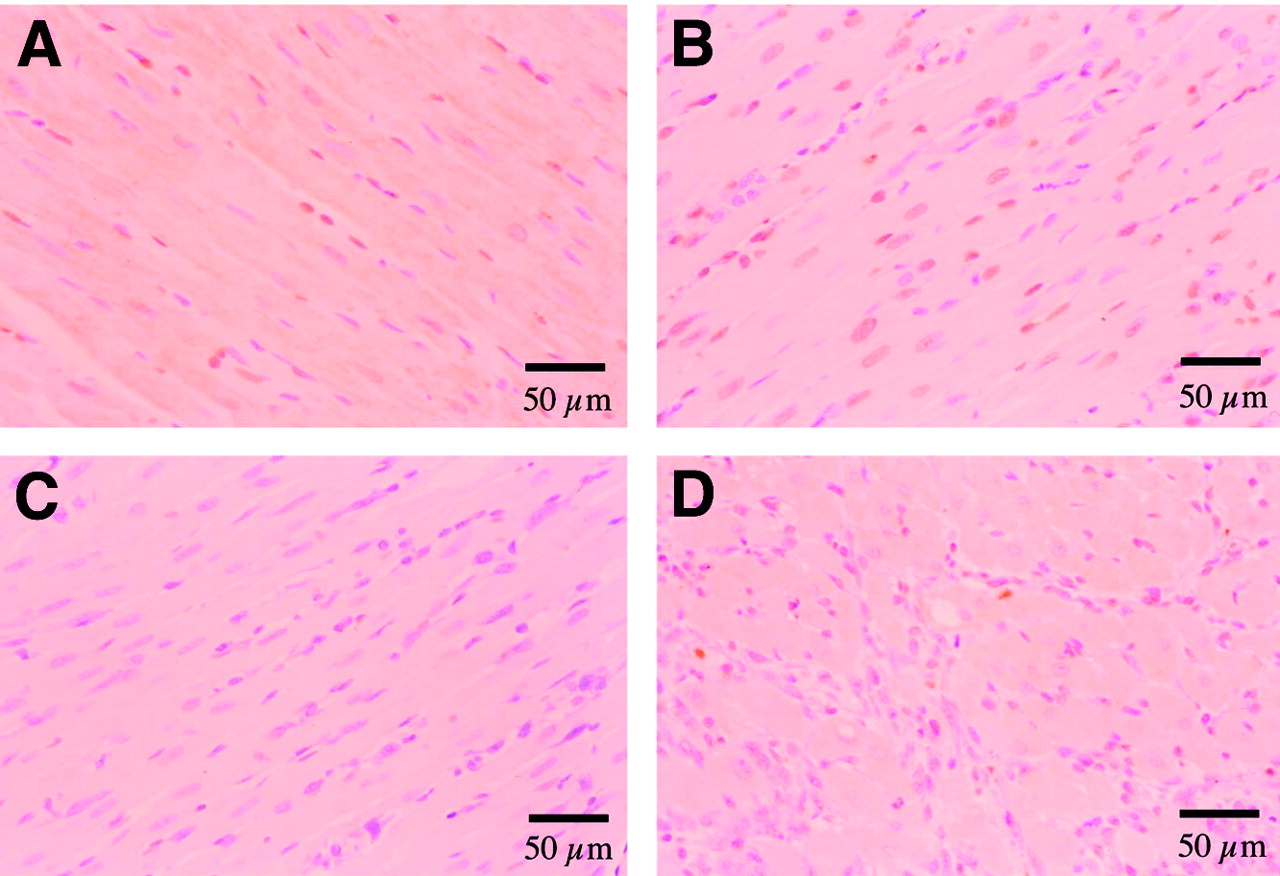
TUNEL-positive cells were detected in the group with 0.5 h of reperfusion (sacrificed at 1.5 h after reperfusion). The percentage of TUNEL-positive cardiomyocytes in the ischemic area increased up to 31.8% ± 10.6% for the rats at 1 d after reperfusion and decreased at 3 d and 2 wk after reperfusion (Fig. 3C). Representative TUNEL staining is shown in Figure 4. Cardiomyocytes in the remote area demonstrated minimal TUNEL staining (<0.20% [0.074% ± 0.082%]) in all rats.

Detection of cell death in heart with TUNEL stain by light microscopy. (A) Moderate numbers of cardiomyocytes became TUNEL positive (brown staining of nucleus) after 20 min of ischemia and 0.5 h of reperfusion. (B) More cardiomyocytes became TUNEL positive after 20 min of ischemia and 1 d after reperfusion. (C) No TUNEL staining was observed in the nonischemic area of the same slice as shown in B. (D) Minimal numbers of cardiomyocytes were TUNEL positive after 20 min of ischemia and 3 d after reperfusion.
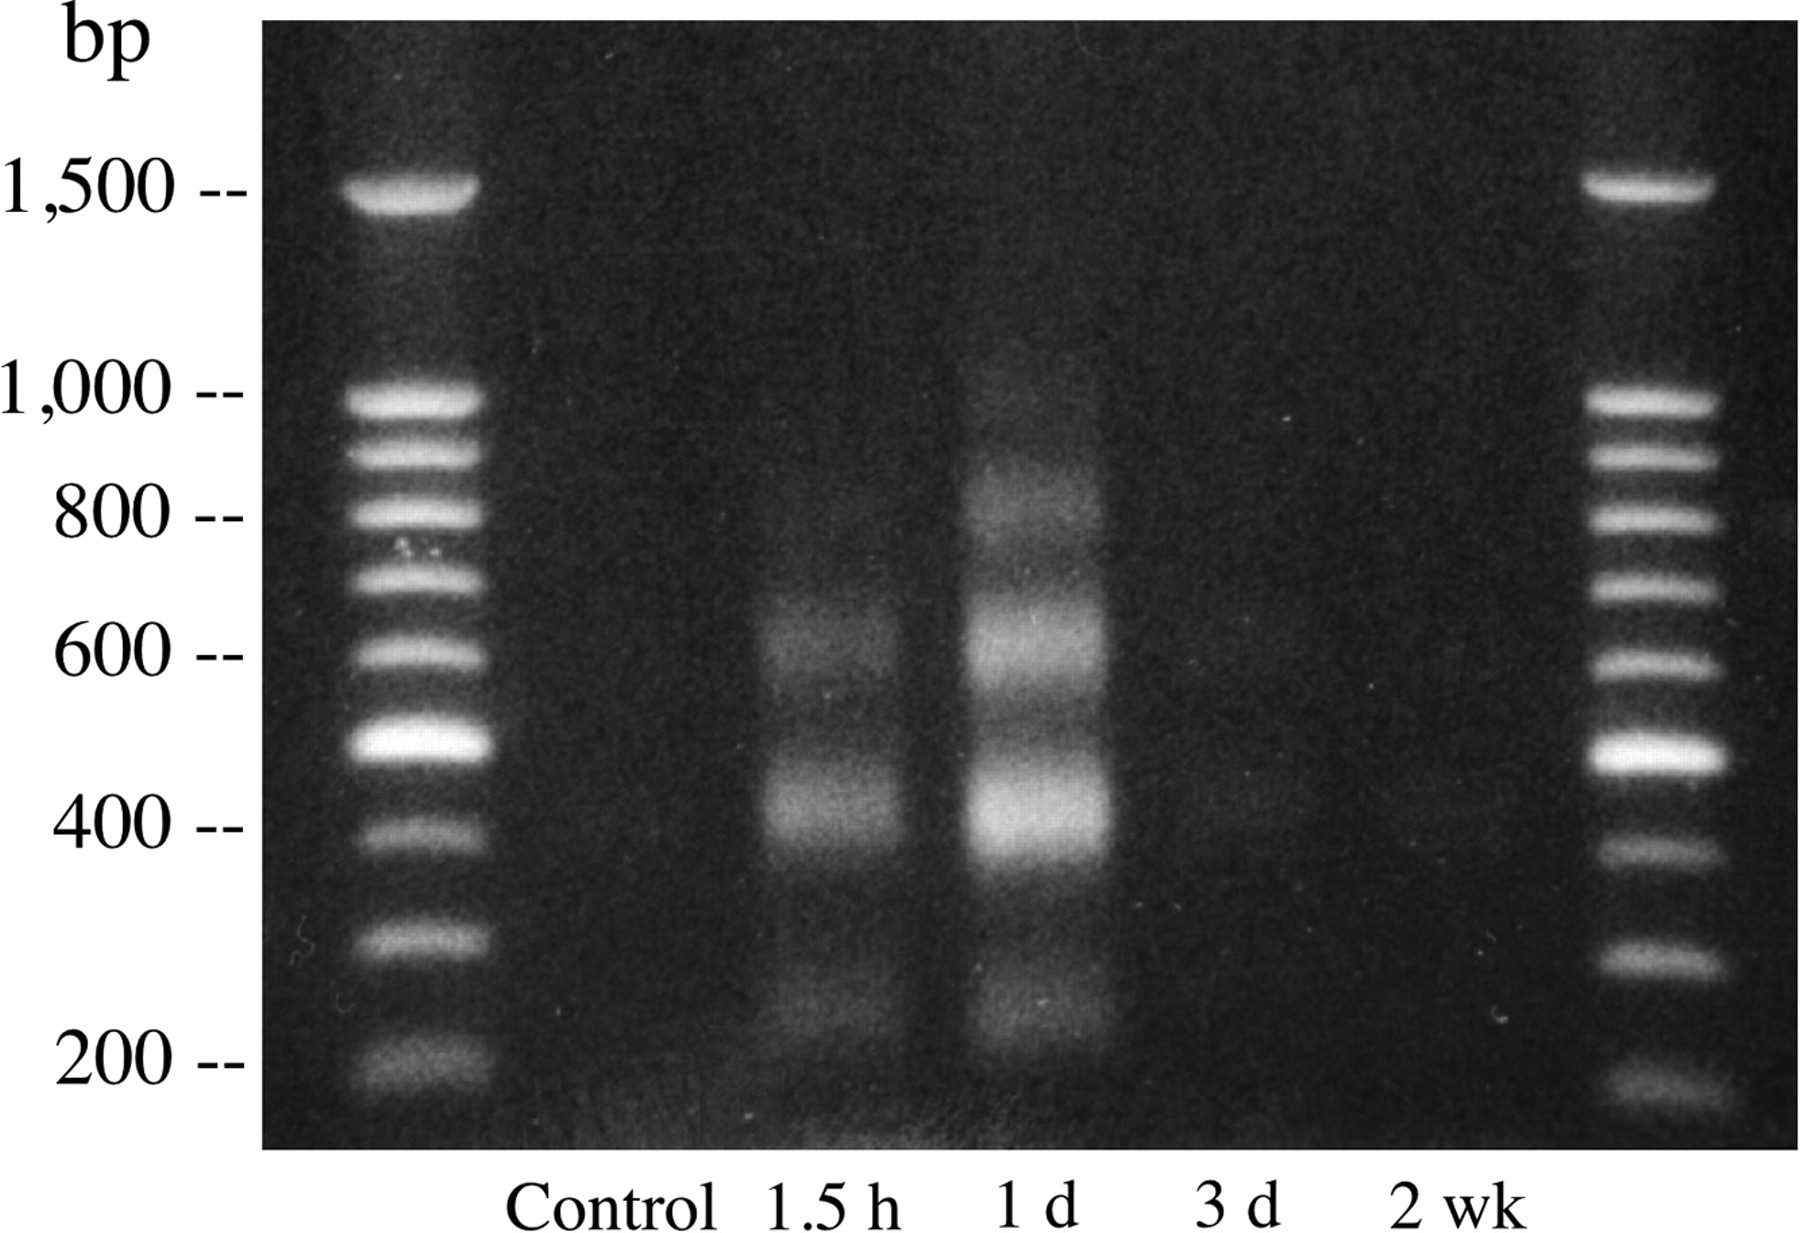
DNA laddering was clearly demonstrated in myocardial specimens sampled from the groups with 1.5 h to 1 d of reperfusion and was very attenuated at 3 d and 2 wk after reperfusion (Fig. 5).

DNA gel electrophoresis clearly demonstrates DNA laddering in myocardial specimens sampled at 1.5 h and 1 d after reperfusion and markedly attenuated DNA laddering at 3 d and 2 wk after reperfusion. DNA laddering shows bands at multiples of 180–200 bp.
Histopathologic Findings
In the animals with a 20-min occlusion, light microscopic examination of the hematoxylin- and eosin-stained slices from frozen specimens showed no myocardial degeneration, necrosis, or inflammatory cell infiltrates at 0.5 or 1.5 h after reperfusion. Tiny foci of myocardial degeneration with a few neutrophilic infiltrates were observed at 6 h after reperfusion. One day after reperfusion, the cardiac muscle fibers were hypereosinophilic because of coagulation necrosis, and extensive neutrophilic infiltrates were observed between the fibers. At 3 d after reperfusion, macrophage infiltrates were seen between the degenerated cardiomyocytes in the infarcted area. Two weeks after reperfusion, necrotic myocardium was replaced by fibrous granulation tissues with calcification.
Among the 10-min-occlusion animals, neither the group with 0.5 h of reperfusion nor the group with 1 d of reperfusion had evidence of myocardial degeneration, necrosis, or inflammatory cell infiltrates.
DISCUSSION
The present study demonstrated the appearance of apoptotic cell death within 30 min of reperfusion after a 20-min occlusion. The evolution of programmed cell death followed a stereotyped geographic pattern, initially involving the mid myocardium and then spreading to the epi- and endocardial surfaces over about 24 h. The wave of apoptosis was heterogeneous in the area at risk, with the most intense uptake occurring immediately after reperfusion.
The timing and distribution of 99mTc-annexin V accumulation within the earliest stage of ischemic lesion after reperfusion were consistent with the findings of real-time monitoring of apoptotic cell-membrane changes in the beating murine heart and postmortem specimens—namely, that binding of Oregon green–labeled annexin V to the cell membrane started just after reperfusion, reached a plateau within 20–25 min, and was limited to the mid myocardium (22,23). In humans, Hofstra et al. demonstrated 99mTc-annexin V uptake in 6 of 7 patients with acute myocardial infarction by injecting the radiopharmaceutical at 2 h after reperfusion (18).
Recent studies on rats demonstrated that apoptosis is the major form of myocardial damage at 2–4.5 h after coronary artery occlusion, whereas necrotic cell death occurred later (24). Although necrosis and apoptosis are 2 separate forms of cell death, determining which process is occurring in injured myocardium may be difficult. It has been suggested that whether injured cells undergo necrosis or apoptosis depends on the intracellular adenosine triphosphate content (25).
99mTc-Annexin V uptake should reflect events early after the triggering of cell death. However, it is not clear whether all uptake of annexin V in the heart reflects ongoing execution of the cell death program or whether localization is also due to necrotic cells, which have such permeable cell membranes that phosphatidylserine retained on the inner leaflet of the membrane is now accessible to the radiolabeled annexin V. In the early phase of ischemia and reperfusion, Dumont et al. demonstrated that the percentage of cardiomyocytes staining positively for biotinylated annexin V was far greater than the percentage staining positively for IgG, which indicates plasma cell membrane leakage, after 15 and 30 min of ischemia and 90 min of reperfusion (23). Therefore, at least until 90 min of reperfusion, most of the annexin V uptake might represent phosphatidylserine externalization. Also, in the permanent-occlusion model, TUNEL stain–positive cardiomyocytes were far more numerous than myosin antibody stain–positive cells until 4.5 h after coronary artery occlusion, suggesting most of the cell damage occurs without cell membrane leakage (24). In addition, there might be little binding of annexin V to necrotic cells because myocytes have a significant intracellular content of (unlabeled) annexin V. In rat cardiomyocytes, annexin V is found predominantly on the sarcolemma and intercalated disks within the myocytes (26), and its content is around 130 μg/g of wet weight (27), far greater than the concentration of the radiolabeled material, when <30 μg of labeled annexin V is injected per rat (about 300 g of body weight). Based on the relative concentration gradient, exogenous radiolabeled annexin V will not easily enter the intracellular environment and bind to phosphatidylserine competitively. Our study demonstrated that the distribution of annexin V was consistent with the area of TUNEL staining. TUNEL staining is considered rather specific for apoptosis (28), although several recent reports suggest there may be causes other than apoptosis for TUNEL staining (29,30). Activation of the cell death program within cardiomyocytes is also indicated by fragmentation of DNA, as shown with DNA gel electrophoresis. In addition, in the animals that had a 10-min occlusion and 30 min of reperfusion, light microscopy demonstrated significant 99mTc-annexin V uptake despite the absence of necrotic changes at 30 min and 1 d after reperfusion. These findings suggest that the uptake of 99mTc-annexin V does not indicate necrosis at least in this model. The observation that apoptosis might be the major form of cell death early after reperfusion suggests that interventions designed to impede the cell death program may be a useful therapy. Dumont et al. demonstrated that pretreatment with a novel Na+-H+ exchange inhibitor, eniporide, and caspase inhibitor decreased annexin V–positive cardiomyocytes after 30 min of ischemia followed by 90 min of reperfusion (22,23).
In the present study, both 99mTc-annexin V uptake and TUNEL-positive cardiomyocytes were confined to the area at risk and had a concordant distribution. 99mTc-Annexin V uptake was most prominent at 30–90 min after reperfusion and then gradually lessened, whereas the number of TUNEL-positive cardiomyocytes peaked at 6 h to 1 d after reperfusion. These findings are in keeping with the known temporal sequence of apoptosis, in which one of the earliest events is externalization of phosphatidylserine, followed by DNA fragmentation. Van den Eijnde et al. used an intracardiac injection of biotin-labeled annexin V in the developing embryo to detect sites of apoptosis during fetal development. Annexin V–positive and TUNEL-negative cells were found in the early execution phase of apoptosis, whereas cells that were positive on both annexin V and TUNEL staining were in a later phase of apoptosis. The pyknotic cell fragments were often only TUNEL positive (31).
The time frame of 99mTc-annexin V accumulation in myocardial tissue after acute ischemia and reperfusion is quite different from that of an imaging agent formerly used to detect acute infarction, 99mTc-pyrophosphate. Uptake of 99mTc-pyrophosphate in reperfused infarcts starts around 3 h after acute infarction, increases in the first 24–72 h, and then lessens. The timing of annexin uptake, on the other hand, appears to be more limited, with uptake peaking shortly after reperfusion and then minimizing by 3 d. This pattern of uptake has been described in humans in a preliminary clinical investigation (32). However, the data in the present study suggested that 99mTc-annexin V imaging should be a more sensitive and useful tool for evaluating early cell death in patients with acute coronary syndromes.
CONCLUSION
Our data demonstrate the rapid onset of apoptotic cell death after reperfusion. Accumulation of 99mTc-annexin V is marked in the midmyocardial layer within the area at risk of ischemia at 30 min after reperfusion, expands to the subendomyocardial and subepicardial layers at 6 h after reperfusion, and then gradually lessens with time over 3 d.
Acknowledgments
This study was supported in part by grants-in-aid for scientific research (C-14570842) from the Ministry of Education, Science, Sports, and Culture, Japan.
Footnotes
Received Jan. 22, 2004; revision accepted Mar. 10, 2004.
For correspondence or reprints contact: Junichi Taki, MD, PhD, Department of Biotracer Medicine, Kanazawa University Graduate School of Medical Sciences, 13-1 Takara-machi, Kanazawa, 920-8640, Japan.
E-mail: taki{at}med.kanazawa-u.ac.jp
REFERENCES
In this issue


Jump to section
Related Articles
Cited By...
- Paracrine Engineering of Human Cardiac Stem Cells With Insulin-Like Growth Factor 1 Enhances Myocardial Repair
- Noninvasive Imaging of Myocyte Apoptosis Following Application of a Stem Cell-Engineered Delivery Platform to Acutely Infarcted Myocardium
- Targeting of Endothelin Receptors in the Healthy and Infarcted Rat Heart Using the PET Tracer 18F-FBzBMS
- Stable Delineation of the Ischemic Area by the PET Perfusion Tracer 18F-Fluorobenzyl Triphenyl Phosphonium After Transient Coronary Occlusion
- Cardioprotective Effects of Erythropoietin in Rats Subjected to Ischemia-Reperfusion Injury: Assessment of Infarct Size with 99mTc-Annexin V
- Effect of Postconditioning on Myocardial 99mTc-Annexin-V Uptake: Comparison with Ischemic Preconditioning and Caspase Inhibitor Treatment
- Characterization of Normal and Infarcted Rat Myocardium Using a Combination of Small-Animal PET and Clinical MRI
- 99mTc-Labeled C2A Domain of Synaptotagmin I as a Target-Specific Molecular Probe for Noninvasive Imaging of Acute Myocardial Infarction
- Past, Present, and Future of Annexin A5: From Protein Discovery to Clinical Applications
- The declining prevalence of ST elevation myocardial infarction in patients presenting with acute coronary syndromes