


Article Figures & Data
Figures
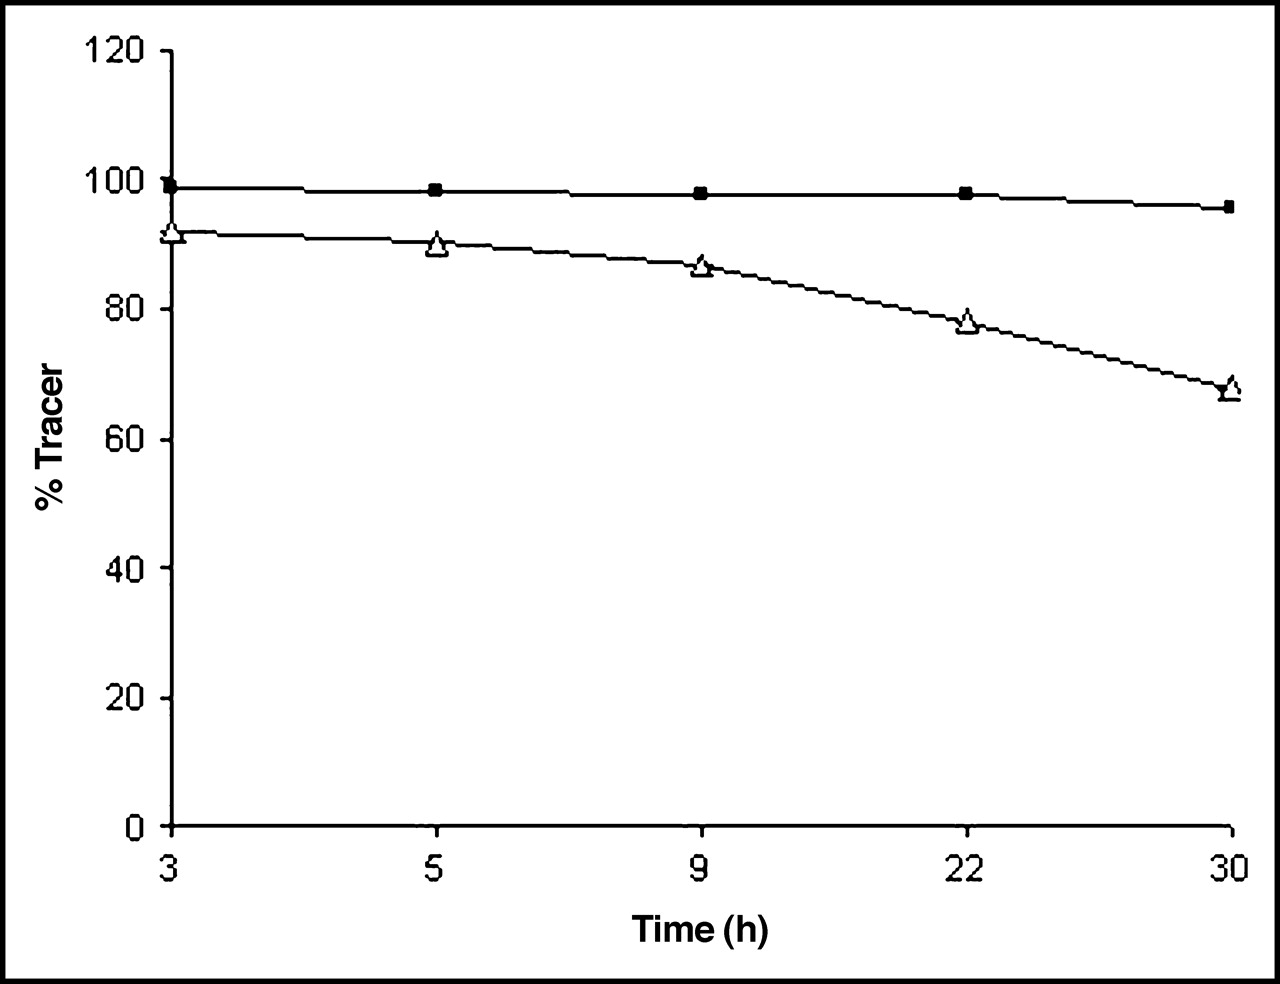
- FIGURE 1.
Stability of 123I-ChiB_E144Q in PBS as determined by ITLC (n = 5). ▵, in serum; ▪, in PBS.
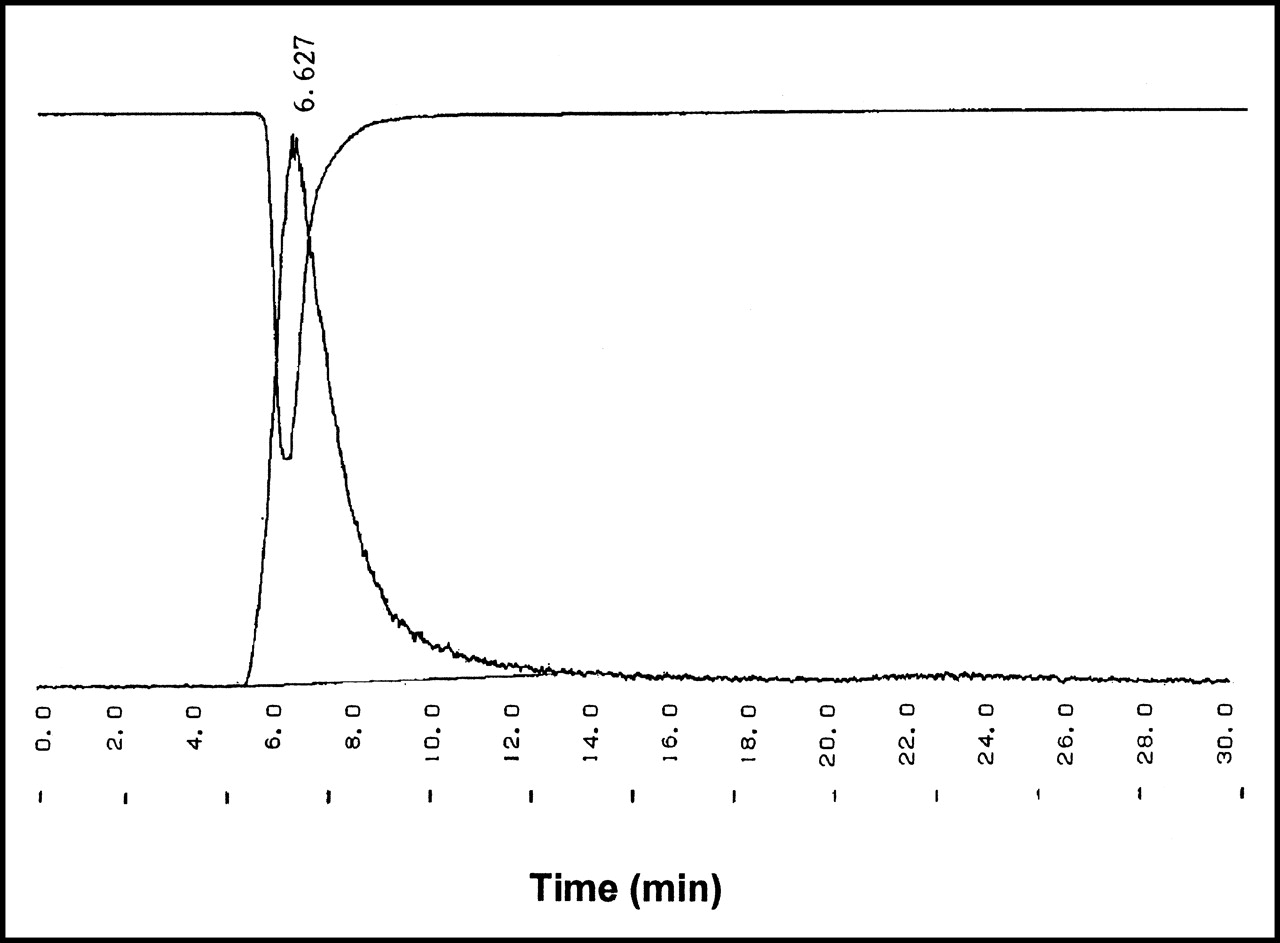
- FIGURE 2.
Typical UV profile (280 nm) of unlabeled ChiB_E144Q (upside down) combined with radiogram of 123I-ChiB_E144Q.
- FIGURE 3.
In vitro accumulation of 123I-ChiB_E144Q in various organisms after 24-h incubation at 4°C. Amount of tracer bound per 1 × 10⁷ cfu is plotted as function of increasing amounts of added tracer (1 μL = 2 × 10³ Bq). ▪, C. albicans; ○, E. coli; ▵, A. fumigatus; ×, S. aureus.
- FIGURE 4.
In vivo blood clearance (%ID) in healthy NMRI mice until 48 h after injection. Half-life (t1/2) parameters are calculated. Blood clearance follows a biexponential curve with equation (r2 = 0.987): A = A1 exp(−λ1t) + A2 exp(−λ2t) with t1/2,1 = 0.144 ± 0.035, t1/2,2 = 4.229 ± 0.701 and A1 = 6.436 ± 0.700 (%ID) and A2 = 9.053 ± 0.661 (%ID), λ1 = 0.1011 ± 0.0309 (min−1), λ2 = 0.0027 ± 0.0309 (min−1).
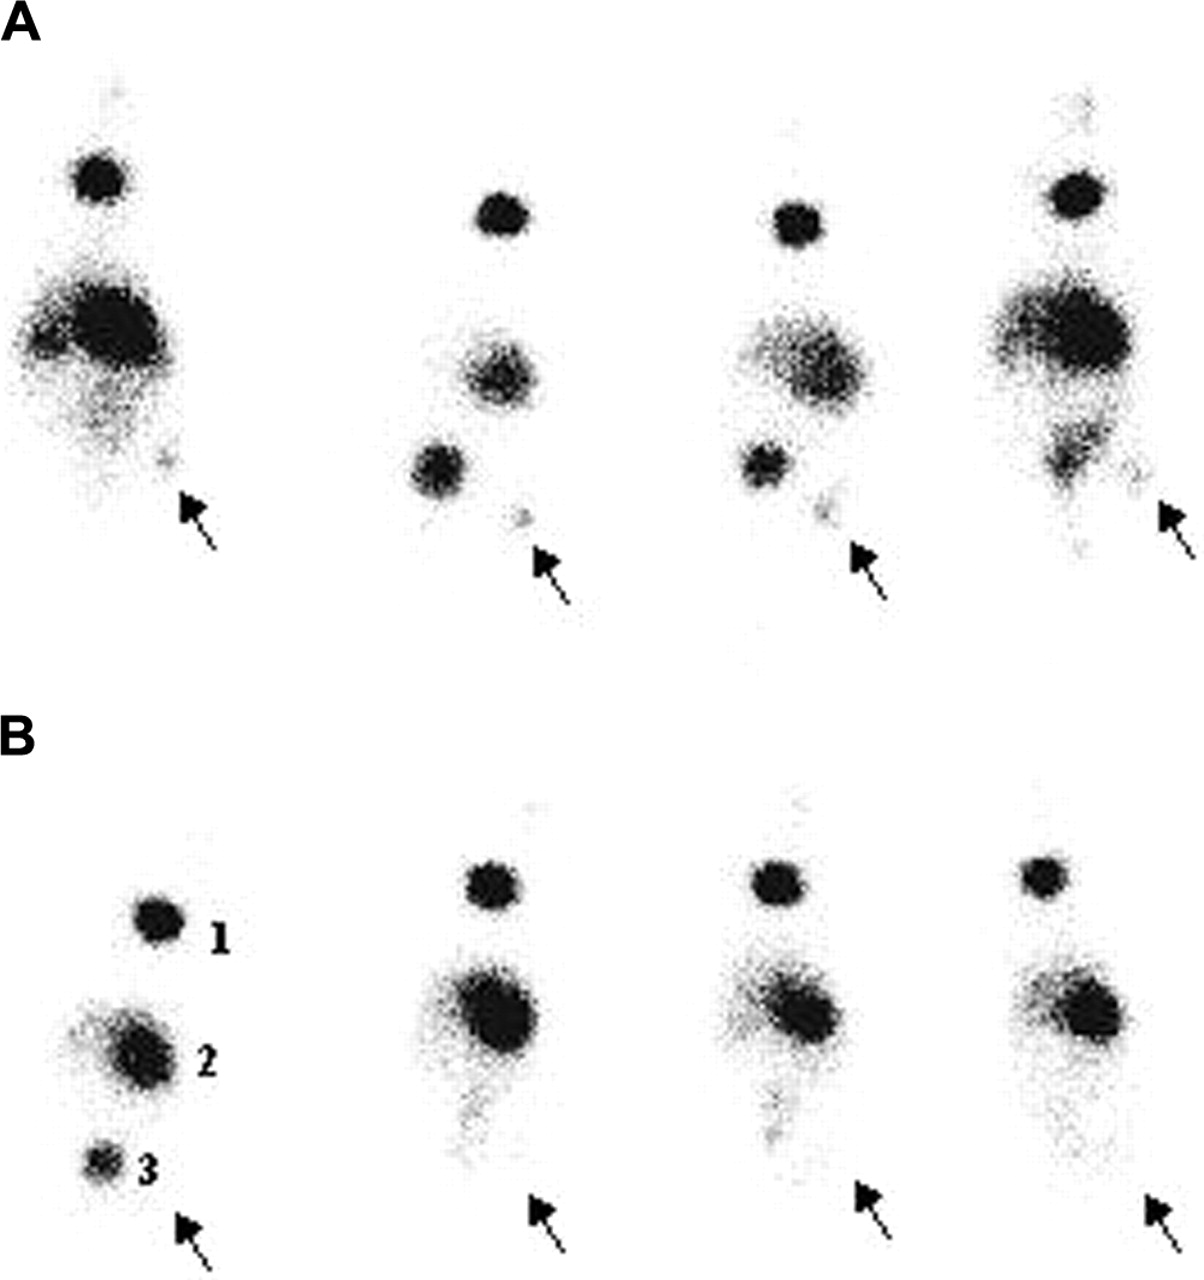
- FIGURE 5.
Scintigraphic images of nu/nu mice (n = 4) with unilateral infections of 1 × 10⁷ conidia of A. candida (A) and 1 × 10⁷ cfu of S. aureus (B) 24 h after injection of 7.4 MBq in 100 μL of 123I-ChiB_E144Q. Arrows indicate site of infection. 1 = thyroid; 2 = stomach; 3 = bladder.
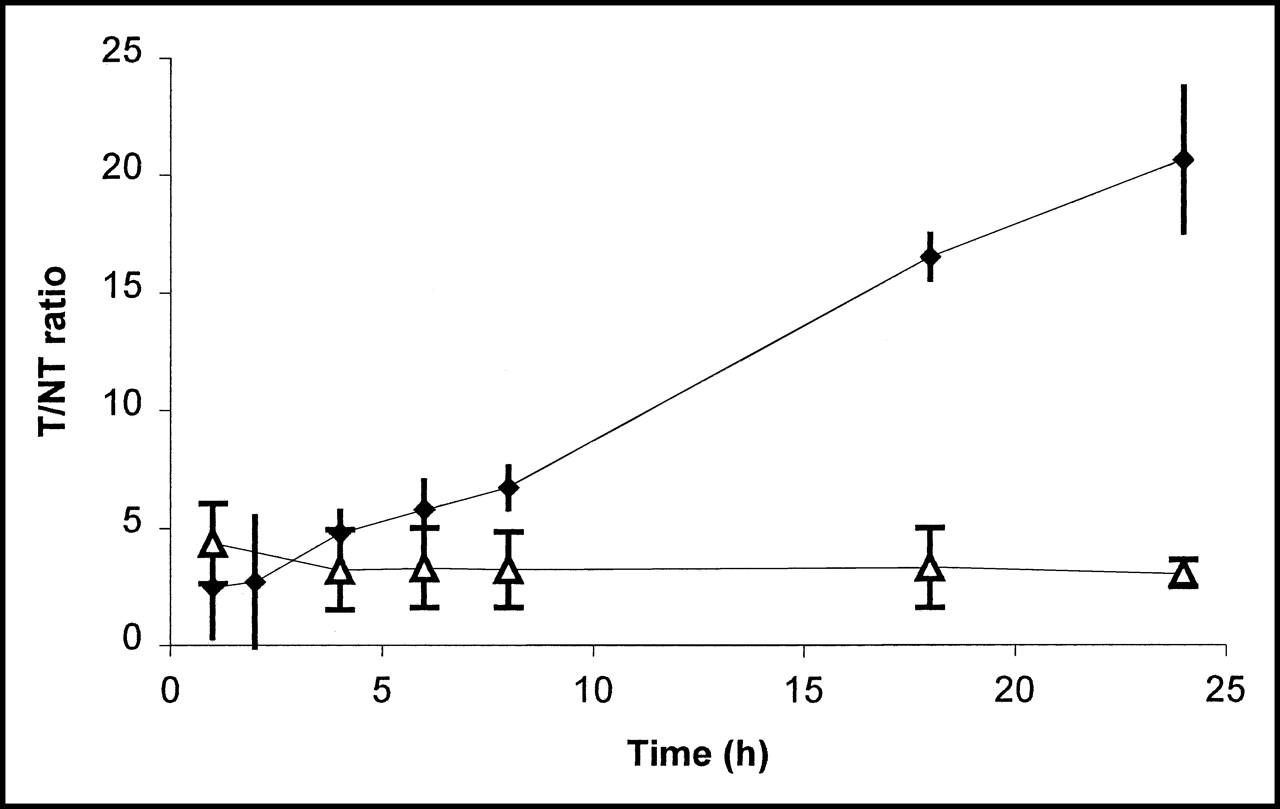
- FIGURE 6.
Uptake expressed as T/NT ratio ± SD (n = 3) of 123I-ChiB_E144Q in E. coli infections (▵) and C. albicans infections (♦) until 24 h after infection.
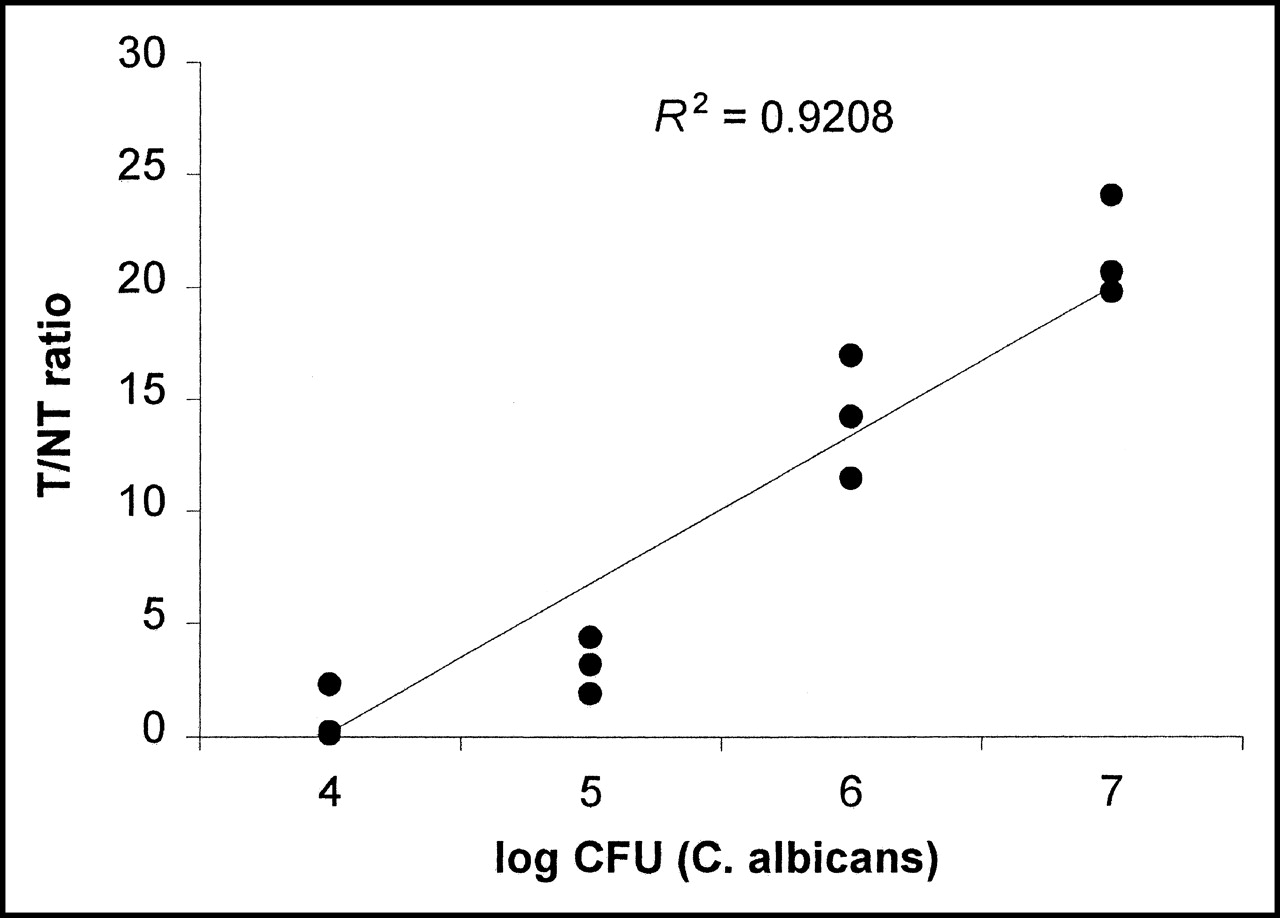
- FIGURE 7.
Relation between number of injected viable C. albicans and accumulation of 123I-ChiB_E144Q, expressed as T/NT ratio in infected tissue in Swiss nu/nu mice (n = 3).


Tables
Reaction time (min) Radiochemical yield (%) 5 10.81 10 34.87 10 41.64 10 34.95 20 44.49 30 40.31 Biodistribution 20 min 1 h 4 h 9 h 24 h 48 h Blood 14.23 ± 3.80 13.37 ± 1.01 5.09 ± 1.54 3.62 ± 0.43 0.83 ± 0.11 0.20 ± 0.03 Brain 0.29 ± 0.12 0.30 ± 0.08 0.18 ± 0.15 0.11 ± 0.02 0.03 ± 0.03 0.03 ± 0.04 Heart 3.80 ± 1.43 4.89 ± 1.85 1.40 ± 0.53 1.17 ± 0.40 0.35 ± 0.06 0.18 ± 0.13 Lung 5.01 ± 3.59 5.86 ± 1.40 1.86 ± 0.70 0.92 ± 1.17 0.42 ± 0.11 0.14 ± 0.04 Stomach 1.96 ± 1.30 4.89 ± 3.13 8.78 ± 4.10 6.64 ± 6.67 0.55 ± 0.12 0.11 ± 0.12 Spleen 3.69 ± 0.55 3.18 ± 0.23 1.23 ± 0.51 0.95 ± 0.05 0.22 ± 0.03 0.09 ± 0.06 Liver 2.32 ± 0.43 1.92 ± 0.90 0.99 ± 0.36 0.66 ± 0.12 0.19 ± 0.01 0.07 ± 0.01 Kidneys 5.23 ± 1.85 5.20 ± 0.93 2.18 ± 0.55 1.39 ± 0.27 0.45 ± 0.28 0.18 ± 0.09 Small intestine 0.72 ± 0.20 1.54 ± 0.11 1.00 ± 0.21 0.50 ± 0.57 0.14 ± 0.01 0.04 ± 0.02 Large intestine 0.52 ± 0.20 0.79 ± 0.21 0.88 ± 0.04 0.65 ± 0.71 0.11 ± 0.05 0.05 ± 0.01 Bladder 6.40 ± 4.40 1.62 ± 0.38 2.93 ± 2.01 1.57 ± 1.14 0.44 ± 0.33 0.44 ± 0.31 Fatty tissue 1.55 ± 0.53 1.19 ± 1.12 1.16 ± 0.89 0.53 ± 0.22 0.22 ± 0.06 0.10 ± 0.03 Data are expressed as %ID/g ± SD (n = 3 mice/group). Represented data are a selection from 19 different time points ranging from 20 s to 48 h.
- TABLE 4
Biodistribution Data of 123I-ChiB_E144Q in Infected nu/nu Mice 24 h After Injection
Biodistribution C. albicans A. fumigatus E. coli S. aureus Sterile inflammation A. fumigatus* Blood 0.70 ± 0.02 0.66 ± 0.05 0.92 ± 0.59 0.72 ± 0.13 0.66 ± 0.05 0.99 ± 0.31 Muscle 0.09 ± 0.01 0.11 ± 0.08 0.24 ± 0.16 0.10 ± 0.02 0.11 ± 0.08 0.27 ± 0.10 Abscess 1.91 ± 0.13 2.07 ± 0.01 0.47 ± 0.31 0.46 ± 0.26 0.60 ± 0.06 0.47 ± 0.19 Lung 0.37 ± 0.09 0.31 ± 0.02 0.42 ± 0.14 0.45 ± 0.04 0.47 ± 0.02 0.87 ± 0.07 Spleen 0.26 ± 0.03 0.18 ± 0.02 0.24 ± 0.03 0.31 ± 0.05 0.16 ± 0.02 6.37 ± 1.29 Kidney 0.61 ± 0.13 0.29 ± 0.04 0.41 ± 0.10 0.52 ± 0.10 0.26 ± 0.05 3.28 ± 1.08 Liver 0.35 ± 0.01 0.22 ± 0.02 0.23 ± 0.04 0.38 ± 0.05 0.16 ± 0.02 16.32 ± 3.83 Intestine 0.27 ± 0.04 0.07 ± 0.02 0.21 ± 0.09 0.23 ± 0.03 0.08 ± 0.02 0.41 ± 0.11 Bladder 1.60 ± 0.58 0.73 ± 0.33 0.57 ± 0.27 0.62 ± 0.27 0.41 ± 0.32 1.29 ± 0.32 Stomach 3.06 ± 1.57 0.82 ± 0.25 3.48 ± 2.55 2.47 ± 0.48 0.74 ± 0.25 2.16 ± 1.38 ↵* Results of 123I-BSA in A. fumigatus infection.
Data are expressed as %ID/g ± SD (n = 4 mice/group).
- TABLE 5
Comparison of T/NT and Target-to-Blood Ratios as Calculated from Biodistribution Data of Different Radioligands in Infected nu/nu Mice 24 h After Injection
Infection 123I-ChiB_E144Q 123I-BSA 67Ga Citrate C. albicans Muscle 20.62 ± 3.06 2.11 ± 0.57 4.83 ± 0.48 Blood 2.72 ± 0.25 0.59 ± 0.11 1.57 ± 0.07 A. fumigatus Muscle 15.16 ± 3.72 1.44 ± 1.69 5.59 ± 2.72 Blood 1.47 ± 0.22 0.60 ± 0.79 3.06 ± 1.26 E. coli Muscle 3.03 ± 2.30 1.69 ± 0.89 3.11 ± 1.28 Blood 0.57 ± 0.40 0.34 ± 0.14 1.43 ± 0.49 S. aureus Muscle 4.86 ± 2.62 ND ND Blood 0.62 ± 0.24 ND ND Sterile inflam. Muscle 5.31 ± 2.83 ND ND Blood 0.91 ± 0.81 ND ND ND = not determined; inflam. inflammation.
Data are expressed as %ID/g ± SD (n = 4 mice/group).


