


Abstract
PET with short inhalation of 15O-O2 provides regional oxygen extraction fraction (OEF) in a shorter acquisition time and with less radiation exposure than does the steady-state method. The purpose of this study was to test the accuracy of the short-inhalation technique for estimating OEF in healthy human volunteers. Methods: The final study population included 16 healthy volunteers, who underwent a series of dynamic PET scans consisting of short inhalation of 15O-CO, short inhalation of 15O-O2, and a bolus infusion of 15O-H2O to generate parametric images for cerebral blood volume (CBV), cerebral blood flow (CBF), OEF, and metabolic rate of oxygen (CMRO2). About 45 min before PET emission scanning, arterial and jugular blood was sampled through a catheter inserted in a radial artery and the right jugular bulb, respectively. PET-derived OEF (OEFpet) of the whole brain was compared with OEF calculated from the arteriovenous blood-sampling technique (OEFav). Results: Whole-brain-averaged CBF (mean ± SD) measured with PET was 0.40 ± 0.06 (range, 0.30–0.55) mL/g/min, CBV was 0.05 ± 0.01 (range, 0.04–0.09) mL/g, CMRO2 was 2.85 ± 0.39 (range, 2.35–3.84) mL/100 g/min, and OEFpet was 0.39 ± 0.06 (range, 0.30–0.51). OEFpet showed a slightly higher value than did OEFav (0.36 ± 0.05 [range, 0.29–0.46]), but the difference was not significant. The difference in the 2 measurements (OEFpet - OEFav) did not correlate with CBF (r = −0.16; P = not statistically significant [NS]), CBV (r = −0.20; P = NS), CMRO2 (r = −0.16; P = NS), partial arterial oxygen pressure (r = 0.29; P = NS) or partial arterial carbon dioxide pressure (r = −0.17; P = NS). Conclusion: Compared with the arteriovenous blood-sampling technique, a technique using short inhalation of 15O-O2 did not significantly over- or underestimate global OEF in healthy human volunteers. The PET technique reasonably estimated the cerebral OEF in local brain tissues of healthy human volunteers.
- PET
- arteriovenous oxygen difference
- oxygen extraction fraction
- short inhalation of oxygen gas
- validation
Cerebral oxygen extraction fraction (OEF) provides important information for patient management and prediction of outcome (1). OEF can be estimated at bedside using arteriovenous oxygen difference (AVDO2), which has been applied as a clinical index of cerebral ischemia (2). However, recent investigations suggested that ischemia might be restricted to regional areas, rather than being a global pathology (3). The conventional Kety-Schmidt technique cannot provide information about regional cerebral ischemia.
Kinetic models for 15O-O2 and PET allow regional assessment of OEF. In particular, the short-breath inhalation method based on Kety’s 1-compartment model enables regional assessment of OEF in a shorter acquisition time and with a lower radiation dosage than does the steady-state method (4–11). As reported previously, these methods are less affected by tissue heterogeneity than is the steady-state method but still have technical difficulties, including correction for dead time, decay and dispersion, and rapid separation of plasma from whole-blood samples (8–10,12,13). In addition, the reliability of estimation depends on the model describing the kinetic behavior of 15O-O2 and the pathologic condition of the brain tissue (14). Despite the known problems, the short-inhalation method has been clinically applied to investigate regional oxygen metabolism (15–18).
The purpose of this study was to assess the accuracy of the current PET technique for estimating OEF. Data distribution and error range of PET-derived OEF (OEFpet) were evaluated by comparing the values obtained from OEF measurement with those obtained from the catheter-derived arteriovenous approach (OEFav). The evaluated PET technique in the present study was based on the model originally described by Mintun et al., which assumed that the concentration of capillary 15O-O2 is equal to the arterial concentration and that a fraction of the delivered oxygen tracer is extracted from the capillary volume (10). Cerebral blood flow (CBF) and cerebral blood volume (CBV) were obtained from separate PET scans, leaving OEF to be the single estimated parameter (14).
MATERIALS AND METHODS
Subjects
Twenty-seven healthy volunteers were recruited (July 2000 to March 2002) to undergo a PET study protocol. The inclusion criteria for recruitment were age > 18 y, no history of head injury, no history of neurologic or psychiatric disease, and no current medication or drug use known to affect cerebral metabolism. From this control group, the studies of 16 subjects (12 male, 4 female) were included. The studies of 11 subjects were not included in the analysis: One was not included because of inappropriate preparation (prolonged fasting) of a volunteer; 6, because of significant head movement during PET imaging; 2, because of a cross-calibration error between the PET scanner and well counter timer; and 2, because of lack of jugular venous sampling data. The mean age was 35 ± 8 y (range, 21–46 y). All study procedures were performed with the informed consent of the subjects and with the approval of the UCLA Institutional Review Board and the UCLA Radiation Safety Office.
Study Protocol
Subjects underwent measurement of arteriovenous oxygen concentration, followed by a series of PET studies that consisted of 3 separate emission scans (15O-labeled CO, H2O, and O2) and MRI. Subjects were requested to take a regular meal in the morning so that they would be in a mild preprandial condition during the PET scan (PET scans were scheduled at least 2 h after the meal). Plasma glucose level and arterial gas were measured just before the transmission scan to confirm that the subjects were in a normal resting condition. Completion of all study procedures within a single day was planned.
AVDO2 Measurement
With the subjects under local anesthesia, a 5-French Cordis catheter (Baxter Health Care) was inserted in the right femoral vein using a standard guidewire and fluoroscopic technique. The tip of the catheter was placed at the right jugular bulb, and placement was confirmed using fluoroscopic angiography. Upon successful insertion of the jugular venous catheter, the subjects were transferred to the PET preparation room. An arterial catheter was inserted into the radial artery at the wrist of either side. A pair of blood samples was taken from both arterial and jugular venous catheters just before the transmission scan. Hemoglobin (Hb), partial arterial and venous oxygen pressure (PaO2 and PvO2, respectively), and partial arterial and venous saturation (SaO2 and SvO2, respectively) were measured by the UCLA clinical laboratory. The arterial oxygen content (CaO2) and venous oxygen content (CvO2) were calculated as follows (19):

 AVDO2 and OEFav were calculated as follows:


PET
Lights in the room were dimmed and the subjects were kept under unstimulating conditions. First, a transmission study was obtained for attenuation correction, followed by a set of dynamic acquisitions and serial arterial blood sampling. Each emission scan was started immediately after a single-breath inhalation of CO or O2 or after a bolus injection of H2O. The order of emission scans was fixed (CO 1st, O2 2nd, and H2O 3rd) for all subjects. Administered doses were ∼555 MBq for all tracers. The acquisition protocol consisted of 6 frames (6 × 60 s) for CO and 26 frames each (6 × 5 s, 9 × 10 s, 6 × 30 s, and 5 × 60 s) for O2 and H2O. The total acquisition time was 6 min for CO and 10 min for O2 and H2O. All dynamic PET images were obtained with concurrent blood sampling via an arterial catheter. Arterial blood was sampled at 4 time points (4 × 1 min, after 2 min 50 s) for CO, at 14 time points for O2 (time zero [time of tracer administration], 6 × 20 s, 4 × 30 s, 1 × 60 s, and 2 × 150 s), and at 15 time points for water (time zero, 5 × 12 s, 3 × 20 s, 2 × 30 s, 2 × 60 s, and 2 × 150 s). For the 15O-O2 study, the arterial blood samples were divided into 2 vials per sample. One was centrifuged and the plasma component was pipetted. Both vials were immediately analyzed for total 15O activity with a calibrated well counter. The 15O-H2O component in the whole-blood time-activity curve was corrected to give the time-activity curves of 15O-O2 in blood (10). All samples were corrected for radioactive decay back to time zero. At the end of all PET scanning, another arterial sample was collected for measurement of oxygen content during the PET study.
PET data were acquired with an ECAT HR+ scanner (Siemens/CTI) in 3-dimensional acquisition mode (with collimating septa retracted). To minimize the effect of scatter originating from activity out of the field of view, a lead shield annulus (Neuro-Insert; CTI) of 9-mm thickness and 35-cm aperture diameter was manually installed on the scanner before the PET studies. The scanner produces 63 planes covering an axial field of view of 15.5 cm. The intrinsic spatial resolution of the scanner is 4.3 mm in full width at half maximum at the center of the central axis of the gantry. Acquired image sets were corrected for scatter using single-scatter simulation technique (20) and reconstructed with a filtered backprojection algorithm using a Hanning filter (cutoff frequency of 0.3 cycle per projection element) to generate 128 × 128 matrices. Spatial resolution of the resulting images was ∼5.5 mm in full width at half maximum. All dynamic scans were corrected for dead time, attenuation, scatter, and decay before image reconstruction.
Image Analysis
To obtain OEF from PET studies, parametric images for CBF and CBV were first generated by applying established kinetic models to each pixel of dynamic PET data and arterial input functions.
First, the parametric image of CBV was generated from the CO dynamic images and the arterial input curve using a single-breath inhalation method (21). The ratio of small-vessel hematocrit to large-vessel hematocrit was set at 0.85, and a relative weight of blood of 1.04 mg/mL was used. The parametric image of CBF was calculated using a 1-compartment (2 parameters: K1 and k2) kinetic model of 15O-H2O. The first-pass extraction fraction of water was fixed at 0.85. Noise in the CBF images was controlled using a ridge-regression method (22). Quantitative values of cerebral metabolic rate of oxygen (CMRO2) and OEF were determined on the basis of a compartmental model of 15O-O2 (10,14,23) that consisted of 4 variable parameters: perfusion (F), distribution volume (V), vascular volume (Vb), and OEF (E). According to this model, the kinetics of 15O radioactivity in tissue can be described by the following differential equation:
 where Co is the blood time-activity curve of 15O-O2, Cw is the time-activity curve of 15O-H2O, and Ctot is the total 15O radioactivity in tissue (including vascular activity) that corresponds to the regional dynamic PET measurements, M(t). E can be calculated by the following equation, which was originally derived by Mintun et al. (10).


 where T1 and T2 are, respectively, the beginning and ending time of a dynamic PET scan and * denotes the mathematic operation of convolution. The derivation of the above equation was described previously (10,23).
In our implementation, values of Vb and F were obtained from the CBV and CBF parametric images determined previously for the corresponding plane locations. A fixed value of 0.85 was used for V. Values of T1 and T2 in the integrals were first assigned for scanning intervals of (2,2.5), (2.5,3), (3,3.5), (3.5,4), (4,4.5) and (4.5,5) (in minutes) to calculate different A(T1,T2) and B(T1,T2)s to form the following vector equation:


Weighted regression (with weights W accounting for time-interval difference and physical decay) was then used to determine the final estimated OEF from the multiple measurements of the different time intervals, as:

Parametric images of CMRO2 were obtained as the product of OEF and CBF parametric images of the corresponding plane locations (Fig. 1).

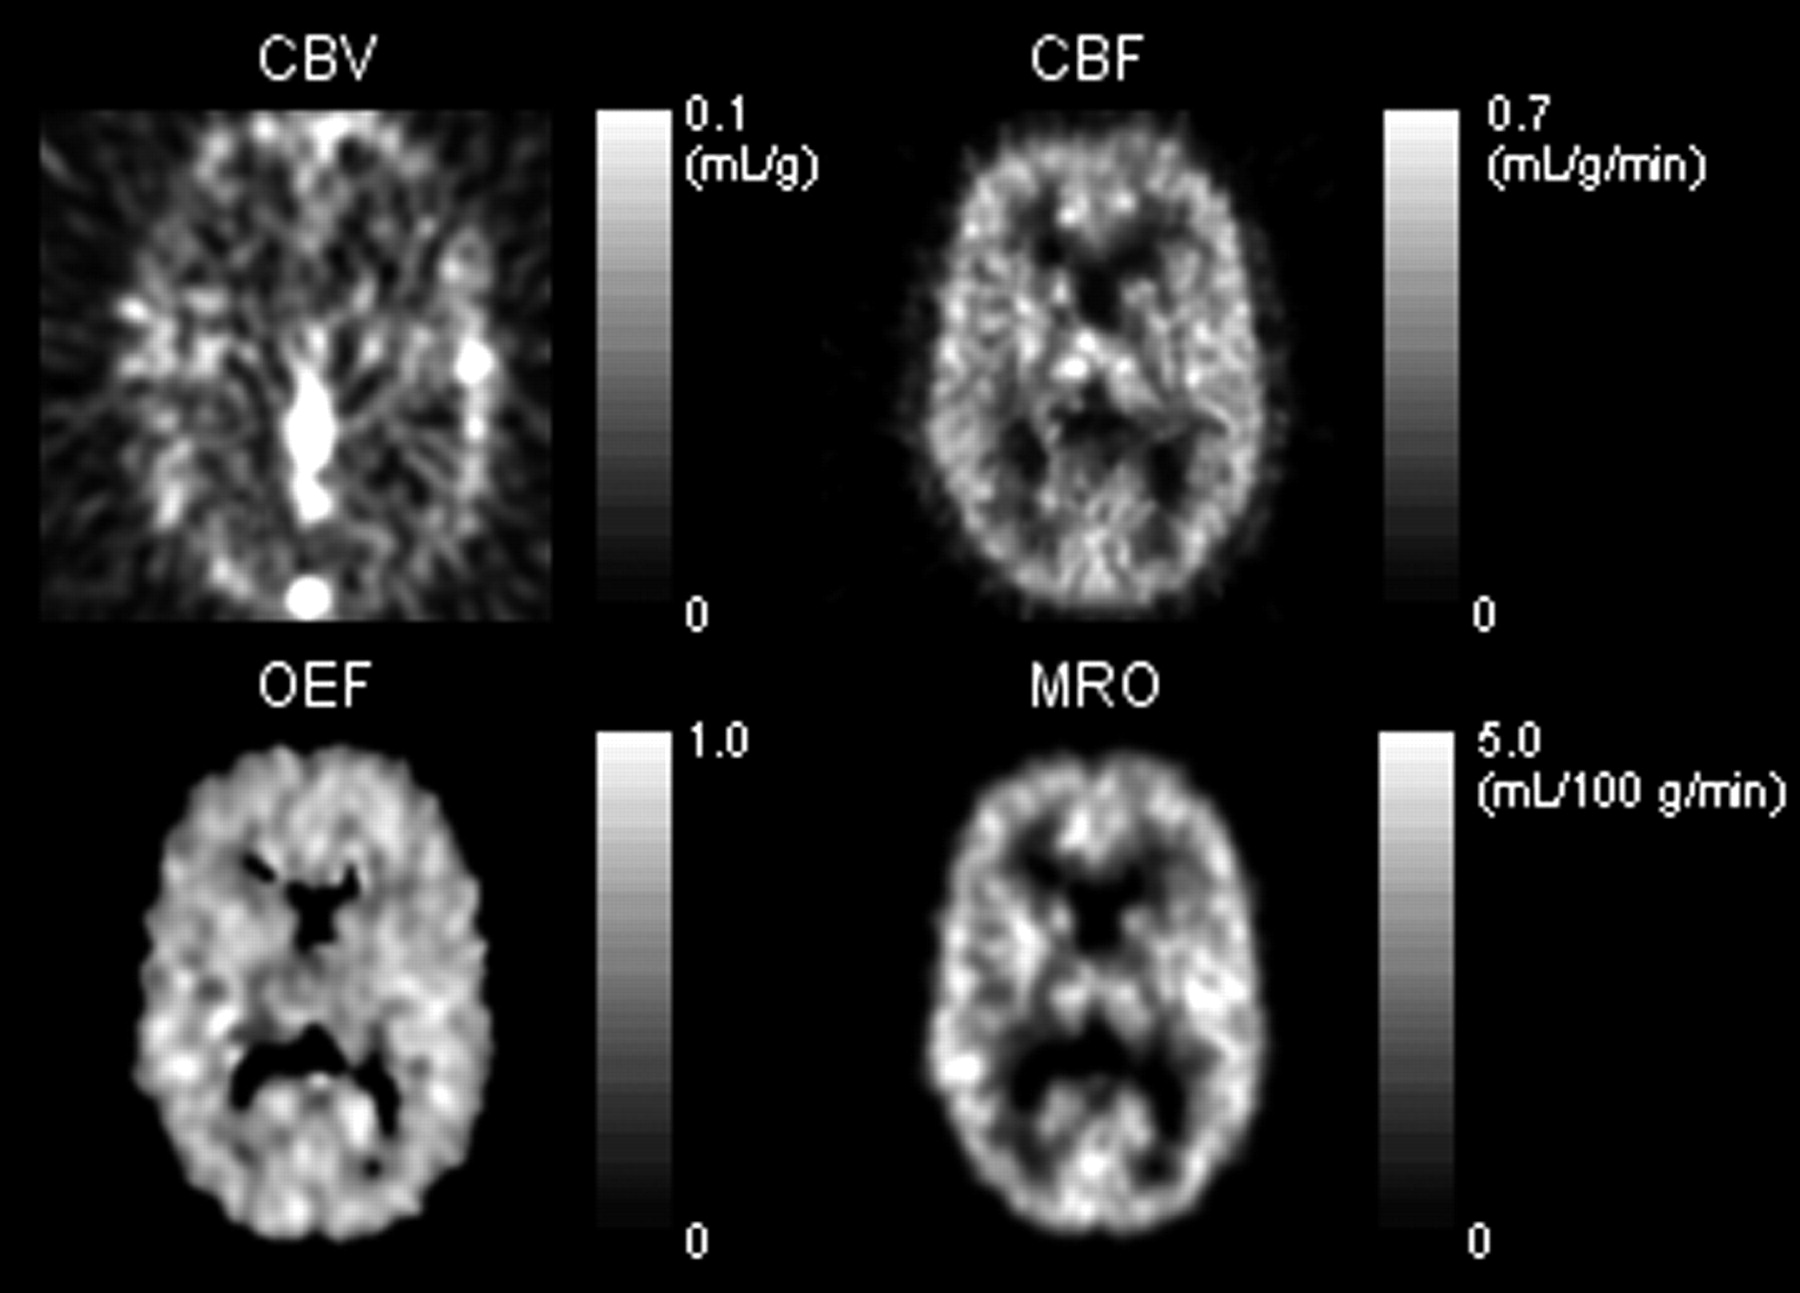
Example of parametric images. Parametric images of CBV (top left) and CBF (top right) were used to generate OEF image (bottom left). Parametric image for CMRO2 (bottom right) was generated by applying the following formula to each pixel: CMRO2 = CaO2 × OEF × CBF.
The delay of the arterial time-activity curve was calculated in the 15O-H2O study by minimizing the residual sum of square of model fitting to the whole-brain time-activity curve. The same value was applied to correct the delay of the 15O-O2 study. With this procedure, dispersion of input function was combined with that of delay and was not separately corrected. To obtain OEF for the whole brain, a set of regions of interest (ROIs) was placed to include all brain structures. ROIs were placed on the parametric image of CBF with reference to a coregistered MR image. Each ROI was manually drawn so as to trace the border of the brain from the top of the cerebral hemisphere to the upper half of the cerebellar cortex. To obtain average whole-brain parametric values for CBV, CBF, and CMRO2, the sum of parametric values inside all ROIs were divided by the number of pixels in these ROIs. The whole-brain value of OEF was calculated as a ratio of:

Contributions due to nonbrain tissue included in the ROIs were in both the numerator and the denominator, and their effects were thus minimal.
Statistical Analysis
Differences between 2 groups were investigated using the Student t test. The correlation of 2 continuous variables was investigated using the Pearson correlation coefficient. The level of significance was set at P < 0.05.
RESULTS
Table 1 shows the PET results. The PET emission scan was started within 45 min of the AVDO2 measurements. Between the time of the AVDO2 and PET measurement, there was no significant change in Hb (14.0 ± 1.7 and 13.9 ± 1.8 mg/dL, respectively, P = not statistically significant [NS]), hematocrit (0.41 ± 0.04 and 0.40 ± 0.04, respectively, P = NS), SaO2 (97.3% ± 0.9% and 97.4% ± 0.8%, respectively, P = NS), PaO2 (94.6 ± 12.2 and 94.8 ± 7.3 mm Hg, respectively, P = NS), or PaCO2 (40.8 ± 3.6 and 41.3 ± 3.3 mm Hg, respectively, P = NS).
Results of PET and Arteriovenous Measurements
The mean ± SD of whole-brain-averaged measurements with PET was 0.40 ± 0.06 (range, 0.30–0.55) mL/g/min for CBF, 0.05 ± 0.01 (range, 0.04–0.09) mL/g for CBV, 2.85 ± 0.39 (range, 2.35–3.84) mL/100 g/min for CMRO2, and 0.39 ± 0.06 (range, 0.30–0.51) for OEF.
The mean ± SD of measurements with blood samples was 18.5 ± 2.3 (range, 14.5–24.4) mL/dL for CaO2, 11.8 ± 1.7 (range, 9.5–16.8) mL/dL for CvO2, 6.7 ± 1.2 (range, 4.7–9.2) mL/dL for AVDO2, and 0.36 ± 0.05 (range, 0.29–0.46) for OEF.
Figure 2A shows a plot of OEFpet against OEFav. The data points in the scatter diagram form a single cluster around the mean values of the 2 measurements. Bland-Altman plotting of the 2 measurements (Fig. 2B) demonstrates the agreement between the 2 approaches, showing neither significant overestimation nor significant underestimation and no systematic error in average OEF. Difference in the 2 measurements (OEFpet - OEFav = 0.03 ± 0.08) did not correlate with CBF (r = −0.16, P = NS), CBV (r = −0.20, P = NS), CMRO2 (r = −0.16, P = NS), PaO2 (r = 0.29, P = NS), or PaCO2 (r = −0.17 P = NS).

(A) Agreement of OEFpet and OEFav. The cross-line indicates the mean value for OEFpet and OEFav. (B) Bland-Altman plot of the same data.
DISCUSSION
The PET technique using a short inhalation of 15O-O2 reasonably estimated cerebral OEF in healthy human volunteers. The measured whole-brain average value of OEF did not differ significantly from the value measured with invasive arteriovenous difference technique. The 2 measurements showed comparable ranges of distribution, without systematic over- or underestimation.
Since Mintun et al. reported the original dynamic 15O-O2 PET method in 1984, the technique has been used for measurement of CMRO2 and OEF (10). However, accuracy has not been directly evaluated in humans. Previous investigations tested accuracy in animals (baboons and macaques), but animal experiments may not represent the condition for human PET studies (10,24). For example, animal experiments use anesthesia, whereas PET studies on healthy humans are usually done without medication. Anesthesia, because it suppresses CBF and metabolism (25–27), may affect the ratio of venous flow from intracranial or extracranial tissue to the jugular bulb, causing dissociation between PET and arteriovenous OEF measurements. In addition, the smaller size of animal brains may result in a different partial-volume effect on PET data. To our knowledge, the present study was the first to assess the accuracy of the dynamic 15O-O2 PET technique for CMRO2 measurement in healthy humans under physiologic conditions. Therefore, the result of the present study is considered to be independent of the problems stemming from technical and physiologic differences between animal and human brains.
The OEF derived from PET in the present study was 0.39 ± 0.06. This value is lower than some previous values obtained with methods using a single inhalation of O2 (23,28) but is consistent with generally accepted reported values for healthy subjects (17,29). As discussed in the previous study (14), the single-step approach of an 15O-O2 study, though less susceptible to physiologic changes, is less robust for estimating parameters that are not totally independent (14). For the 3-step approach, on the other hand, the result may be affected by errors originating in CBV and CBF estimation. For example, reports indicate that 15O-H2O may underestimate CBF because of the limited permeability of water across the blood-brain barrier (30). We corrected the permeability limitation by adopting the fixed first-pass extraction fraction of 0.85, which has been validated within normal physiologic flow ranges (30,31). However, the extraction fraction of water may need adjustment to estimate CBF in pathologic conditions.
OEFpet was slightly higher than the value measured with arteriovenous differences (0.36 ± 0.05, P = NS). The data spreads were similar for both measurements. Slight (but nonsignificant) overestimation was a consistent finding with previous animal experiments (24). The difference was smaller in the present human study, which showed a mean percentage error of 8%, versus the 19% found in animal studies. Altman et al. attributed the difference in animal studies to contamination of jugular venous blood by venous flow from extracranial tissue, which has an extremely low OEF in arteriovenous measurements (24). This explanation seems applicable also to the present study. The difference was smaller in the present study, probably because the intracranial component is greater in humans. Also, PET data were acquired in the present study under normal physiologic conditions, which are believed to include higher intracranial blood flow than are conditions under anesthesia. Obtaining venous samples from the cerebral sinus should eliminate contamination from extracranial venous flow. However, the procedure is more invasive than jugular venous sampling and may cause ischemic or hemorrhagic complications (32,33).
The present study failed to show a significant trend toward correlation of OEF between PET and arteriovenous measurements. The lack of correlation was most likely due to relatively large measurement errors, compared with the true physiologic variation among healthy subjects. In the present study, application of a 3-step approach might have introduced an estimation bias to OEF because of physiologic changes between scans. The physiologic changes might have resulted in errors in the estimated OEF value and have accounted for some of the data scatter observed. The error might become more serious if it were to occur systematically among different subjects. Ideally, the ordering of the 15O scans should be randomized to minimize any systematic error. However, it was unlikely to have been a serious problem in the present study, considering the total acquisition time of less than 1 h for all 3 emission scans and the fact that many institutions continue to use the 3-step approach (short-time inhalation or constant infusion) (13,17,29). The accuracy shown in the present study further supports the adequacy of such an approach.
The range of OEF measurements in the present study was small because all subjects were healthy volunteers. In fact, not only the mean values of the 2 measurements but also the distribution of the samples were similar for both OEF measurements, suggesting that the errors of the 2 measurements for estimating global OEF were comparable. Because arteriovenous technique is considered reliable for measuring OEF, with relatively fewer assumptions compared with the PET method (34), the result of the present study should support the reliability of the absolute value obtained from the PET technique. Adding patient data with low or high OEF is expected to show a significant positive correlation between the 2 measurements.
The difference in OEF between PET and arteriovenous measurements did not show a trend toward correlation with CBF, CBV, CMRO2, PaO2, or PaCO2. The present algorithm of OEF estimation requires values of CBV and CBF from separate PET scans, whereas the PET-derived CBF value may underestimate the true blood flow in cases of very high CBF (>0.5 mL/g/min) (30). Underestimation of CBF is expected to cause an overestimation of OEF. If underestimation of CBF had been significant in the present study, the difference in the 2 OEF measurements should have shown a systematic error and would have correlated with CBF. Lack of correlation between the difference in the 2 OEF measurements and CBF, therefore, may indicate the reliability of the current algorithm for estimating CBF, which assumed a first-pass extraction fraction of 0.85 for labeled water in healthy volunteers. In addition, OEF measured with PET can be considered reliable when CBF is in the reference range.
CONCLUSION
Compared with the arteriovenous blood-sampling technique, a technique using short inhalation of 15O-O2 did not significantly over- or underestimate global OEF in healthy human volunteers. The range of measurement error with the PET technique was comparable to that with the arteriovenous blood-sampling method, and the difference in the values from the 2 techniques was independent of CBF, CBV, CMRO2, PaO2, and PaCO2. The technique using short inhalation of 15O-O2 can reasonably estimate cerebral OEF in healthy humans.
Acknowledgments
This study was supported by NINDS 30308, the Lind Lawrence Foundation, and grant DE-FC03-02ER63420 from the Department of Energy.
Footnotes
Received Aug. 27, 2003; revision accepted Dec. 12, 2003.
For correspondence or reprints contact: Naoya Hattori, MD, PhD, Box 956948, Los Angeles, CA 90095-6948.
E-mail: nhattori{at}mednet.ucla.edu
REFERENCES
In this issue


Jump to section
Related Articles
Cited By...
- Mathematical modeling of the influence of ACE I/D polymorphism on blood pressure and antihypertensive therapy
- Measurement of oxygen extraction fraction by blood sampling to estimate severe cerebral hemodynamic failure and anticipate cerebral hyperperfusion syndrome following carotid artery stenting
- Cortical Cerebral Blood Flow, Oxygen Extraction Fraction, and Metabolic Rate in Patients with Middle Cerebral Artery Stenosis or Acute Stroke
- 15O PET Measurement of Blood Flow and Oxygen Consumption in Cold-Activated Human Brown Fat
- Evaluation of MR-Derived Cerebral Oxygen Metabolic Index in Experimental Hyperoxic Hypercapnia, Hypoxia, and Ischemia