


Abstract
The novel, dedicated small animal PET tomograph, quad-HIDAC, offers submillimeter resolution in instrumental characterization experiments. The aim of this study was to establish the tomograph’s utility in a biologic application and to demonstrate the feasibility of rapid dynamic neuroreceptor imaging in mice. Methods: We used the well-established, high-affinity dopamine D2 receptor PET ligand 18F-fallypride for imaging striatal D2 receptors in NMRI mice. Dynamic PET data were acquired using the quad-HIDAC tomograph and subject to 2 different kinetic modeling approaches. The cerebellum, a brain region devoid of D2 receptors, was chosen as a reference region for kinetic modeling. Results: The resolution of the quad-HIDAC camera allowed clear visualization of the left and right mouse striatum with high target-to-nontarget signal ratios. The sensitivity of the tomograph permitted the generation of time-activity curves with initial time frames of 120 s. PET experiments acquiring data for 150 min demonstrated that the binding potential of 18F-fallypride could be fitted robustly with both reference tissue models for scan durations of ≥40 min. Voxel-wise modeling resulted in parametric maps of high quality. The values for the binding potential in the striatum reached approximately 14, consistent with striatum-to-cerebellum ratios extracted from regional time-activity curves. Comparison of in vivo PET imaging results with ex vivo postmortem tissue sampling analyses indicated discrepancies in signal intensity, possibly resulting from scatter and random background in the cerebellum region of interest and leading to an overestimation of cerebellar activity concentrations and degradation of striatum-to-cerebellum ratios in PET experiments. Intraperitoneal injection of the unlabeled D2 receptor antagonist haloperidol 30 min before intravenous injection of 18F-fallypride blocked tracer accumulation in the striatum by >95%. Conclusion: The quad-HIDAC camera represents a powerful tool for future dynamic neuroreceptor PET studies in mice and rats under numerous pharmacologic or pathophysiologic conditions.
Recent advances in PET camera technology have provided dramatic improvements in small animal imaging (1–3). The novel, dedicated small animal PET camera, quad-HIDAC, based on multiwire proportional chamber technology, yields a spatial resolution of <1 mm3 as well as a detection efficiency of 1.1% (corrected for randoms and dead time) in instrumental validation experiments (4). Given these features, the visualization of smaller structures in the mouse brain and dynamic neuroreceptor imaging can be addressed. Dynamic PET scanning of small animals offers many new possibilities for biomedical research. These include the extraction of quantitative or semiquantitative data from physiologic processes and the application of tracer kinetic modeling in small brain regions to assess pharmacokinetically important parameters such as the binding potential (BP) (5–9). However, dynamic PET has the disadvantage of reducing the number of coincidences per time frame, possibly leading to insufficient statistical robustness of data. Dynamic studies of neuroreceptor ligands in small animals are limited particularly by the size of the target structure and the count statistics. In the mouse, the striatum is a tiny brain region with a volume of <20 mm3, thus demanding high-resolution PET for its clear-cut visualization. Lower resolution tomographs were not able to resolve left and right striatum or to separate the mouse brain from neighboring intraorbital lacrimal glands, which accumulate many tracers nonspecifically (10,11). In larger animals, the visualization of the striatum has been achieved by the use of appropriate PET ligands for the dopamine transporter and dopamine D2 receptor (12–18). Recently, SPECT tracers have been applied to imaging of the mouse striatum (19,20), but PET tracers have been used only with limited success.
Imaging the mouse striatum represents a major application in biomedical research. The dopamine D2 receptor system, for example, is implicated in a wide range of neurologic and psychiatric disease states and forms the main target of antipsychotic drug treatment. Moreover, degeneration of dopaminergic nerve terminals in the striatum is a hallmark in animal models of Parkinson’s disease. Therefore, the capability to resolve the mouse striatum by PET and to perform dynamic neuroreceptor imaging in small brain regions could have important impact on the noninvasive characterization of neurodegenerative diseases in animal models and on drug development—for example, for Parkinson’s disease.
The dopamine receptor antagonist 18F-fallypride {(S)-N-[(1-allyl-2-pyrrolidinyl)methyl]-5-(3-18F-fluoropropyl)-2,3- dimethoxybenzamide} represents an ideal candidate for visualization of the striatum. This PET tracer was previously shown to be an extremely selective, high-affinity ligand (dissociation constant [Kd] = 30 pmol/L) for the dopamine D2 and D3 receptor subtypes (15,21). In nonhuman primate PET studies, 18F-fallypride proved to bind selectively to dopaminergic sites, providing high specific-to-nonspecific ratios (14,15). Binding of 18F-fallypride in vivo was specifically blocked in the presence of dopamine D2 receptor antagonists such as haloperidol (15,22).
In this study, we examined whether the resolution and sensitivity of the quad-HIDAC camera permits accurate dynamic measurements of D2 receptor binding sites in the mouse brain using the PET tracer 18F-fallypride.
MATERIALS AND METHODS
Animals
Animal care and all experimental procedures were approved by the Swiss Federal Veterinary Office. Male NMRI mice (32–49 g; RCC) for PET and postmortem biodistribution studies were allowed free access to food and water.
Radioligand Preparation
The radiosynthesis of 18F-fallypride was performed according to the protocol of Mukherjee et al. (21). The radioligand was produced in batches of 275–1,057 MBq, with activity concentrations of 30–117 MBq/mL and specific activities of 27–208 GBq/μmol at the end of synthesis. The injected masses were 2.5–4.4 nmol/kg body weight or 30–76 ng.
PET Scanning
PET experiments were performed with the 16-module variant of the quad-HIDAC tomograph (Oxford Positron Systems). Briefly, the camera has 4 detector banks, each comprising 4 high-density avalanche chamber (HIDAC) modules. Each module consists of a multiwire proportional chamber between lead layers containing a matrix of holes of 0.4 mm in diameter and 0.5-mm pitch (4). The field of view is 280 mm axially and 170 mm in diameter, allowing the acquisition of whole-body images in a single bed position. Animals were anesthetized with isoflurane in an air/oxygen mixture, fixed with adhesive tape, and positioned in the camera such that the head was placed symmetrically in the center of the field of view. Depth of anesthesia was monitored by measuring respiratory frequency. Body temperature was controlled by a rectal probe and kept at 37.3°C by a thermocoupler and a heated air stream. The time point of radioligand injection into the animal constituted the reference time point for all further procedures and decay corrections. 18F-Fallypride (2.8–8.6 MBq; 2.5–4.4 nmol/kg body weight; maximum, 200 μL) was injected via a lateral tail vein. Acquisition of PET data was initiated 60 s later. PET data were acquired in list mode and reconstructed in user-defined time frames using the OPL-EM algorithm (23) with a bin size of 0.3 mm, a matrix size of 120 × 120 × 200, and resolution recovery with a width of 1.3 mm. Reconstruction did not include scatter, random, and attenuation correction. Scattering between modules, constituting 21% of the counting rate corrected for randoms and dead time in phantom studies, and random coincidences, constituting a maximum of 41% at the highest count rates, produced a uniform background and did not appear to distort the reconstructed images. Absorption and scattering in a mouse represent small corrections—20% and 7%, respectively—to the count rates.
Dynamic Modeling
Image files were evaluated by region-of-interest (ROI) analysis using the dedicated software Pmod (24). Summed PET images were used to draw the ROIs. Time-activity curves were normalized to the injected dose per gram body weight and expressed as standardized uptake values (SUVs).
Receptor quantification relied on the cerebellum as a reference region devoid of dopamine D2 receptors. The following models were used to derive estimates for the BP of 18F-fallypride in the striatum:
Simplified Reference Tissue Model.
Lammertsma and Hume (25) describe the BP of a receptor radioligand in a specific region by the following equation:
 Eq. 1 where the parameters BP, k2, and R1 are fitted to the PET measures of radioactivity concentrations in the striatum (CRc(t)) and in the cerebellum (CRf(t)). R1 reflects the ratio between K1 in the striatum and the cerebellum, and k2 describes tracer washout in the striatum from the nonspecific compartment into plasma. BP is the parameter of interest; it is related to the distribution volume ratio (DVR) of the striatum and the cerebellum via BP = DVR − 1. For clarity, we designate the BP as obtained by the simplified reference tissue model as BPRf in this work.
Ichise Method.
In principle, this kinetic modeling method, first described by Ichise et al. (26), uses Logan plots (27) of the striatum and cerebellum that are combined into one equation and the arterial input curve can be eliminated algebraically, yielding the following multilinear expression:
 Eq. 2
Eq. 2
The parameters A, B, and C are fitted to the PET measures of the radioactivity concentrations in the striatum (CRc(t)) and in the cerebellum (CRf(t)); the parameter A is related to DVR. Assuming that nonspecific binding in the striatum and the cerebellum are equal implies the relation:
 Eq. 3
Eq. 3
Rv, the ratio of volumes of the tissue compartments 2 and 3, is related to the DVR of the striatum and the cerebellum in a standard receptor 3-compartment model as Rv = DVR − 1. Because little computational work is required for multilinear regression of Equation 2 and the fits are very robust, we performed a voxel analysis resulting in parametric Rv images.
Experimental Protocols
For the initial assessment of spatial and dynamic resolution, data were acquired in 2 mice for 150 min upon injection of 18F-fallypride. Static 18F-fallypride images were reconstructed from a single 40-min time frame (20–60 min after scan start), whereas evaluation of dynamic acquisitions of 18F-fallypride PET imaging involved 24 time frames (5 × 2 min, 10 × 5 min, 9 × 10 min) for reconstruction.
For the determination of the minimal scan duration required to obtain a time-independent estimate of the BP, increasing numbers of time frames from the two 150-min PET scans were used.
To assess the feasibility of repeated dynamic neuroreceptor imaging in a single animal, 3 18F-fallypride PET scans each were performed on days 0, 30, and 60 with 2 mice. Acquisition of PET data lasted for 60 min. Fifteen time frames (5 × 2 min, 10 × 5 min) were used for reconstruction.
In haloperidol-blocking studies, 3 baseline animals received intraperitoneal injections of vehicle (β-cyclodextrin; Fluka) 30 min before injection of the radioligand, whereas blocking conditions in 3 mice involved intraperitoneal injection of haloperidol (1 mg/kg body weight, dissolved in β-cyclodextrin; Sigma-Aldrich) 30 min before radioligand injection. Data were acquired for 60 min after injection of 18F-fallypride and were reconstructed in 15 time frames (5 × 2 min, 10 × 5 min).
BPs obtained by application of the Lammertsma reference tissue model were compared with striatum-to-cerebellum ratios of postmortem dissection data. Three animals were killed by decapitation immediately after a 60-min PET scan, and 2 animals were decapitated after termination of a 150-min PET scan. To analyze the influence of anesthesia on signal sizes and ratios, 3 nonanesthetized animals were injected with the radiotracer and killed at 63 min after injection by decapitation. All mouse brains were removed on ice, and striatum and cerebellum were dissected. All samples were weighed and measured in a γ-counter (Minaxi; Packard). A reference sample of the injected dose was prepared and quantified in a counter to convert counts/minute into becquerels. Data were decay corrected from the reference time and expressed as the percentage normalized injected dose per gram organ weight (% normalized ID/g organ).
RESULTS
PET Images and Quantification
Injection of 2.8–8.6 MBq 18F-fallypride in mice with data reconstruction from 20 to 60 min after injection resulted in high-resolution images of the mouse striatum with clear localization of radioactivity in the striatum and high signal-to-noise ratios (Fig. 1A). The reconstructed resolution of the tomograph was sufficient to distinguish right and left striatum. Lower activity concentrations were identified in extrastriatal regions, possibly representing the thalamus and the olfactory bulb. The cerebellum, a brain region devoid of D2 receptors, revealed a very low activity concentration (slices not shown). Uptake of activity above background was also identified in the skull.

(A) Series of coronal sections (ventral to dorsal; slice thickness, 0.3 mm) through the striatum of a mouse injected with 18F-fallypride. The images were obtained by reconstructing data from 20 to 60 min after injection. (B) Representative example of time-activity curves in the striatum (▪) and the cerebellum (□) for a 150-min PET experiment. (C) Coronal view of a paramatric Rv image with maximum Rv values of 14 in the striatum (st). Lower values were found in brain regions possibly representing the thalamus (th) and olfactory bulb (bu).
The sensitivity of the tomograph allowed the generation of time-activity curves in the striatum and cerebellum with initial time frames of 120 s (Fig. 1B). The radioligand was rapidly taken up in the D2 receptor regions of the striatum, reaching a plateau at approximately 40 min after injection. In contrast, activity in the cerebellum displayed fast washout and very small activity concentrations at later time points.
Voxel modeling of kinetic data using the Ichise method yielded functional images of the Rv value (Fig. 1C). The parametric Rv map represents the BP; it showed highest values in the right and left striatum (Rv = 14.2) and considerably lower Rv values in brain areas putatively representing the thalamus and olfactory bulb.
Minimal Scanning Time
Estimation of the BP as a function of scan duration resulted in stable fits for a scanning time of ≥40 min (Fig. 2). Both the Lammertsma and the Ichise method gave similar results for the BP, with values between 12.8 and 15.4 for both the right and left striatum (Table 1). Since estimates of the BP were stable for scan durations of ≥40 min, a scanning time of 60 min was used for subsequent dynamic 18F-fallypride PET imaging experiments.

Estimation of the BP as a function of scan duration for a PET experiment with 150-min scanning time. The BP in the right striatum (□, ▵) and the left striatum (▪, ▴) was calculated by 2 different kinetic modeling approaches, the Lammertsma simplified reference tissue model (BPRf; □, ▪) and the Ichise method (Rv; ▵, ▴).
Summary of PET BPs, Activity Concentrations, and Striatum-to-Cerebellum Ratios
Repeated PET Studies in the Same Animal
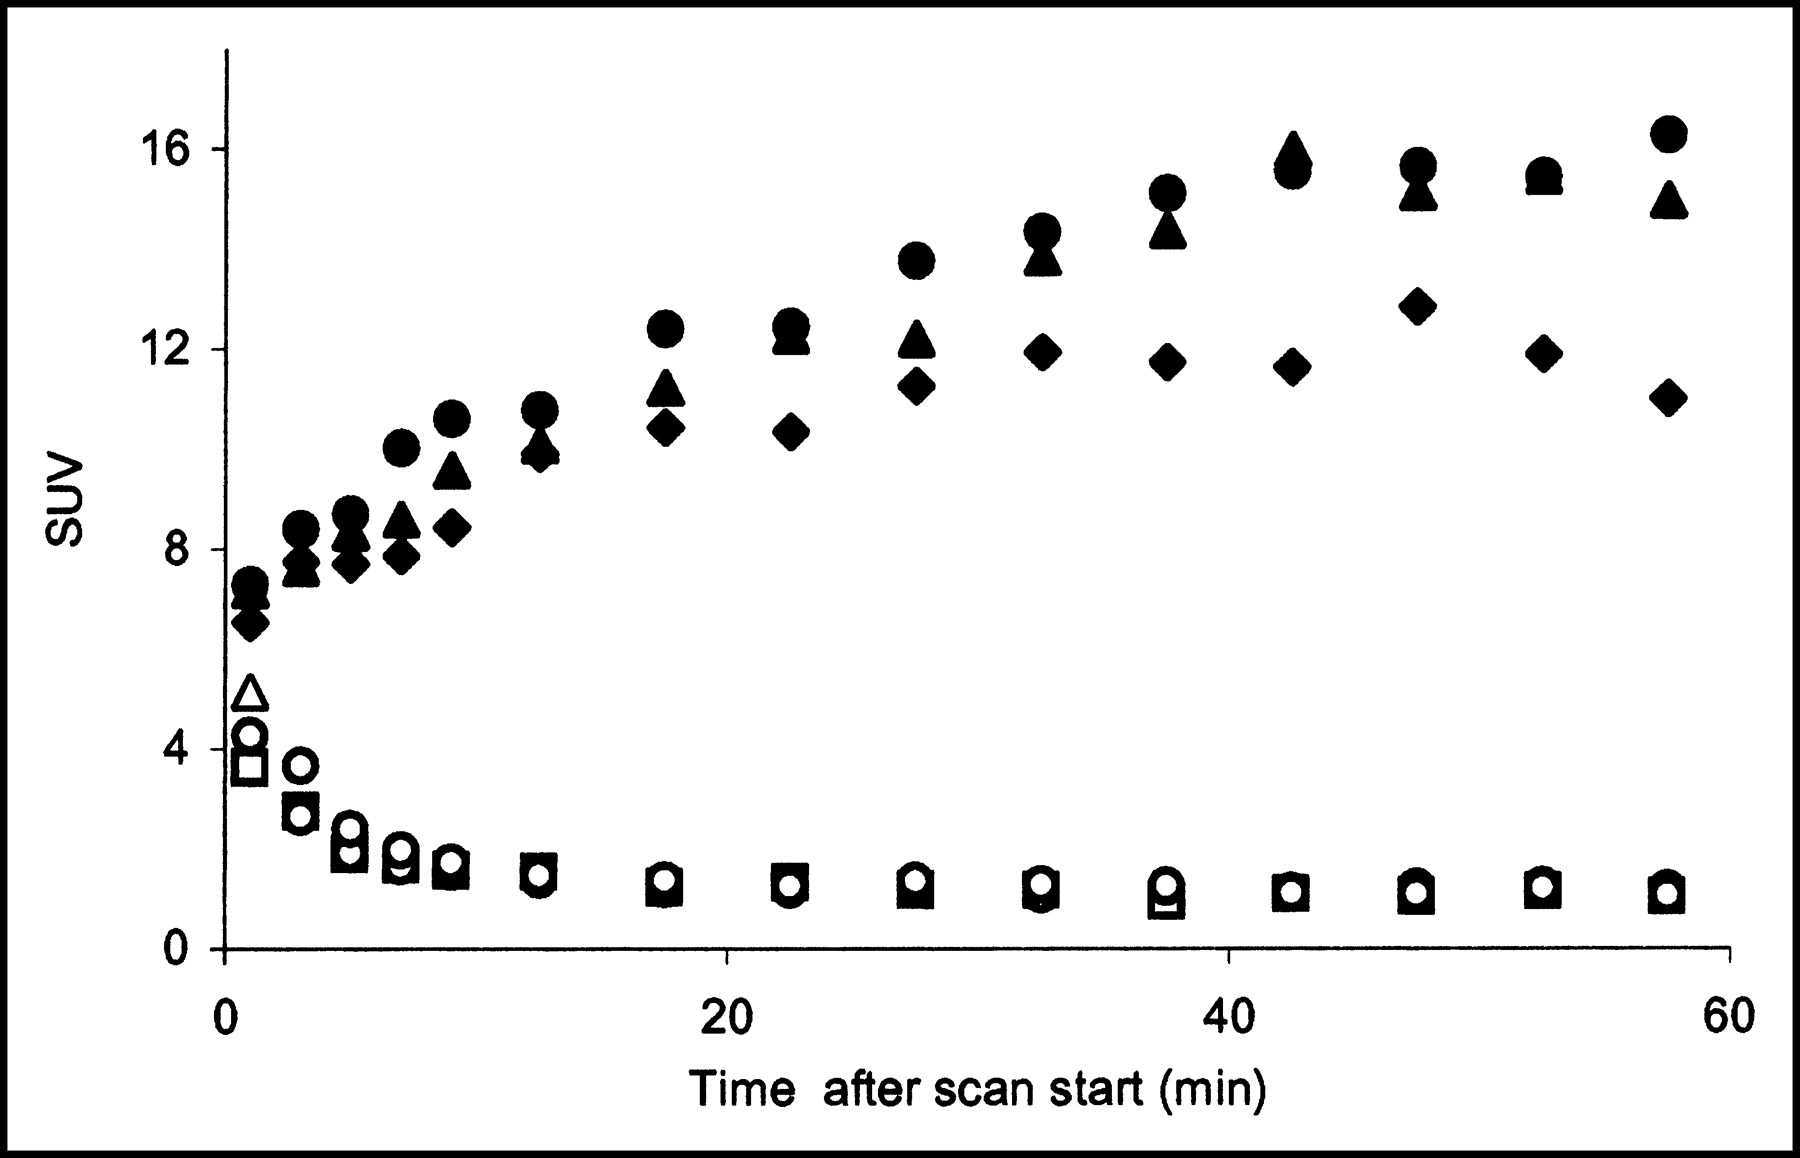
Repeated PET scans of a single animal suggested that serial dynamic neuroreceptor imaging in mice is feasible. Time-activity curves in the cerebellum displayed only small variations between experiments whereas the set of striatal time-activity curves showed greater variations (Fig. 3). Kinetic modeling of PET data using the Lammertsma and the Ichise methods yielded BPs of 12.7 ± 2.2 and 11.2 ± 1.4, respectively (Table 1). The high accumulation of radioactivity in the striatum and the small activity concentrations in the cerebellum resulted in high ratios of 10 between the striatum and cerebellum already at 25 min after injection. This ratio continued to rise to >12 until it reached a plateau at 40 min after injection. The mean striatum-to-cerebellum ratio of the 3 repeated PET scans was 12.5 ± 1.5 from 40 to 60 min after injection.

Time-activity curves in the striatum (▴, •, ♦) and cerebellum (▵, ○, □) of 3 PET scans performed in a single baseline animal. Curves were normalized to the injected dose per body weight and are expressed as SUV.
Effect of Haloperidol Blocking
ROI analysis of dynamic 18F-fallypride PET data of 3 baseline animals and 3 haloperidol-treated animals demonstrated the specificity of radioligand binding to the mouse striatum (Fig. 4A). The set of striatal time-activity curves under baseline and blocking conditions showed small interindividual variations and a 95% blocking effect at late time points of the 60-min scan. The magnitude of the blocking effect is illustrated by a representative example of corresponding coronal slices through the striatum of a baseline animal and a haloperidol-treated animal (Fig. 4B).

(A) Normalized striatal time-activity curves under baseline (▴, •, ▪) and blocking (▵, ○, □) conditions in 3 animals each. Curves were normalized to the injected dose per body weight and are expressed as SUV. (B) Corresponding coronal slices through the striatum of a baseline (left) and a haloperidol-treated (right) animal. Images were obtained by adding data from 20 to 60 min after injection.
Comparison of PET and Postmortem Biodistribution Data
PET BPs with an Rv value of 13.3 ± 0.8 corresponded to postmortem striatum-to-cerebellum ratios of 64.8 ± 6.8 at a sacrifice time point of 63 min after injection (Table 1). For a later time point of killing (153 min after injection), the difference between in vivo BPs and ex vivo striatum-to-cerebellum ratios was larger, with postmortem striatum-to-cerebellum ratios increasing to 163.3 ± 4.3 (Table 1).
DISCUSSION
The goal of this study was to demonstrate the feasibility of using the quad-HIDAC tomograph to perform quantitative, dynamic neuroreceptor imaging in mice. We used the well-characterized D2 receptor ligand 18F-fallypride to visualize the striatum, which is a tiny structure in the mouse brain of <20-mm3 volume.
The resolution of our PET camera permitted a clear-cut discrimination of the right and left striatum. Small activity concentrations were identified in extrastriatal regions, probably reflecting the thalamus and the olfactory bulb, which are known to contain low concentrations of D2 receptors (15). Uptake of activity above background was also identified in the skull, possibly owing to defluorination of the radioligand as also reported by Mukherjee et al. in a rat study (21).
The sensitivity of the tomograph permitted the generation of time-activity curves with initial time frames of 120 s. Visual inspection of striatal time-activity curves indicated relatively slow kinetics of 18F-fallypride binding to the mouse striatum, reaching a plateau at approximately 40 min after injection. The consistency of time-activity curves and measures of 18F-fallypride binding in several experimental designs suggested small inter- and intraanimal variations.
The course of the time-activity curve of 18F-fallypride binding to the mouse striatum resembled that measured in the monkey brain (22), indicating similar uptake and elimination rates in these 2 species. In addition, postmortem biodistribution studies of 18F-fallypride in the rat revealed the highest striatal activity concentrations at 60 min after injection and a slight decrease at later time points (21). Since we did not perform blood sampling during PET measurements, we used BPRf of the Lammertsma simplified reference tissue model (25) and Rv of the Ichise method (28) for quantification of specific binding of 18F-fallypride in the mouse striatum. Both BPRf and Rv values represent measures for the BP as originally defined by Mintun et al. (29). In this definition, the BP provides a measure of the ratio of specific-to-nonspecific radioligand binding at equilibrium—for example, the ratio of the radioactivity in striatum and the cerebellum in the case of 18F-fallypride. However, since this BP refers to a nonspecific tissue region—for example, the cerebellum—nonspecific binding in the cerebellum will affect the BP of the target region. For example, high nonspecific binding in the cerebellum will lead to lower values of the BP in the striatum. Obviously, this definition of the BP cannot be compared with in vitro measures of 18F-fallypride binding such as the ratio of Bmax/Kd (Bmax is the maximum number of binding sites). For the term Bmax/Kd to be determined by PET, the radioligand concentration in arterial plasma would have to be measured during PET scanning and corrections for the fraction bound to proteins and metabolites would have to be evaluated. Since we have not included such measurements in the present experiments, no conclusion can be drawn about the ratio of specific binding in the striatum and the radioligand concentration in plasma. However, both BPRf and Rv approximate the ratios of the radioactivity concentration in the striatum and the cerebellum at equilibrium. Since true equilibrium does not occur after a bolus injection, BPRf and Rv are more reliable measures than simple radioactivity ratios to estimate specific 18F-fallypride binding in the striatum, because they are nearly independent of the PET scan duration.
Application of the simplified reference tissue and Ichise models yielded comparable values for the BP (Fig. 2; Table 1). However, Rv was generally smaller than BPRf, pointing to a systematic difference between Rv and BPRf values. This may be due to the fact that, in contrast to the simplified reference tissue model of Lammertsma, the Ichise method is based on a linear least-squares algorithm. One of the drawbacks of linear least-squares approaches is that statistical noise in PET data may introduce significant bias in results. Determination of the BP in the left and right striatum also gave similar results (Fig. 2). High-quality parametric images of the parameter Rv (Fig. 1C) confirmed these results of the ROI analyses, while displaying the same distribution pattern as static 18F-fallypride images.
The estimated BPs of 18F-fallypride in the striatum, with values between 9.6 and 14.2 at the end of 60-min PET scans (Table 1), agreed with the striatum-to-cerebellum ratios obtained in an ROI analysis of regional time-activity curves (Fig. 3). However, discrepancies between in vivo BPs and in vitro striatum-to-cerebellum ratios were identified when activity concentrations in the striatum and cerebellum were determined postmortem, immediately after termination of the scan (Table 1). This phenomenon has been previously observed and explained by a reduction of the PET signal due to partial-volume loss and spillover from neighboring structures (11,19). Due to the excellent resolution of the quad-HIDAC tomograph, and the consequent possibility to delineate ROIs in the striatum and cerebellum with high precision, partial-volume loss from the striatum and spillover of extracerebral activity into the cerebellum may contribute only in part to the reduced in vivo ratios. Rather, the uniform scatter and random background mentioned earlier produces an overestimation of the activity concentration in the cerebellum ROI, which could compromise in vivo ratios and BPs. Using 11C-raclopride as radiotracer and the microPET R4 system, Thanos et al. found a striatum-to-cerebellum ratio of 1.3 in wild-type C57BL/6J mice at the end of a 60-min PET scan (6). The significantly higher ratio and image contrast observed in our study may be explained by the higher resolution of the quad-HIDAC system and the use of 18F-fallypride instead of 11C-raclopride.
Specific blocking of 18F-fallypride binding by haloperidol attained 95% at late time points in the ROI analysis of striatal time-activity curves. Postmortem analysis of striatal activities in baseline and haloperidol-treated animals confirmed this 95% reduction (data not shown). The magnitude of the blocking effect, and the ability to precisely measure it with PET, indicates the use of 18F-fallypride imaging in mice for the determination of in vivo parameters such as BPmax and receptor occupancy in the preclinical development of new D2 receptor ligands.
Binding of PET ligands to cerebral target sites may be influenced by the use of anesthesics during the scans. Isoflurane, for example, was shown to provoke alterations in the dopaminergic system in nonhuman primates, probably by modulating presynaptic dopamine transporter availability (30–32). However, the BP of the D2 receptor tracer 11C-raclopride was unaffected by isoflurane anesthesia in monkeys (30). In our 18F-fallypride study in mice, comparisons of postmortem striatal activity concentrations and striatum-to-cerebellum ratios in anesthetized and nonanesthetized mice excluded a substantial influence of isoflurane anesthesia on signal and activity ratios. Postmortem activity concentrations in the striatum of anesthetized and nonanesthetized animals differed significantly by 20.2% at 63 min after injection (P < 0.05). The increase in striatal accumulation of 18F-fallypride in anesthetized animals may be explained by reduced pharmacokinetics (e.g., metabolism) of the radiotracer.
An important limitation regarding PET imaging experiments in mice concerns the mass of the injected tracer. To achieve sufficient count statistics for the reconstruction of small volumes such as the mouse striatum, high doses of radioactivity are required. Preliminary 18F-fallypride experiments with mice and phantoms containing various amounts of radioactivity indicated that the minimum injected activity required for an appropriate quantification in our experimental setting is approximately 2.5 MBq. Depending on the specific activity of the radiotracer, this activity may lead to the injection of considerable masses of unlabeled compound and, to some degree, of receptor occupancy. Tracer kinetic modeling assumes receptor occupancies of <5% (11,33). Given the high affinity of 18F-fallypride (Kd = 33 pmol/L) (34), the masses injected into the mice in this study (2.5–4.4 nmol/kg body weight) might have produced receptor occupancies that are >5% (8,35). However, many factors influencing receptor occupancy are difficult to estimate—for example, the availability of endogenous ligand competing with the radiotracer for the binding site. Despite these potential limitations, our initial neurobiologic application of the quad-HIDAC camera proves the feasibility of dynamic neuroreceptor imaging in mice.
CONCLUSION
This study demonstrates that the sensitivity of the dedicated small animal tomograph, quad-HIDAC, together with its ultra-high spatial resolution permits precise quantitative measurement of 18F-fallypride dynamics in the mouse striatum. The capability to perform dynamic neuroreceptor imaging in small brain regions such as the mouse striatum represents a powerful tool for assessing the increasing number of animal models of neurologic and psychiatric disorders.
Acknowledgments
We are grateful to Andrew Reader for his continuing support and improvement of the OPL-EM software, to Alan Jeavons and the crew of Oxford Positron Systems for their support, to Erika Sinnig for radiotracer synthesis, and to Claudia Keller for her tireless and enthusiastic efforts regarding all aspects of data acquisition, reconstruction, and evaluation.
Footnotes
Received Jun. 20, 2003; revision accepted Nov. 10, 2003.
For correspondence or reprints contact: Michael Honer, PhD, Center for Radiopharmaceutical Science, Paul Scherrer Institute, CH-5232 Villigen PSI, Switzerland.
E-mail: michael.honer{at}psi.ch
REFERENCES
In this issue


Jump to section
Related Articles
Cited By...
- Noninvasive PET Imaging and Tracking of Engineered Human Muscle Precursor Cells for Skeletal Muscle Tissue Engineering
- 5-(2-18F-Fluoroethoxy)-L-Tryptophan as a Substrate of System L Transport for Tumor Imaging by PET
- Noninvasive Nuclear Imaging Enables the In Vivo Quantification of Striatal Dopamine Receptor Expression and Raclopride Affinity in Mice
- 18F-Labeled Bombesin Analog for Specific and Effective Targeting of Prostate Tumors Expressing Gastrin-Releasing Peptide Receptors
- In vivo Imaging of Inflammation- and Tumor-Induced Lymph Node Lymphangiogenesis by Immuno-Positron Emission Tomography
- A New 18F-Labeled Folic Acid Derivative with Improved Properties for the PET Imaging of Folate Receptor-Positive Tumors
- Validation of the Octamouse for Simultaneous 18F-Fallypride Small-Animal PET Recordings from 8 Mice
- Longitudinal and multimodal in vivo imaging of tumor hypoxia and its downstream molecular events
- Synthesis and Preclinical Evaluation of a Folic Acid Derivative Labeled with 18F for PET Imaging of Folate Receptor-Positive Tumors
- Ionizing radiation antagonizes tumor hypoxia induced by antiangiogenic treatment.
- Radiosynthesis and Preclinical Evaluation of 11C-ABP688 as a Probe for Imaging the Metabotropic Glutamate Receptor Subtype 5