


Abstract
Small targets such as cell proliferation in the coronary arteries may potentially be detected with single-photon imaging using high-radiotracer-specific activity. We hypothesized that an antibody linked to polymers to increase specific radioactivity can be visualized on SPECT images and that counts in the target will correlate with the strength of the biologic signal. Methods: Twenty-four stents were placed using the balloon overexpansion technique in the coronary arteries of 14 juvenile domestic swine. One week later, the animals received 74 MBq of 111In-diethylenetriaminepentaacetic acid-polylysine Z2D3-F(ab`)2, and SPECT imaging was performed at 24 h. The coronary vessels were removed, and the stented vessels were processed with plastic embedding and sectioning. Medial and neointimal areas, percentage of vessel stenosis, and cell proliferation indices were quantified using a 5-bromo-2-deoxyuridine (BrdU) labeling index. Reconstructed SPECT images were interpreted for tracer uptake in coronary vessels. Results: Sixteen of the vessels were positive on SPECT imaging and 10 were negative. The percentage injected dose was 0.85 ± 0.28 × 10⁻³ in scan-positive vessels and 0.34 ± 0.11 × 10⁻³ in scan-negative vessels (P < 0.001). The medial-plus-neointimal proliferative index was 42 ± 11 in scan-positive vessels and 11 ± 11 in scan-negative vessels (P < 0.0001). The percentage stenoses were 21% ± 22% versus 19% ± 15% (not statistically significant). When individual values for the stented-to-control vessel counts were plotted against BrdU labeling index, a significant relationship was found (r2 = 0.441; P = 0.0014). Conclusion: These data indicate that small targets relevant to human coronary vascular disease may be detected using polymer-modified radiolabeled antibodies.
Coronary stenting is now performed during angioplasty in 70%–80% of procedures. The overall incidence of in-stent restenosis is 20%–30% (1). In-stent restenosis is more likely when the lesion is long, has a small luminal diameter, or has a proximal coronary location; when multiple stents are placed; when the final diameter is small; and when the patient is diabetic. The recently reported RAVEL trial found significantly reduced late luminal loss (by angiography) and reduced events related to in-stent restenosis in sirolimus-eluting stents compared with standard stents (2). Although encouraging, these results cannot be viewed as definitive without a larger sample, inclusion of complex lesions, and evaluation of peristent neointimal growth. Neointimal growth consisting of smooth muscle cells in a proteoglycan matrix comprises the neointima that develops in arterial in-stent restenosis (3).
The antibody Z2D3 was developed more than 10 y ago in a quest for a method to image atherosclerosis (4). The antibody colocalized with tissue staining positive for proliferating cell nuclear antigen and with α-actin identifying the cells as proliferating smooth muscle cells (5). Khaw et al. (6) and Torchilin et al. (7) linked diethylenetriaminepentaacetic acid (DTPA)-polylysine to the F(ab`)2 fragment of the mouse/human chimeric IgG Z2D3 antibody to chelate many trivalent metallic radiolabels. This process improved target-to-background contrast by simultaneously increasing the amount of radiolabeled antibody delivered to the target and reducing the electrostatic attraction to nontarget cells with an overall weak negative charge. Using 111In-labeled polylysine Z2D3 F(ab`)2 in a swine model of overexpansion stent restenosis, we previously showed that the charge-modified radiolabeled antibody localizes to sites of coronary arteries that had undergone overexpansion injury (8). That study used planar imaging and did not correlate scan results with tissue morphometry. The purpose of the present study was to perform SPECT and to correlate tracer uptake with immunohistochemical indices of active proliferation of smooth muscle cell.
MATERIALS AND METHODS
Coronary Artery Injury
This study was performed within the guidelines specified by the National Institutes of Health for the care and use of laboratory animals and with the approval of the Rhode Island Hospital Animal Care Committee. Castrated juvenile male swine weighing 20–40 kg were fed a standard diet. The pigs were given clopidogrel and indomethacin for 3 d preoperatively and each day during the study to prevent thrombosis. On the third preoperative day, a dose of sustained-release verapamil was given to prevent vessel spasm during the stenting procedure. The pigs were sedated, intubated, and ventilated. Continuous electrocardiography and arterial pressure monitoring were performed. Heparin was given intravenously, and fluids and medications were given through intravenous lines placed percutaneously into ear veins. Coronary angiography using x-ray fluoroscopy was performed via a carotid artery. The diameter of the catheter, balloons, and stents was chosen to be approximately 20%–30% greater than the diameter of the vessel. Through a guiding catheter, a 2.5- to 3.0-mm-diameter stent mounted on a balloon catheter was advanced into the left anterior descending artery (LAD), left circumflex artery (LCX), or right coronary artery (RCA). The balloon was inflated (5–10 atm), and stents were deployed into 2 of the 3 coronary arteries. Coronary angiography was repeated to check stent placement and vessel patency. All catheters were removed, the cut-down repaired, and the pigs allowed to recover. Buprenorphine hydrochloride was given along with preanesthetics to relieve pain. Antibiotics were given intramuscularly for 5 d after the procedure.
Antibody Preparation, Injection, and Imaging
F(ab`)2 fragments of the chimeric IgG antibody Z2D3 were prepared as previously described (8). At approximately 1 wk after the stenting procedure, 150 μg of Z2D3 antibody were labeled with approximately 54 MBq of 111In using column chromatography to separate bound antibody from free 111In as described previously. The animals were lightly sedated, and the radiolabeled antibody was injected through an ear vein. At the same time, 50 mg/kg of 5-bromo-2-deoxyuridine (BrdU) were injected (9–11). At 18–24 h after tracer injection, the animals were again sedated and anesthetized. A second dose of 50 mg/kg of BrdU was given. After coronary angiography, the animals underwent SPECT using medium-energy collimators with the energy window centered on the 167- and 211-keV photopeaks of 111In (Arc-3000; ADAC). At the completion of imaging, the animals were euthanized with an overdose of thiopental sodium and saturated KCl, and the heart was rapidly excised. The coronary vessels were dissected and counted in the well counter.
Histopathology and Quantitative Morphometry
The hearts were removed and fixed in 10% neutral buffered formalin. The stented coronary vessels were carefully dissected, and the stent and surrounding artery were removed as a whole, processed in a graded series of alcohol, embedded in methyl methacrylate, and sawn into 1-mm segments from the proximal, middle, and distal portions of the stented artery. Sections (4 μm) were cut with a carbide knife (12). The sections were stained with hematoxylin–eosin and Movat pentachrome. Smooth muscle cells were stained on serial sections using monoclonal antibody HHF-35 (cytoplasmic brown stain) against α-actin using an avidin–biotin complex system. Immunostaining with monoclonal antibody directed against BrdU was also performed on serial sections using an avidin–biotin complex system. Colocalization of positively stained nuclei (actively proliferating cells) and positively stained cytoplasm (smooth muscle cells) was performed. The proliferative index was calculated as the percentage of proliferating cells of the total cells per field.
The mean cross-sectional area of each stented section was measured using digital morphometry. The mean area was calculated as the average of 3 sections through the stent (proximal, mid, and distal). The percentage stenosis for each stent section was calculated as the area within the internal elastic lamina (IEL) minus the area of the residual lumen divided by the IEL area × 100. The neointimal area was calculated as the IEL area minus the area of the residual lumen. In addition, the greatest percentage of vessel stenosis was calculated from the smallest residual lumen area and the IEL area.
Scan Interpretation
Transverse, coronal, and sagittal images were interpreted by 2 observers using triangulation display software (NC Systems). The observers were unaware of the number and location of stents placed or of the coronary angiography results. Scans were interpreted as positive if all 3 planes showed that focal uptake of tracer was localized to the same region of the heart. The initial reading was either positive or negative, with either 1 or 2 vessels identified. Further localization was attempted using the following scheme: Midline and anterior focal uptake was considered to be in the LAD; focal uptake to the right and more posterior, in the RCA; and focal uptake to the left and more posterior, in the LCX. If 2 areas of posterior focal uptake were identified, then the uptake was considered to be in both the RCA and the LCX.
Statistical Methods
Numeric data for the 2 groups (scan positive and scan negative) were compared using a 2-sample t test with equal variance. The vessel count ratios (stent-to-normal values) were plotted against the proliferative index values, and a simple linear regression was performed.
RESULTS
Twenty-two swine underwent stenting of 1 or 2 coronary arteries. Six animals died prematurely, the scans of 1 animal were inadequate because of camera malfunction, and in 1 animal both stents were occluded. Of the remaining 14 animals, 3 had single-vessel stenting (1 stent each to the LAD, RCA, and LCX) and 11 had 2 stents placed into either the RCA and LAD or the RCA and LCX. There were a total of 11 RCA stents, 7 LAD stents, and 6 LCX stents.
In Vivo Scans
The mean time (±SD) between stenting and imaging was 9.1 ± 2.4 d. Fourteen vessels were interpreted as positive and 10 as negative for uptake of 111In-Z2D3. Among the scan-positive vessels, 3 were LAD, 6 RCA, and 5 LCX. Among the scan-negative vessels, 4 were LAD, 5 RCA, and 1 LCX. From the well counting of the excised vessels, the mean ratio of counts in the stented vessels to the control vessels was 2.10 ± 0.4 (range, 1.6–2.2) for the scan-positive vessels and 1.22 ± 0.53 (range, 0.58–2.15) for the scan-negative vessels. The difference was significant, at P = 0.0007. The mean percentage injected dose was 0.85 ± 0.28 × 10⁻³ (range, 0.6–1.14 × 10⁻³) in scan-positive vessels and 0.34 ± 0.11 × 10⁻³ (range, 0.17–0.50 × 10⁻³) in scan-negative vessels. This difference was significant, at P = 0.0005.
Quantitative Histomorphometry
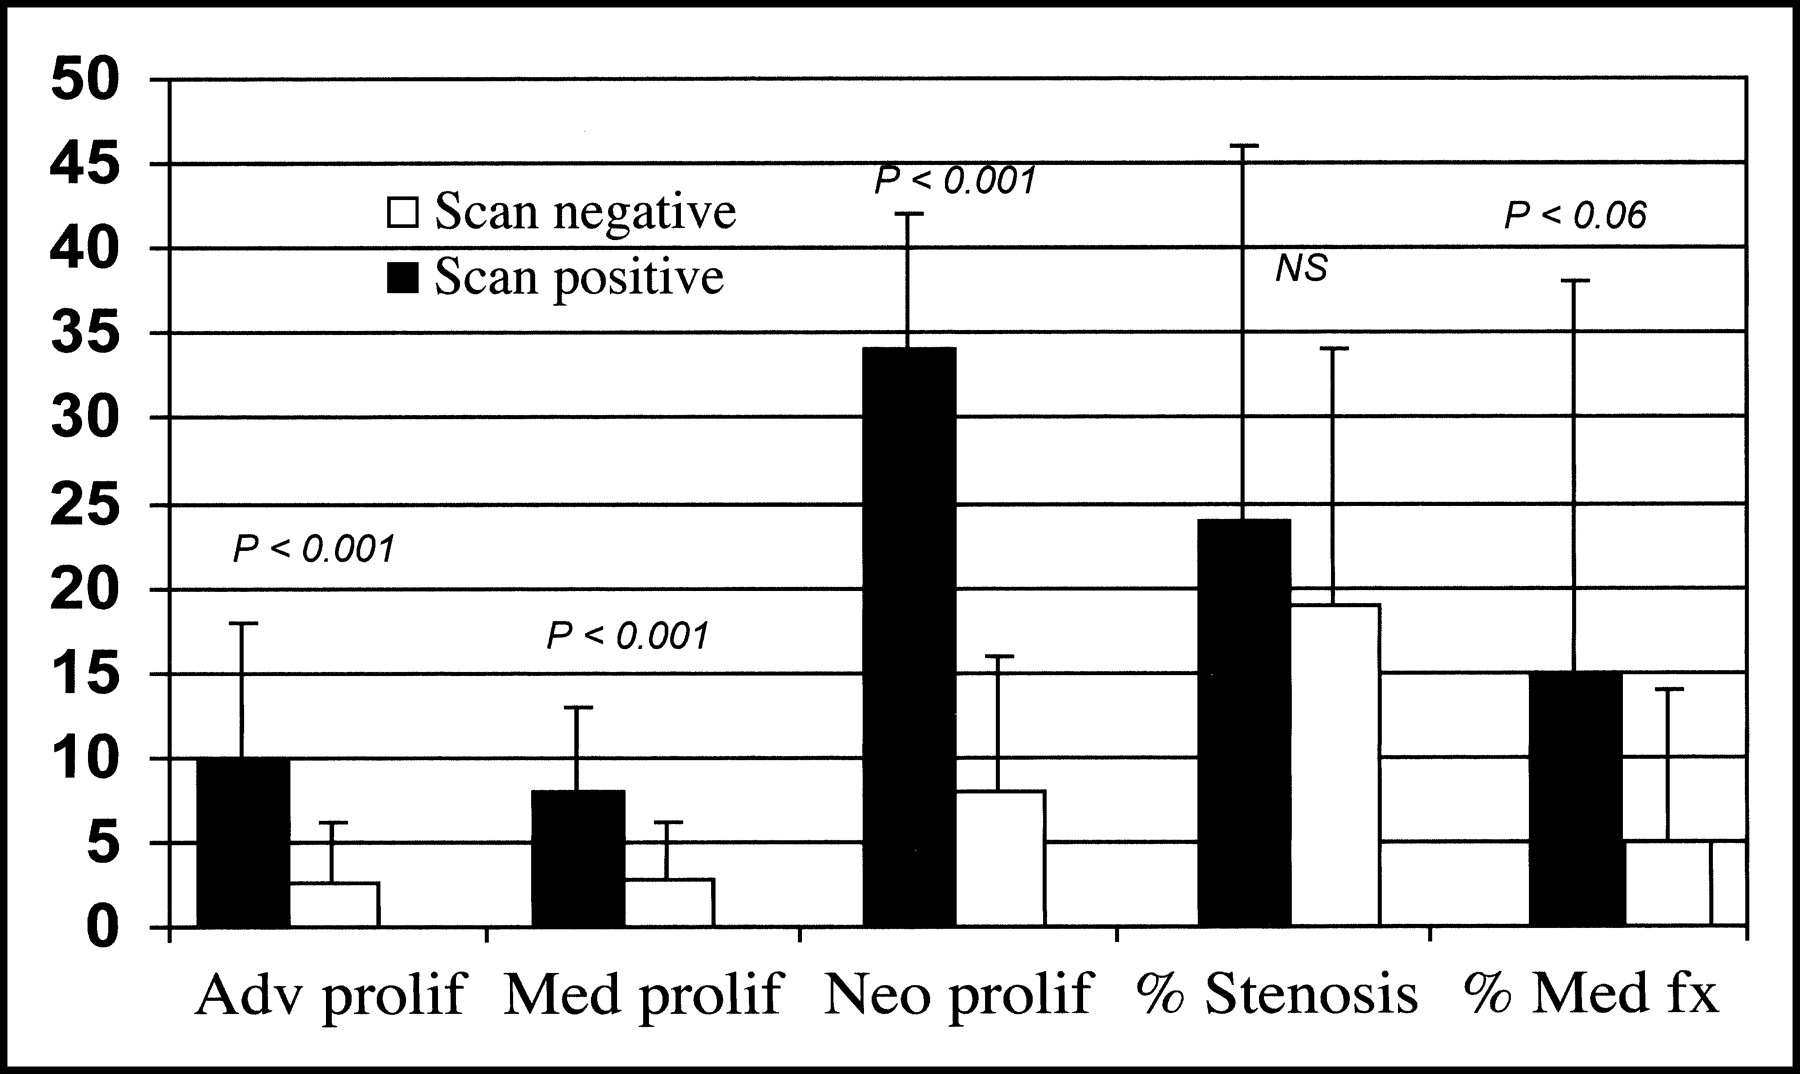
The percentages of BrdU-positive nuclei in the adventitia, media, and neointima of the stented vessels are summarized in Figure 1. There were no differences for adventitial, medial, or neointimal areas or for percentage stenosis between the scan-positive and scan-negative animals (21% ± 22% vs. 19% ± 15%). The number of α-actin–positive smooth muscle cells with BrdU labeling was significantly higher for all 3 vascular wall layers in scan-positive vessels. Further, the combined media and neointima proliferating index was greater for scan-positive than for scan-negative vessels (42.0 ± 11.0 vs. 11.0 ± 11.0) (P < 0.0001). Because the measurements were taken so soon after stenting, the percentage stenosis was low and not significantly different between groups. The percentage of medial fracture was higher in the scan-positive animals, suggesting more extensive vascular injury in these vessels, but the difference was of only borderline statistical significance because of the large SD in the scan-positive group (15.0% ± 23% scan positive vs. 5.0 ± 9.0 scan negative, P = 0.06).

Bar graph showing BrdU proliferative (prolif) indices for scan-positive and scan-negative vessels for the adventitia (Adv), media (Med), and neointima (Neo). fx = fracture.
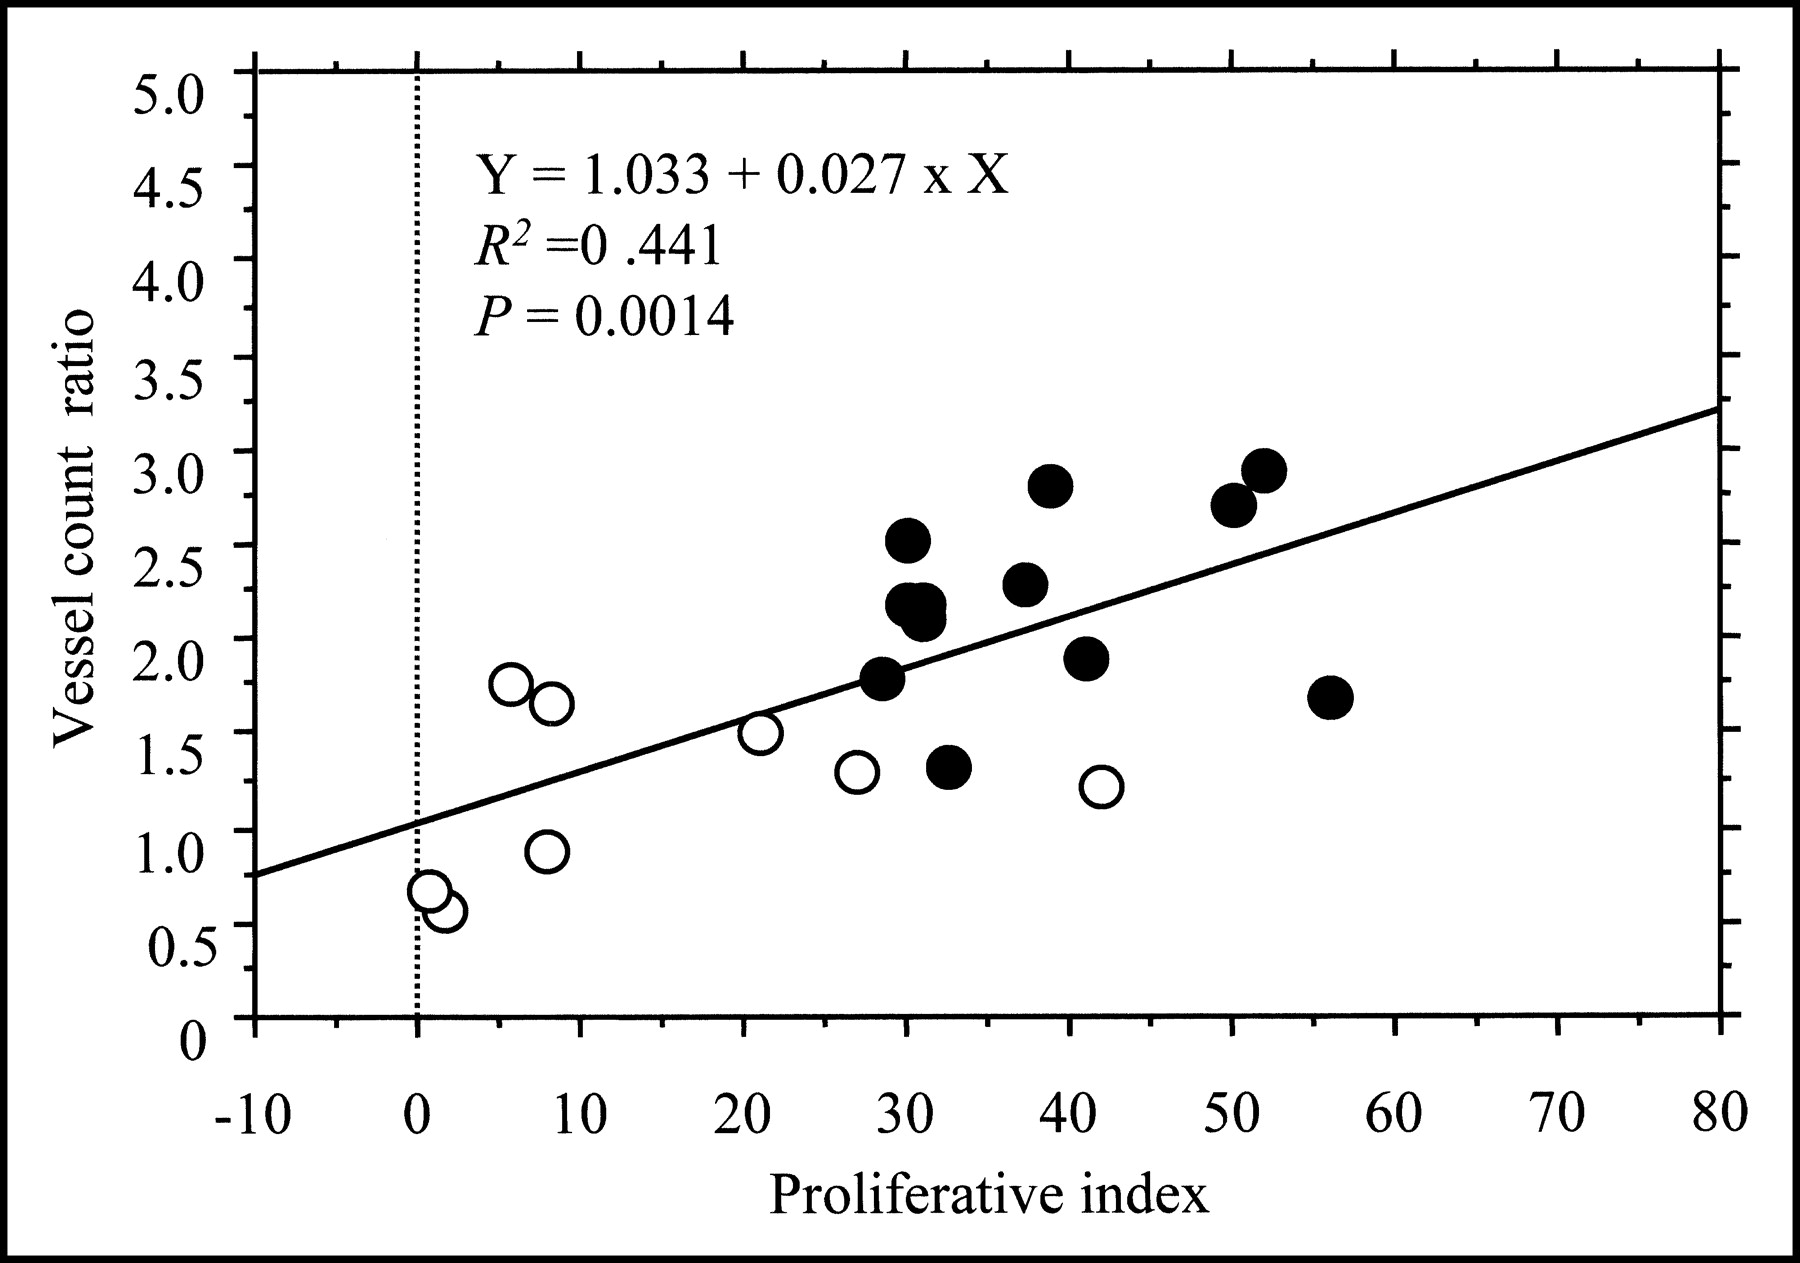
When individual values for the stented-to-control vessel counts were plotted against the combined proliferative index, a significant relationship was found (r2 = 0.441; P = 0.0014) (Fig. 2). The cutoff for proliferative index for in vivo visualization was about 30%. Figures 3–5 show examples of scan-positive and scan-negative studies.

Plot of vessel count ratio (stented-to-control) versus proliferative index (percentage of proliferating cells of total cells per field). ○ = points plotted for scan-negative experiments; • = points plotted for scan-positive experiments.

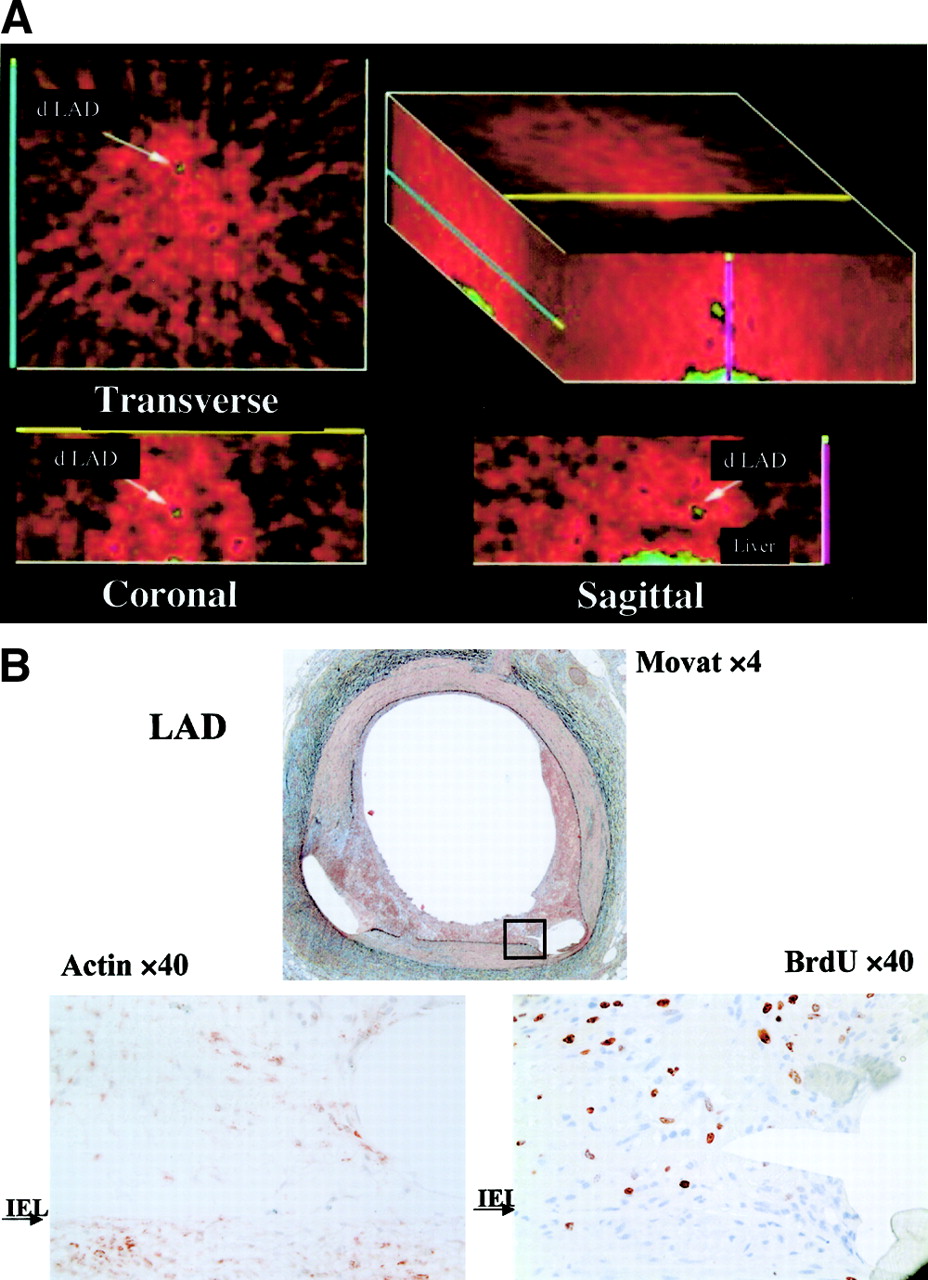
(A) Transverse, coronal, and sagittal planes with arrows indicating focal tracer uptake localized to the distal LAD. (B) Upper panels—low-power images in Movat pentachrome stain—show stent artifacts and focal areas of neointimal growth. Lower panels, in high power, show actin-positive cytoplasm (brown-red) on the left and BrdU-positive nuclei (brown-red) on the right.

(A) Same experiment as in Figure 3: transverse, coronal, and sagittal planes with arrows indicating focal tracer uptake localized to the mid RCA. (B) Upper panels—low-power images in Movat pentachrome stain—show stent artifacts and focal areas of neointimal growth. Lower panels, in high power, show actin-positive cytoplasm (brown-red) on the left and BrdU-positive nuclei (brown-red) on the right.

(A) Example of scan interpreted as negative for focal antibody uptake in region of coronary arteries. (B) Upper panels—low-power images in Movat pentachrome stain—show stent artifacts and minimal neointimal growth in the LAD. Lower panels, in high power, show very few actin-positive cells on the left and correspondingly few BrdU-positive cells on the right. (C) Upper panels—low-power images in Movat pentachrome stain—show stent artifacts and minimal neointimal growth in the RCA. Lower panels, in high power, show very few actin-positive cells on the left and correspondingly few BrdU-positive cells on the right.
DISCUSSION
A hallmark of coronary vessel restenosis is smooth muscle cell proliferation (3). Noninvasive SPECT imaging of a radiotracer that binds a proliferative smooth muscle cell antigen was performed on a swine model of coronary artery stenting. Focal uptake of radiotracer localized to coronary stent sites was associated with higher rates of smooth muscle cell proliferation quantified from BrdU labeling using computerized morphometry. Radiotracer uptake on in vivo images was confirmed by well counting of excised vessels. Stented vessel counts that were normalized for control correlated with BrdU proliferative index. At 7 d, the percentage stenotic narrowing was low and not significantly different between scan-positive and scan-negative vessels. The higher proliferative index detected in scan-positive vessels should predict future greater neointimal growth and luminal narrowing. The time course of smooth muscle cell proliferation in patients is not fully known, but available necropsy data indicate that proliferation occurs later than in the swine model (13,14).
Clinical variables predicting in-stent restenosis have been described (15). Studies have been performed to look for serum biomarkers that can identify restenosis. Biomarkers that have been investigated include adiponectin and plasminogen activator inhibitor, type 1 (16,17). Neither was shown to be effective. One group reported that thiobarbituric acid–reactive substances, as an indicator of lipid peroxidation, may be useful as a predictor of restenosis (18). Another approach is to use imaging techniques for early identification of patients at risk for in-stent restenosis—before they develop acute coronary syndromes. Intravascular ultrasound is used routinely to optimize stent placement. When performed during the procedure, intravascular ultrasound helps identify technical factors associated with restenosis, allowing for their remedy at that time (19). This imaging modality is invasive and cannot be followed serially after the procedure without repeating the angiography. Several MRI approaches have been investigated (20–22).
Another noninvasive approach similar to biomarkers and different from flow or perfusion imaging is use of radiolabeled tracers that target a marker of the vascular lesion. The spatial resolution of a γ-camera detector (ability to separate 2 adjacent structures) is in the range of 1–2 cm at an 8-cm depth. However, the ability to detect small targets (<1 cm) depends on the contrast resolution measured in counts/pixel in the target relative to background. Contrast resolution is closely related to spatial resolution but is more affected by scatter and attenuation. The counts/pixel extracted from a target depend not only on the contrast resolution but also on the specific activity of the tracer and the administered dose. In general, for small targets (2–3 mm) the counts/pixel need to be more than 1,000 and the target-to-background ratio at least 2:1. All but 3 scans that were positive in vivo had vessel count ratios above 2.0; the 3 that did not had ratios of 1.6, 1.7, and 1.8. All experiments but 1 that were scan-negative in vivo had vessel count ratios below 2.0.
The antibody Z2D3 was developed more than 10 y ago in a quest for a method to image atherosclerosis (4). Mice were immunized with homogenized human atherosclerotic plaques, and an antibody designated as Z2D3 (IgM class, k light chain) was produced by the mice and reacted specifically with intimal proliferating smooth muscle cells in human atheroma (4). The cell line was subcloned to provide hybridoma cell lines, and the antibody that was produced specifically cross-reacted with experimental atherosclerotic lesions in the rabbit aorta. The antibody colocalized with tissue staining positive for proliferating cell nuclear antigen and with α-actin identifying the cells as proliferating smooth muscle cells and showed high target affinity (5,23). The surrogate antigen was identified as a mixture of 7-dehydrocholesterol and benzyldimethylhexadecylammonium chloride and a mixture of 7-dehydrocholesterol and palmitoyl choline (Dr. Khaw, unpublished data).
Because fragments of Z2D3 IgM could not be made by enzymatic digestion, the parent hybridoma line was switched to produce IgG. This class switch led to a loss in affinity that was restored by producing a chimera with a human IgG1 constant region. This chimeric antibody was fragmented to F(ab`)2 by pepsin digestion. Khaw et al. (6) and Torchilin et al. (7) linked DTPA with polylysine to chelate many trivalent metallic radiolabels. This process improved target-to-background contrast by simultaneously increasing the amount of radiolabeled antibody delivered to the target and reducing the electrostatic attraction to nontarget cells with an overall weak negative charge. Using 111In-labeled polylysine Z2D3 F(ab`)2 in animal experiments, Narula et al. demonstrated radiotracer uptake in atherosclerotic rabbit aortas (24).
There are limitations to using 111In-antibodies for imaging. Antibody fragments show nonspecific tissue uptake, and 111In is transchelated to ferritin. Images in the present study were degraded particularly by bone uptake. An approach to improve specific activity is to conjugate the Z2D3 F(ab`)2 with a negatively charged polymer (polylysine) linked with multiple DTPA molecules (6,7). This approach increases the number of binding sites for 111In and reduces the nonspecific cell binding though charge modification and was used in the current study. Another approach is to use the technique of bispecific antibody imaging. In this method, a cold bispecific antibody is injected first and is taken up into RES cells but remains available for binding on target cells. Injected afterward is a radiolabeled peptide that is a smaller molecule and designed to bind directly with one of the functional units of the bispecific antibody. This approach has been used successfully in tumor imaging (25,26). The peptide can be labeled with 99mTc, which has better imaging properties and more favorable dosimetry than 111In. We have begun work on a Z2D3 and anti-DTPA bispecific antibody and radiolabeled DTPA polylysine.
Alternatively to further tracer development, a different imaging modality may be used. This study was performed with SPECT without attenuation correction. In this model, we showed that a proliferating index greater than 30% can be detected on in vivo imaging but we could not relate counts from the in vivo images to cell proliferation. PET has better quantitative accuracy and volumetric spatial resolution than does SPECT and may enhance the detectability of small, focal proliferative lesions using an 18F-labeled tracer such as 3`-deoxy-3`-18F-fluorothymidine (27).
Acknowledgments
This study was supported by grant RO1 HL60785-01 from the National Heart, Lung, and Blood Institute.
Footnotes
Received Mar. 21, 2003; revision accepted Nov. 12, 2003.
For correspondence or reprints contact: Lynne L. Johnson, MD, Rhode Island Hospital, MB Room 209, 593 Eddy St., Providence, RI 02903.
E-mail: Lynne_Johnson{at}brown.edu
REFERENCES
In this issue


Jump to section
Related Articles
Cited By...
- Time Course of Endothelium-Dependent and -Independent Coronary Vasomotor Response to Coronary Balloons and Stents: Comparison of Plain and Drug-Eluting Balloons and Stents
- Imaging Experimental Atherosclerotic Lesions in ApoE Knockout Mice: Enhanced Targeting with Z2D3-Anti-DTPA Bispecific Antibody and 99mTc-Labeled Negatively Charged Polymers
- Smooth Muscle Cell Proliferation Index Correlates with 111In-Labeled Antibody Z2D3 Uptake in a Transplant Vasculopathy Swine Model