


Abstract
PET/CT imaging can be associated with focal artifactual 18F-FDG uptake introduced by metallic implants or contrast agents. It is unknown whether cardiac pacemakers or permanent central venous catheters can also result in such artifacts. Methods: Twenty-seven patients with permanent central venous lines (13 men and 14 women; mean age ± SD, 53.8 ± 16.2 y) and 9 patients with pacemakers (7 men and 2 women; mean age ± SD, 74.8 ± 5.1 y) who were referred for a variety of oncologic indications were studied with lutetium-oxyorthosilicate–based dual-slice PET/CT after injection of 7.77 MBq/kg of 18F-FDG. CT-corrected and -uncorrected PET images were reviewed, and 18F-FDG uptake was graded as absent, mild, moderate, or intense. Results: CT-corrected PET images revealed focally increased uptake of moderate intensity in all patients with cardiac pacemakers and focally increased uptake of mild intensity in 8 of 27 patients (29.6%) with central venous lines. Conclusion: Cardiac pacemakers and reservoirs of central venous lines can induce artifactual 18F-FDG on CT-corrected PET images. Thus, in patients with permanent central lines or pacemakers, both corrected and uncorrected PET images need to be reviewed to avoid false-positive PET findings.
Molecular imaging with PET can be used with high diagnostic accuracy to diagnose, stage, and restage most cancers (1). However, molecular abnormalities cannot always be assigned to distinct anatomic structures, primarily because of the low anatomic resolution of PET (2,3). The recent introduction of PET/CT overcame this limitation. Anatomic and molecular information can be obtained in a single examination (4). However, the current PET/CT systems frequently use a different approach for photon attenuation correction than does PET alone. Rather than using the conventional 68Ge sources, PET/CT images are reconstructed using the CT data for correction of photon attenuation (5).
CT-based attenuation correction can induce artifacts on PET images. For instance, metallic implants such as orthopedic devices or dental implants induce artifacts on CT images (6,7), resulting in inappropriate attenuation coefficients for PET images and in artifactually increased 18F-FDG uptake (8).
The purpose of this study was to evaluate whether permanent central venous line reservoirs and pacemakers also can introduce artifacts on CT-corrected PET images.
MATERIALS AND METHODS
Patients
The study population consisted of 36 patients (20 men and 16 women with a mean age [±SD] of 59.0 ± 16.9 y) who were identified from a database of 379 patients. Nine of the 36 patients had a permanent pacemaker (7 men and 2 women with a mean age of 74.8 ± 5.1 y), and 27 had central venous lines (13 men and 14 women with a mean age of 53.8 ± 16.2 y). All underwent whole-body PET/CT for diagnosis, staging, or restaging of cancer (lymphoma [n = 8], breast cancer [n = 6], lung cancer [n = 6], colorectal cancer [n = 3], pancreatic cancer [n = 2], sarcoma [n = 2], nasopharyngeal carcinoma [n = 2], gastric cancer [n = 1], thyroid cancer [n = 1], ovarian cancer [n = 1], cholangiocarcinoma [n = 1], melanoma [n = 1], gastrointestinal stromal tumor [n = 1], and cancer screening [n = 1]).
PET/CT Imaging Protocol
Patients were advised to fast for at least 6 h before the PET/CT examination and received 7.77 MBq/kg of 18F-FDG 60 min before the examination. Studies were performed from the mid thigh to the base of the skull, and no intravenous contrast agents were used. Patients were scanned with their arms above their head and were advised not to speak, chew, or move during scanning. All datasets were retrospectively analyzed.
Image Acquisition
The Reveal RT PET/CT scanner (CTI) was used. This scanner consists of an ECAT ACCEL PET system (CTI), without septa and transmission sources, and a Somatom Emotion duo CT system (Siemens Medical Systems).
After the imaging field was determined, a 80- to 110-s whole-body CT acquisition was performed using the following parameters: 130 kVp, 120 mA, 1-s tube rotation, 4-mm slice collimation, and a bed speed of 8 mm/s (i.e., pitch = 2). On completion of the CT portion, the PET emission data were acquired using a weight-based protocol.
For patients weighing less than 59 kg (130 lb), emission data were acquired for 1 min/bed position; for those with weights ranging from 59 to 81 kg (130–179 lb), emission data were acquired for 2 min/bed position. Images were acquired for 3 and 4 min/bed position for patients weighing 82–113 kg (180–250 lb) and more than 113 kg (250 lb), respectively. All studies were acquired in 3-dimensional mode.
Image Reconstruction
CT images were reconstructed using conventional filtered backprojection, at 3.4-mm axial intervals to match the slice separation of the PET data.
PET images were reconstructed using iterative algorithms (ordered-subsets expectation maximization [OSEM], 2 iterations, 8 subsets) to a final image resolution of 8.8 mm in full width at half maximum. Using the CT data, attenuation correction was performed with an algorithm, developed at the University of Pittsburgh, in which the Hounsfield units (HU) in the CT images are scaled to appropriate attenuation coefficients at 511 keV (4).
Image Analysis
First, the images were fused and coregistered using the commercially available software. Then, the attenuation-corrected images were reviewed for focal 18F-FDG-uptake without detailed knowledge about the type and site of the implanted device. Artifactually increased 18F-FDG uptake was graded as mild, moderate, or intense. Mild 18F-FDG uptake was defined as being similar to mediastinal activity; moderate, as being at the level of liver uptake; and intense, as being greater than liver uptake.
Crosshairs were then placed on sites of increased uptake, and the exact anatomic location was identified on CT images via triangulation. If the increased 18F-FDG uptake was aligned with the device, findings were considered positive.
Finally, uncorrected coronal, axial, and sagittal images were inspected for focally increased 18F-FDG uptake. If no uptake was identified, the abnormal uptake on corrected PET images was considered artifactual.
RESULTS
Moderate artifactually increased 18F-FDG uptake corresponding to the site of the implanted device was observed in all 9 patients with cardiac pacemakers (Fig. 1). In contrast, mild artifactually increased uptake was present in the region of the reservoir in only 8 of the 27 patients with permanent venous lines (Fig. 2). Finally, review of uncorrected images revealed photopenic regions in the area of the implanted device in all patients with pacemakers and in patients with central venous lines and with abnormal 18F-FDG uptake on attenuation-corrected PET images. Normal background activity in the region of the implanted device was seen in patients with central venous lines and with no abnormalities on attenuation-corrected PET images.

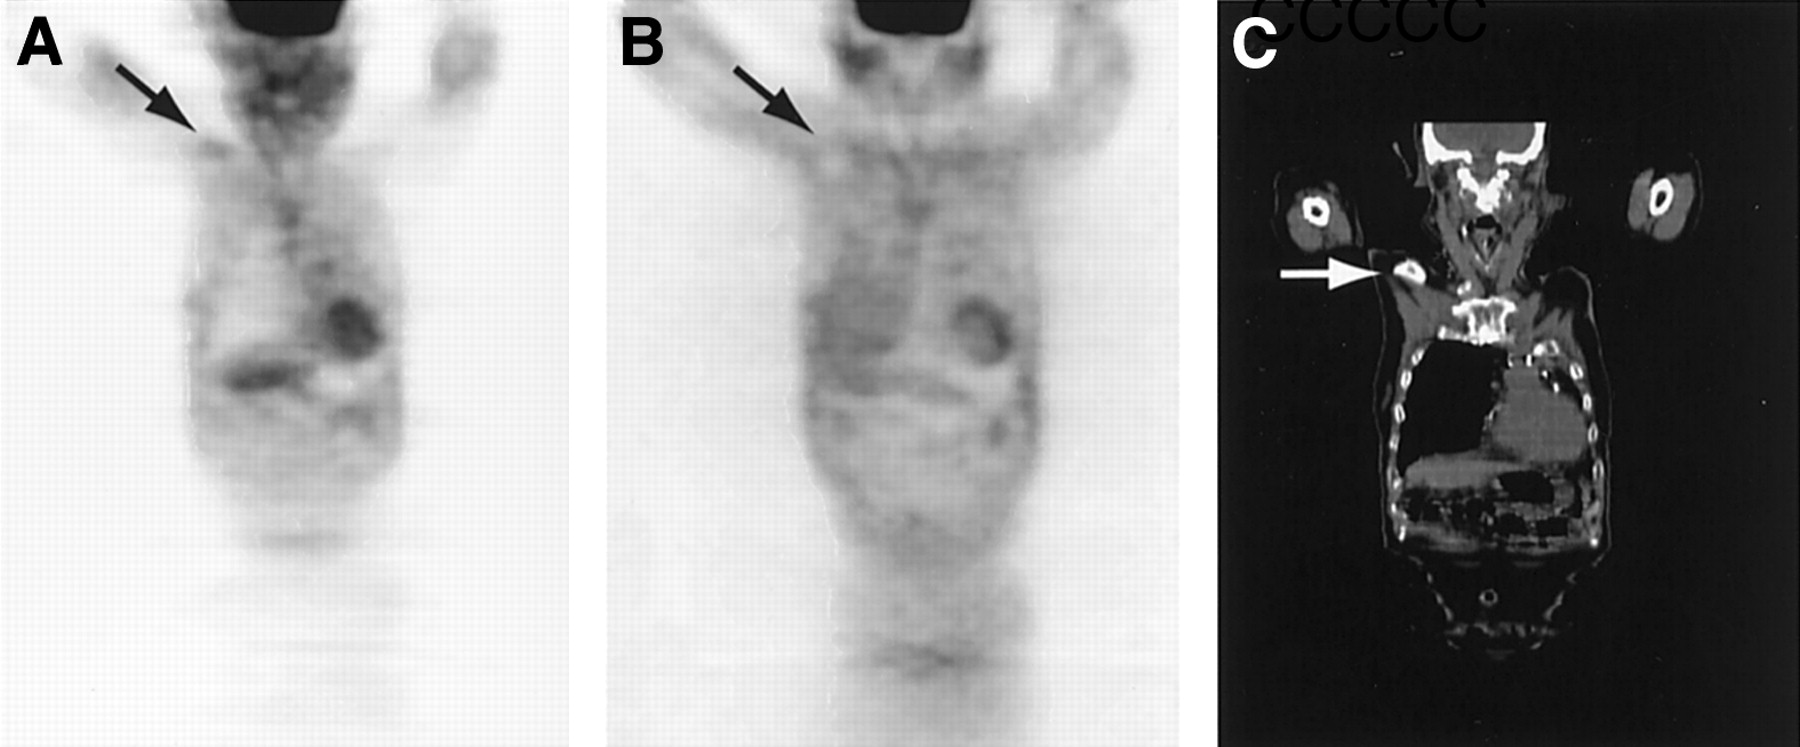
Attenuation-corrected (A) and -uncorrected (B) PET images of a 69-y-old woman with lung cancer metastatic to liver. (C) Corresponding CT images. Arrows indicate site of pacemaker implantation and liver metastasis. Artifactually increased focus on attenuation-corrected image appears as cold spot on uncorrected image.

Attenuation-corrected (A) and -uncorrected (B) PET images of a 78-y-old man with a history of lung cancer. The images were obtained after left upper lobectomy. (C) Corresponding CT images. Arrow indicates site of reservoir. Artifactually increased focus on attenuation-corrected image appears as cold spot on uncorrected image.
DISCUSSION
This study found artifactually increased 18F-FDG uptake at the site of pacemaker placement and in 8 of 27 patients in the region of the reservoir of central venous lines. Previously performed studies found similar artifacts caused by metallic implants and contrast agents (8–11). We are unaware of whether similar artifacts occur when conventional attenuation correction is performed using germanium rod sources.
The most commonly used central venous line, Port-A-Cath (Deltec, Inc.), consist of a titanium chamber with a silicon rubber top. In pacemakers, titanium has replaced ceramics and silicon rubber as the main biomaterial component. Inside their housing, pacemakers have a lithium iodine battery and a connector block, composed of polyurethane, which connects the circuitry to the pacing lead. The lead itself is insulated with polyurethane or silicon and may be composed of platinum, titanium, stainless steel, silver, or cobalt alloys (12).
The metallic components of pacemakers and reservoirs induces CT artifacts to a degree that depends on the atomic (Z) number of the metal (13). Consequently, when compared with metallic implants made of stainless steel, those made of titanium cause only mild artifacts on CT (14,15). The CT density of all pacemaker generators was in the range of 3,000 HU. In contrast, the CT density of the reservoirs of the central venous lines varied. The reservoirs associated with artifactually increased 18F-FDG uptake (n = 8) also had HU values of around 3,000 at the site where the line leaves the reservoir, suggesting a metallic component in this region. Importantly, the artifact-free devices had mean HU values of only 1,446 ± 427.
PET/CT image reconstruction faces a technical difficulty in that the attenuation coefficients, μ (x, E), are energy dependent and that, therefore, attenuation coefficients measured at CT energies (up to 140 keV) must be converted to the appropriate PET emission data values at 511 keV (5). Because of this, metallic implants such as dental or orthopedic implants and other materials with high densities can produce data inconsistencies, which result in artifacts on PET images (8,10,11).
The introduction of artifacts in CT-corrected PET images originates from an inaccurate estimation of the attenuation coefficient at 511 keV in the region of the implant (i.e., pacemaker or permanent reservoir) from the CT images. Although some PET/CT systems still provide 68Ge sources, attenuation correction is frequently performed on the basis of the CT data in combined PET/CT imaging.
To better understand the magnitude of the inaccuracy, we conducted phantom experiments whereby a transmission scan of a pacemaker was acquired on the PET/CT scanner and on a conventional PET scanner (ECAT EXACT HR+; CTI/Siemens Medical Systems, Inc.) equipped with 68Ge rod sources. The 68Ge scan transmission image resulted in an attenuation coefficient of 0.20 cm−1, whereas in the PET/CT transmission image the attenuation coefficient was estimated to be 0.032 cm−1. Thus, the current software implementation of the conversion of HU to 511-keV attenuation coefficients resulted in a more than 50% overestimation of attenuation through high-density metals. The effect of this overestimation of attenuation is illustrated by the simulated chest scan shown in Figure 3. In this simulation, the activity distribution and attenuation were assumed to be uniform, except for a 3-cm by 1-cm elliptic section near the chest wall, assumed to be the location of the pacemaker. The attenuation coefficient in this region was set at 0.20 cm−1 with no activity uptake. Using the correct attenuation coefficients (i.e., 0.095 cm−1 for water and 0.020 cm−1 for the pacemaker), attenuated emission projections were generated. In addition, 2 attenuation correction maps were generated: one with the correct attenuation coefficients of the pacemaker and one in which the attenuation coefficient was incorrectly assumed to be 0.032 cm−1. The emission data were then reconstructed with and without the 2 attenuation corrections, using OSEM reconstruction (4 iterations and 8 subsets). The results of these reconstructions are shown in Figure 3. As can be seen in the uncorrected image and the image reconstructed using the correct attenuation coefficients, the area of the pacemaker appears cold. However, when the emission data were corrected using the overestimated attenuation coefficient of the pacemaker, the area became hot, which is consistent with the findings in the patient studies.
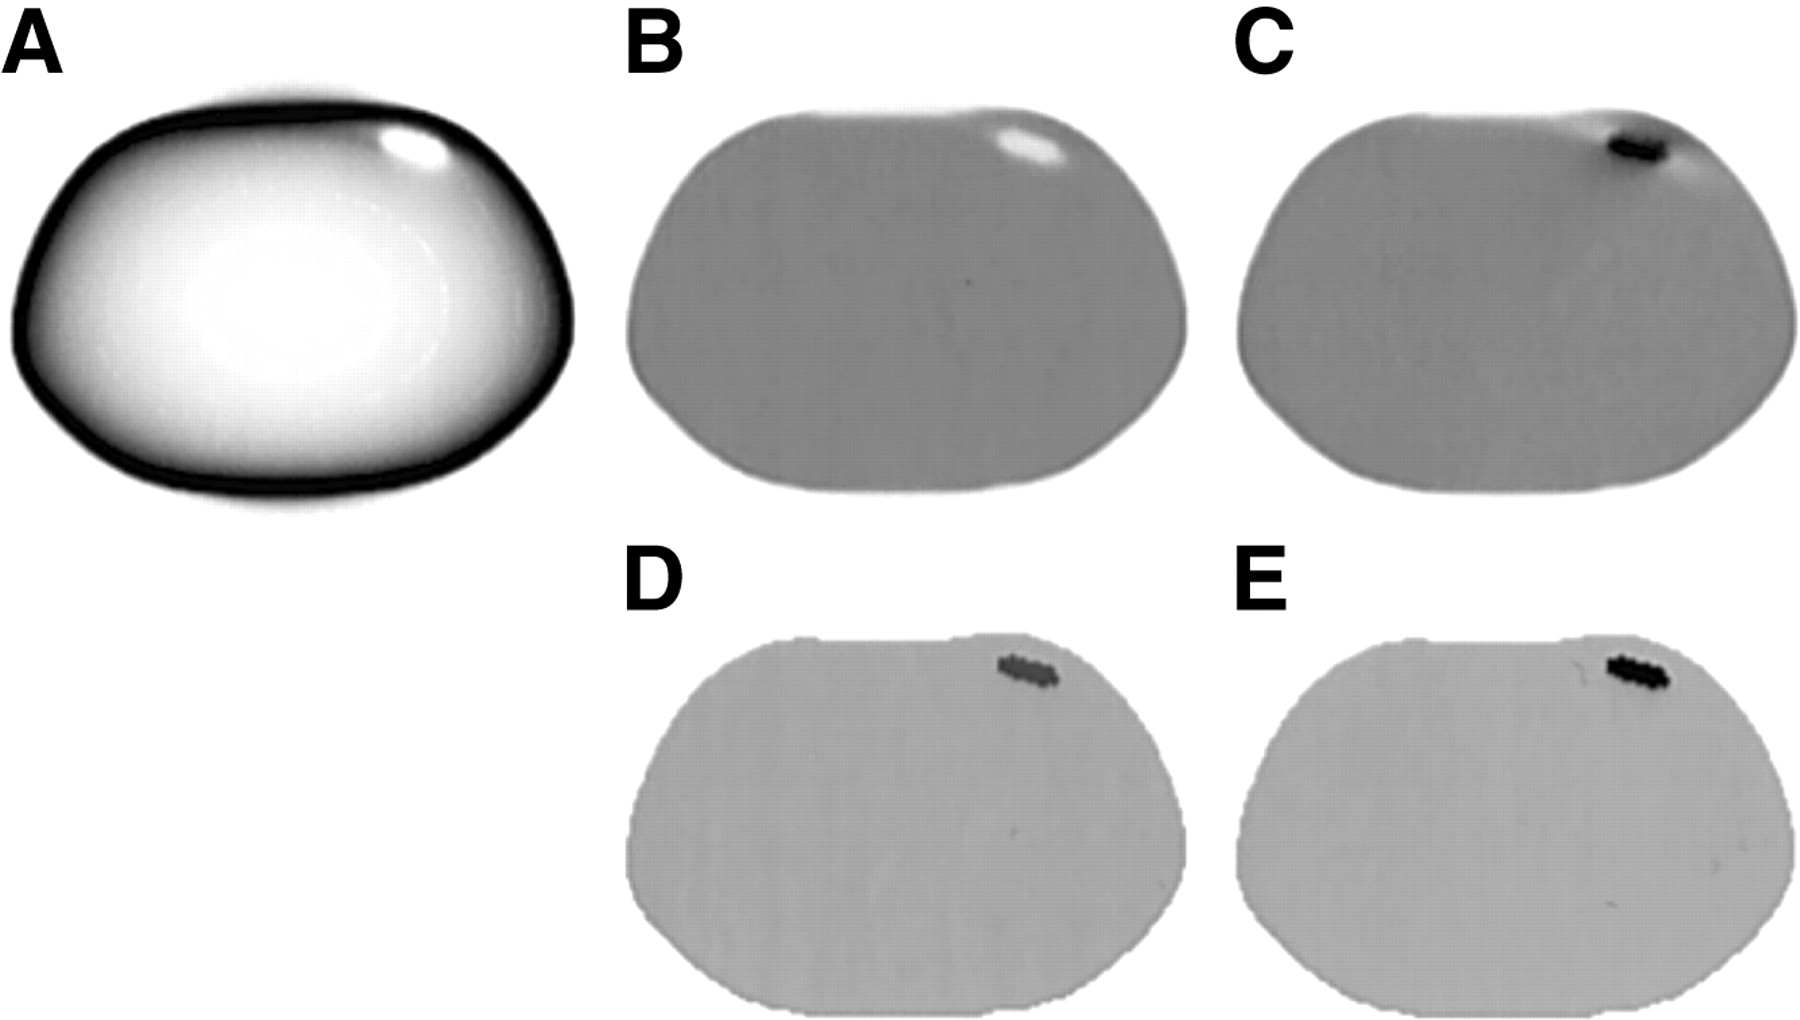
Simulation of effects of overcorrection of attenuation in regions of metal implants such as pacemakers. (A) Reconstructed emission image without attenuation correction. (B and D) Reconstructed emission image (B) using a correct attenuation map (D). (C and E) Reconstructed emission image (C) using an incorrect attenuation map (E) in which attenuation coefficient in region of metal implant was set at 0.032 cm−1 instead of 0.20 cm−1.
The above theoretic considerations have clinical implications. Goerres et al. have shown that inappropriate attenuation correction can cause artifactual 18F-FDG uptake on corresponding PET images (10). In their study, 28 of 33 patients with dental CT artifacts also had corresponding artifacts on PET images. On inspection of both the corrected and the uncorrected images, artifactually increased uptake could easily be discriminated from true hypermetabolic lesions. Another potential source of artifacts are contrast-enhanced CT images. Antoch et al. reported that intravenous contrast agents can result in false-positive PET findings (9). Similar artifacts have been reported by Heiba et al. after total knee replacement (11) and by Goerres et al. when using metallic hip prosthetic material in phantom experiments (8).
CONCLUSION
The current study identifies additional sources of PET artifacts. Pacemakers consistently induced such artifacts, whereas reservoirs of central permanent venous lines induced the artifacts in about one third of the patients. These findings further support the notion that both attenuation-corrected and attenuation-uncorrected PET images need to be reviewed to avoid false-positive PET findings.
Footnotes
Received Apr. 10, 2003; revision accepted Oct. 23, 2003.
For correspondence or reprints contact: Johannes Czernin, MD, Nuclear Medicine, UCLA School of Medicine, AR 128 CHS, 10833 Le Conte Ave., Los Angeles, CA 90095-6942.
E-mail: jczernin{at}mednet.ucla.edu


