


Abstract
Brain edema significantly contributes to the clinical course of human brain tumor patients. There is evidence that an enlargement of the extracellular space (ECS) is involved in the development of brain edema. Although T2-weighted magnetic resonance (T2-MR) images represent brain edema by its increased water content, they do not differentiate ECS enlargement from increased intracellular water content. Methods: On the basis of the known distribution of bromide in the ECS, we used 76Br-bromide and PET to measure the regional ECS in 9 brain tumor patients. Transport rate constants and the distribution volume (DV) of 76Br-bromide in normal brain and tumor were derived from dynamic PET scans and the measured 76Br-bromide concentration in arterial plasma. We evaluated different models regarding their reliability in estimating the ECS. Results: Assuming that the DV of 76Br-bromide represents the ECS, robust estimates were possible for all investigated regions. In normal brain, ECS was within a narrow range—for example, occipital lobe, 19.9% ± 3.1%—and was lower in 2 dexamethasone-treated patients compared with untreated patients. In 7 of 9 tumors, increased ECS ranged between 43.8% and 61.1%. ECS increases were confined to the tumor mass and did not extend into peritumoral edematous brain. Two patients with large hyperintense lesions according to T2-MR images showed normal ECS values within the lesion. Conclusion: 76Br-Bromide PET allows a quantitative measurement of the ECS in brain edema and in normal brain. The discrepancies between lesions shown by T2-MRI and regional ECS enlargement as measured with PET challenge the concept of tumor-induced brain edema.
An increased intracranial pressure is critical for the clinical course of most brain tumor patients. Space occupation arises from the tumor itself as well as from tumor-induced brain edema. According to Klatzo (1), a vasogenic peritumoral edema develops due to increased blood–brain barrier (BBB) permeability, pressure gradients from vascular to extracellular compartments, and fluid retention within the enlarged extracellular space (ECS). Enlargement of the ECS in brain tumors (2–4) may further lead to the evolution of pathologic tissue composition, such as increased intercapillary and perfusion distances for drugs and oxygen, and to the formation of hypoxia. Individual alterations of these mechanisms may substantially contribute to the yet unexplained variability of survival in patients with malignant brain tumors but have not been evaluated in human patients in vivo.
In clinical practice brain edema is assessed using T2-weighted magnetic resonance imaging (T2-MRI) with the assumption that the signal arises from increased tissue water content. However, T2-MRI is not capable of differentiating ECS expansion from increases of intracellular water content—for example, due to axonal swelling. Problems also arise in the differentiation of brain edema due to BBB damage from axonal injury caused by therapeutic irradiation. Finally, both tumor and peritumoral edema have prolonged relaxation times and may not be distinguished by T2-MRI (5,6).
While there are several invasive methods to assess the ECS in animals (7), the dilution of bromide in plasma has been used to determine noninvasively the ECS in total-body tissue in humans (8). This is based on the knowledge that bromide ions distribute principally in the extracellular compartment (9). Body distribution and elimination of bromide are closely related with chloride (10). Both chloride and bromide are small anions. Their intracellular uptake is largely restricted by the negative membrane potential of living cells. The Donnan equilibrium describes the electrochemical equilibrium—that is, approximately 5% of bromide ions are present in the intracellular compartment and 95% are in the ECS (11–13). Therefore, if local bromide tissue distribution can be measured, the regional ECS of any organ can be determined.
In this study, we used radioactive 76Br-bromide and PET to measure 76Br-bromide uptake in normal brain and in brain tumors and to calculate the regional ECS. In analogy to the plasma dilution method with nonradioactive bromide (8), we related 76Br-bromide tissue uptake with the concentration in plasma to calculate the 76Br-bromide distribution volume (DV). Subsequently, we determined the regional ECS in various brain tumors in peritumoral and in normal (contralateral) brain tissue.
MATERIALS AND METHODS
Patients
Nine patients were selected at the Cantonal Hospital Aarau; the clinical data are presented in Table 1. T2-Weighted and gadolinium-enhanced T1-MR images were available for 8 of 9 patients, whereas in patient 4 contrast enhancement T1-MR images were not available. With the exception of patient 3, the PET studies were performed after tumor resection, either with residual or recurrent tumor. Patient 3 was suspected of having a central nervous system lymphoma and was studied 7 d after clinical manifestation of a space-occupying lesion in the right temporal and parietal lobe. Subsequently, the patient recovered completely during steroid treatment, did not undergo lesion biopsy, and remained in full clinical and MR remission without any medication for 15 mo as of the last examination. Although a final tumor diagnosis was not established, this patient was included in our study for demonstration of a normal 76Br-bromide PET image despite significant T2-MR image changes. At the time of the PET study, 4 patients had received chemotherapy after standard radiotherapy: Patients 1, 2, and 8 received temozolomide and patient 9 received PCV (procarbazine, lomustine, vincristine). Informed written consent was obtained from all patients. The study protocol was approved by the Ethical Committee at the Cantonal Hospital Aarau.
Clinical Data
Production of 76Br-Bromide
76Br-Bromide was produced on the basis of personal information (target workshops), but recently a paper was published comprising all-important data of proton irradiation of natural bromide (14). Briefly, a 10-mm-thick NaBr target encapsulated with aluminum was irradiated for 5 h with a proton beam of 60 μA in an energy range of 50–68 MeV. The target was opened 13 h after the end of bombardment by immersion in 5 mol/L hydrochloric acid. At this time point, most 77Kr had already decayed. 76Kr was blown out with a gentle stream of helium containing a few milliliters of carrier krypton through an arsenic trap (Arsen Detection tube; Dräger) and trapped on molecular sieves cooled with liquid nitrogen. After 76Kr had partly decayed to 76Br, the cold trap was warmed to room temperature and the bromine was eluted with 2 mL 0.1 mol/L ammonia containing 12 μg/mL ammonium bromide. An injectable solution was prepared by evaporating the ammonia and dissolving the residue in physiologic saline. In the final 76Br-bromide solution, impurities such as selenium were less than the detection limit of a γ-spectroscopy measurement with an intrinsic germanium detector. The use of the arsenic trap allowed reduction of arsenic impurities to <0.1% of initial activity at the end of target chemistry.
Use of 76Br-Bromide for PET
Radioprotection is an important consideration when using 76Br-bromide as a PET tracer. Nonradioactive bromide is cleared from the human organism by renal excretion and in part via the feces at a very slow rate, resulting in a long biologic half-life of bromide in plasma of 12 d in humans (15,16). Therefore, radioactive 76Br-bromide, with a half-life of 16.2 h, is mainly eliminated by its physical decay. High dietary chloride supply has been shown to accelerate renal bromide excretion in rats (10), and the rate of renal chloride and bromide excretion is also coupled in humans (17). Renal bromide elimination could, in principle, be accelerated by extensive administration of chloride, but this was not feasible in our patients. Under the conservative assumption that 76Br-bromide is eliminated from the body only by its physical decay, we calculated the sum of all organ retention times as the reciprocal of the decay constant—that is, 23.4 h for a half-life of 16.2 h. The total retention time, normal organ weights of human adults, and known bromide organ-to-blood ratios in small animals (9,11) were used to estimate the 76Br-bromide organ retention times, which were then entered in the program MIRDOSE3.1, resulting in a relatively high total-body dose of 0.253 mGy/MBq. For radioprotection, intravenous injection of 76Br-bromide was limited to a maximum of 60 MBq per patient.
76Br-Bromide PET Scanning
For each patient, an individually molded thermoplastic head support was produced, allowing an optimal immobilization of the head during the PET scan. Catheters were placed into a radial artery under local anesthesia and in a vein of the contralateral arm. PET images were acquired with a PRT-2 (prototype rotating tomograph) PET scanner (CTI, Inc.). The scanner consisted of 24 rings containing 2 segments each with 3 × 10 blocks of 64 bismuth germanate crystals per block in an 8 × 8 array. The 47 reconstructed planes cover a transaxial field of view of 15.3 cm, reconstructed in plane, and a transaxial resolution of 6 mm. The sensitivity of the PET camera was 1.1%, yielding 11 kilocounts per second (kcps)/MBq of a point source. The 76Br-bromide was infused intravenously during 3 min using a constant-volume infusion pump. Simultaneously, a dynamic PET scan consisting of 23 frames with a total scan duration of 110 min was started. During this first PET scan, 18 arterial blood samples were drawn and the radioactivity of both whole blood and plasma was measured using a well counter. We then allowed patients to rest and performed a second, static 30-min PET scan 4 h after injection. (range, 3.42–4.28 h after injection). Patients were dismissed and a third, static 30-min scan was started 24 h later (range, 23.28–24.23 h after injection). Immediately before the start of the 24-h scan, we drew a venous blood sample from a cubital vein and measured both plasma and whole blood radioactivity. All blood measurements were decay corrected to the time of tracer injection. We performed a standard cross-calibration between PET images and blood radioactivity by measuring the radioactivity of a known amount of 76Br-bromide in am 1,100-mL water phantom with both the PET scanner and a γ-well counter. A calculated attenuation correction was performed for PET emission data—that is, the contours of an attenuation model for a standard skull were visually fitted to the individual PET emission images—and a correction for the attenuation of the head holder was performed on the basis of phantom measurements with and without the head holder.
Regions of Interest
A standard template of regions of interest (ROIs) was used for all patients and the position, but not the size, of the ROI was adjusted for each patient. ROIs for kinetic analysis were placed in the tumor, in the contralateral frontal and occipital lobe, and in the cerebellum; the respective ROI sizes were 86 voxels (1.3 mL), 782 voxels (11.6 mL), 554 voxels (8.2 mL), and 876 voxels (13.0 mL). Tumor ROIs were placed such that they covered the location with the highest 76Br-bromide accumulation; therefore, these ROIs represent the maximum tumor ECS, not averages. The ROI placement relied on parametric DVLogan 76Br-bromide PET images (see below), because these images were of better visual quality than the 76Br-bromide raw-count images. The placement of the ROI was accomplished by visual comparison with MR images in 6 patients and by coregistration with digitized MR images in 3 patients. We placed the ROI in the brain a sufficient distance from the skull to avoid partial-volume effects from extracerebral structures, taking into account that the ROI in the occipital and the frontal lobe represents a mean of white matter and cortex.
PET Data Quantification
Decay-corrected time–activity curves of different brain regions were derived from the dynamic PET scan ranging from 0 to 110 min after injection by ROI analysis. The 76Br-bromide concentration in arterial blood and plasma samples was used as an input function for kinetic modeling. Time–activity curves from PET images were corrected for spillover by intravascular radioactivity using the measured whole blood radioactivity curve and an assumed partial blood volume of 5% in the brain. The corrected time–activity curve and the arterial input function were then used to quantify the DV of 76Br-bromide in the brain using several models (see below). Because bromide distributes principally in the ECS, the 76Br-bromide DV is closely related to the ECS. At equilibrium, the tissue-to-plasma ratio of the 76Br-bromide concentration—that is, the tissue partition coefficient of 76Br-bromide—equals the DV. Because PET allows a local measurement of the 76Br-bromide concentration in tissue, the regional ECS can be determined.
The DV of 76Br-bromide in tissue was estimated using a standard 3-compartment, 2-tissue model (total DV: DVTOT = K1/k2 × (1 + k3/k4)). In addition, we used a simpler 2-compartment, single-tissue model, in which only 2 parameters, K1′ and k2′, are free, with the intent of obtaining more robust parameter estimates (DV: DV′ = K1′/k2′). Model parameters were calculated by fitting the data with an optimized Marquardt algorithm using the software PMOD (PMOD group, www.pmod.com) (18). The quality of fits using the 2- and 3-compartment models was assessed using the Akaike and Schwartz criteria (19) and a general model selection criterion in PMOD (18).
Because the models described above rely on the presence of either 1 or 2 tissue compartments, we also applied a Logan plot (20), a noncompartmental method. In this model, the parameter DVLogan provides a measure for the bromide DV, regardless of the number of tissue compartments involved. The Logan plot was also performed on a pixel-per-pixel basis, yielding parametric (DVLogan) PET images.
In addition, we performed a Patlak plot (21), based on the observation that the measured concentrations of 76Br-bromide, expressed as tissue-to-plasma radioactivity ratios, showed, in most cases, an initial rapid increase followed by a subsequent slower increase. Patlak plots typically became linear between 15 and 30 min after tracer injection, and linearity was evident in all cases after 60 min. Therefore, a regression line was fitted to Patlak data points for all ROIs from 60 to 110 min after injection (uncorrected time). Arbitrary to some degree, this procedure subdivides the bromide uptake in the brain into a reversible compartment (equilibrium within the first 60 min, denoted by the Patlak parameter VD) and a second, slower compartment, denoted by the Patlak parameter Ki. VD yields an estimate of the ECS, if one assumes that the bromide in the ECS is at equilibrium with plasma after 60 min.
The calculation of the ECS was finally based on DVLogan because the Logan plot provided robust estimates of the bromide DV, without making an assumption about the number of compartments involved in the tissue uptake. However, the DV of bromide is known to be slightly larger than the ECS because the electrochemical Donnan equilibrium allows a small quantity of bromide ions to be present in the intracellular compartment (11,12). The higher protein content of plasma compared with extracellular fluid also plays a role, because bromide distributes only in the aqueous portion of the plasma and extracellular fluid. We used factors of 0.95 and 0.93 to correct for the Donnan equilibrium and the plasma water content, respectively, for converting DVLogan to ECS values. Therefore, the extracellular fraction of the intravascular compartment—that is, the plasma fraction, approximately 2% in brain tissue—is included in our definition of the ECS.
The calculation of the ECS by the Logan method requires arterial blood sampling during a relatively long dynamic PET scan. Because this procedure is invasive, we checked whether a simpler scanning protocol without the use of blood data could provide an estimate of the ECS in a more clinical setting. For that purpose, the time frames from 60 min until 90 min after injection were summed, resulting in a PET image that is equal to a simple static 30-min PET image obtained 60 min after injection. From this image, count ratios between the cerebellum and the tumor were obtained by ROI analysis, and these ratios were multiplied by 0.177 (the mean ECS found in the cerebellum of our 9 patients was 17.7%).
Tumor and Edema Size on PET and MRI
The tumor size was derived from the tumor area calculated from the axial T1-MR plane that showed the greatest contrast-enhancing tumor diameter. The area of the ellipse determined by the maximum diameter of the tumor and its perpendicular was used to quantify size (in units of mm2). Similarly, the area covering tumor and peritumoral edema was calculated on T2-MRI. The same approach was also applied to the parametric DVLogan PET image plane showing the greatest lesion area of increased DV of 76Br-bromide. On coregistered PET and T1-MR images, the planes with greatest lesion size corresponded well to the planes of greatest 76Br-bromide distribution. Tumor ECS values were also compared with gadolinium-enhanced T1-MRI, assessed semiquantitatively by inspection of the MR images to yield ratings of grade 0 (no enhancement), grade 1 (mild to moderate enhancement), or grade 2 (marked, extensive enhancement).
RESULTS
Quantities of 76Br-bromide between 38.0 and 58.8 MBq (mean, 50.7 MBq) were injected, yielding typical counting rates between 8 and 10 kcps during the first scan and 2–3 kcps after 24 h. Examples of the 76Br-bromide time–activity curve in brain normal brain tissue, tumor, and plasma of patient 2 are shown in Figure 1A, where the fits of 2- and 3-compartment models are plotted as dotted and solid lines, respectively. Tissue time–activity curves increased steeply after 76Br-bromide injection and plateaus of different levels for normal brain and tumor tissue were reached after a few minutes. Due to smaller ROI sizes, tumor time–activity curves were markedly more noisy than the normal brain time–activity curve. Plasma radioactivity peaked shortly after injection and then fell to almost constant levels within 60 min. Whole blood radioactivity (not shown) followed a course parallel to plasma radioactivity but was, on average, 19.5% lower, ranging between 15.8% and 23.8% with a SD 2.7% in 9 patients.

(A) 76Br-Bromide time–activity curve in patient 2 with glioblastoma multiforme shows radioactivity of plasma, normal brain tissue, and tumor. Dotted and solid lines through tissue data points represent fits by 2- and 3-compartment models, respectively. (B) Logan plot of same time–activity curve as in A. (C) Patlak plot of same time–activity curve as in A, using linear regression from 60 min to end of scan. There is no significant difference between Patlak time (exposure time) and real PET time in case of 76Br-bromide PET.
Kinetic data are summarized in Table 2. Compartment analysis revealed 2 kinetically separable tissue compartments in normal brain as well as in tumor—that is, Akaike and Schwartz criteria were generally lower in the 3-compartment than in the 2-compartment model criterion (data not shown). However, k4 could not always be determined and the 3-compartment model performed equally well if k4 was kept at 0 in 4 of 9 tumors. In another 2 tumors, k3 could not be determined either—that is, the 3-compartment model did not perform better than the 2-compartment model. In these cases, the DV (DVTOT = K1/k2 × (1 + k3/k4)) could not be calculated. Also, fits of the 3-compartment model were unstable and delivered highly variable estimates of all model parameters. The simpler 2-compartment model yielded stable estimates of K1′, k2′, and DV′. Logan plots always provided robust values for DVLogan, allowing estimation of the 76Br-bromide DV independently of the number of underlying tissue compartments (Fig. 1B). DVLogan was highly correlated with DV′ (not shown). Patlak plots (Fig. 1C) generally became linear within 60 min, thereafter indicating a slow subsequent further tissue influx of bromide by positive Ki values and, thus, also supporting the presence of 2 tissue compartments.
76Br-Bromide Kinetics in Brain Tumor and Normal Brain Tissue
The ECS in normal brain as calculated by DVLogan varied generally within a small range, with highest values in the frontal lobe and lowest values in the cerebellum (Table 2). The ECS of other cortical areas, the basal ganglia, and white matter were found within this range (not shown). However, tumor ECS was increased over a wide range and increased tumor 76Br-bromide accumulation was found in 7 of 9 patients, but not in patients 3 and 4. An example is shown in Figure 2, where a circumscribed area in a glioblastoma multiforme (patient 2) appeared as increased radioactivity accumulation. This area was smaller than a relatively widespread signal increase in the T2-MR image. In Figure 3, extensive MR image changes of patient 4 are shown, but PET images revealed no significant 76Br-bromide accumulation. Parametric DVLogan images generally displayed better visual quality than PET raw-count images (Figs. 2E and 3E) and indicated that the 76Br-bromide accumulation corresponded to increased DVLogan values. In 3 tumors, K1′ was >2 SDs higher than normal ECS in the frontal lobe (Table 2), and K1′ was highest in a meningioma lacking the BBB. 76Br-Bromide tissue-to-plasma radioactivity ratios at 75 min and 4 h after injection did not differ significantly, but ratios at 24 h after injection were higher in both brain tumors and normal tissue.
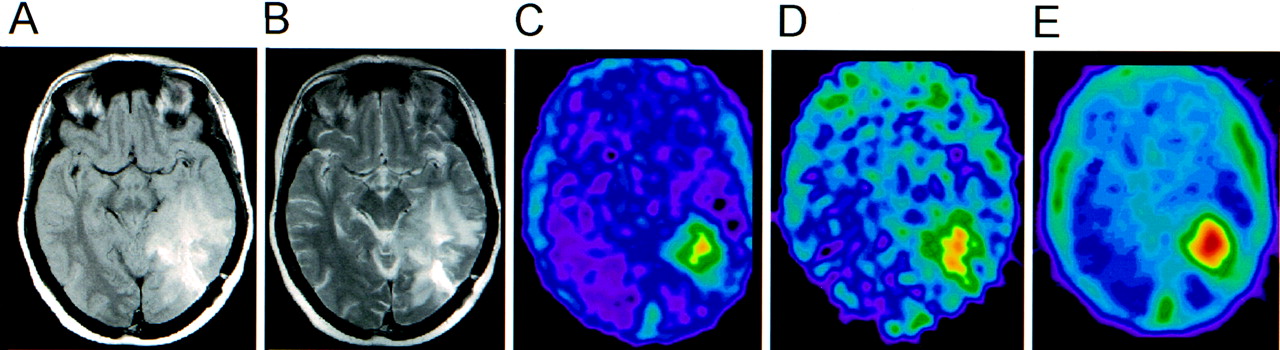
Proton density (A) and T2-MR (B) images of patient 2 with glioblastoma multiforme in left temporal lobe. 76Br-Bromide PET raw-count images from 60 to 90 min (C) and 24 to 24.5 h (D) after injection. (E) Corresponding parametric DVLogan image (pixel-wise Logan plot using dynamic PET data 0–110 min after injection and tracer concentration in arterial plasma as input function).
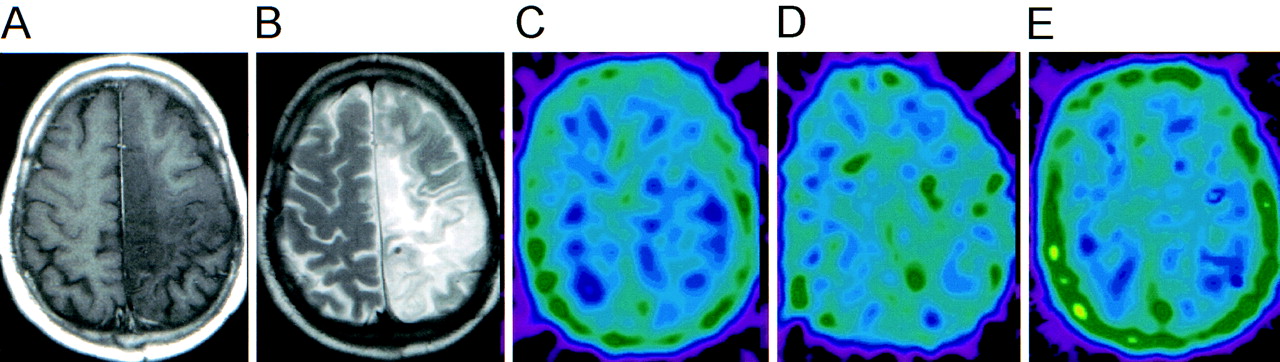
Patient 4 (slowly progressive oligoastrocytoma, World Health Organization stage II). Nonenhancing T1-MR (A) but T2-MR hyperintense (B) tumor is not manifest in 76Br-bromide PET. 76Br-Bromide PET raw-count images from 60 to 90 min (C) and 24 to 24.5 h (D) after injection. (E) Corresponding parametric DVLogan image (pixel-wise Logan plot using dynamic PET data 0–110 min after injection and tracer concentration in arterial plasma as input function).
DVLogan values were highly correlated with a simple tissue-to-plasma radioactivity ratio at 75 min after injection in both normal tissue and tumor (Fig. 4A) and 4 h after injection (Fig. 4B), but the tissue-to-plasma radioactivity ratios at 24 h after injection were markedly higher (Fig. 4C). The reversible bromide DV yielded by the Patlak method (VD) was comparable to DVLogan in normal brain tissue, but VD was significantly lower than DVLogan in 4 of 9 brain tumors (Fig. 5).
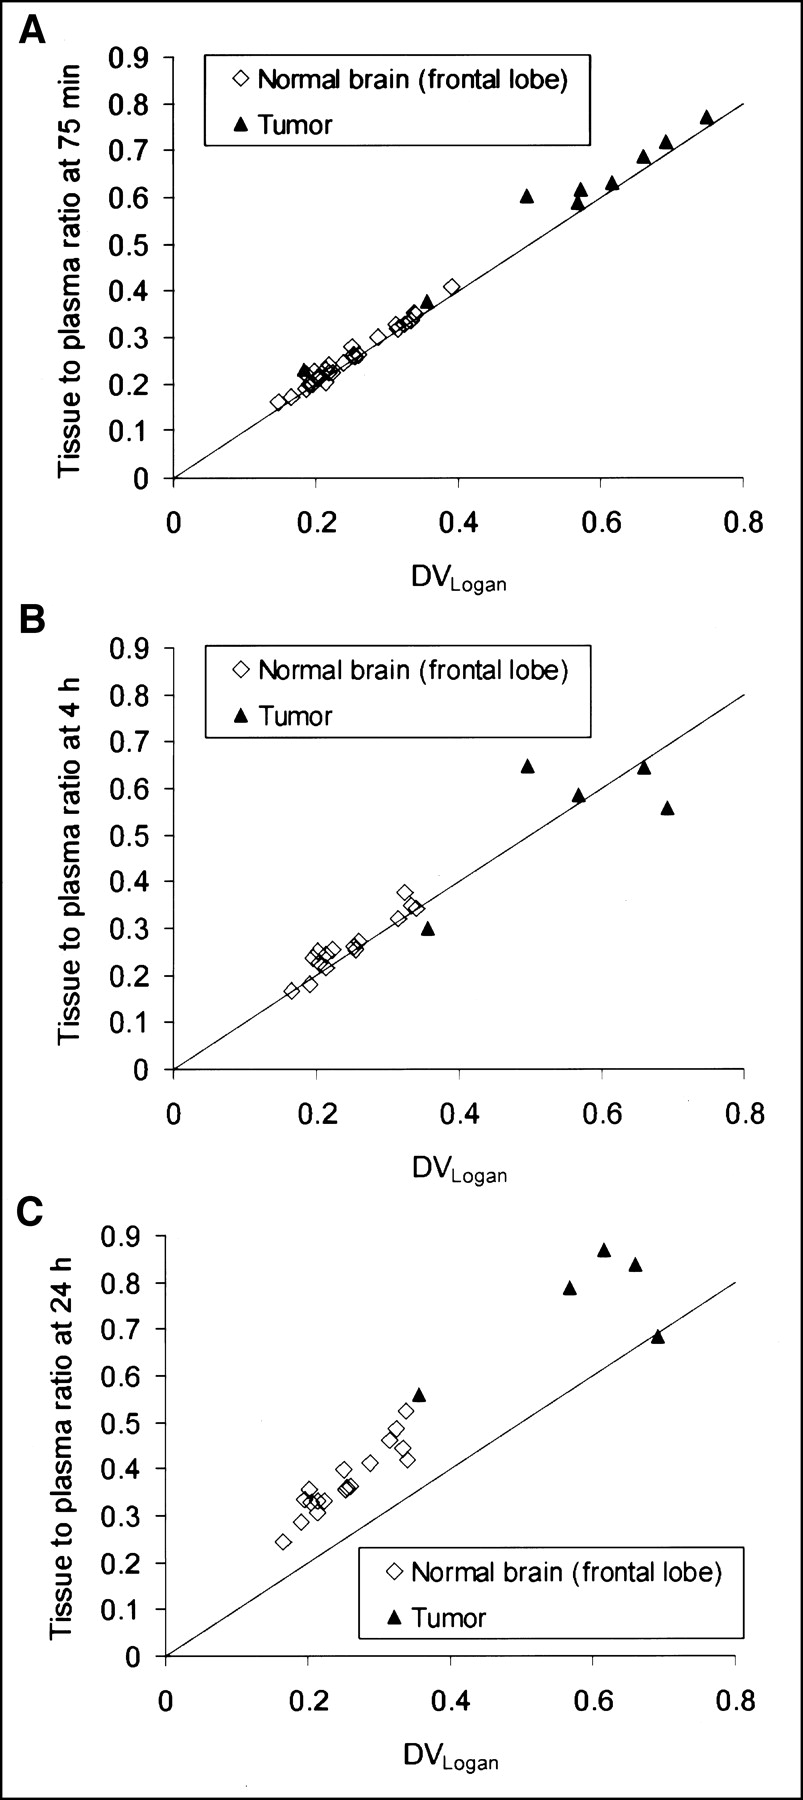
(A and B) DVLogan and simple tissue-to-plasma radioactivity ratios at 75 min (A) and 4 h (B) after injection. Excellent correlation is shown and both are virtually equal. Solid, diagonal line in A–C indicates equality between y- and x-axes. (C) Tissue-to-plasma ratios after 24 h are higher than DVLogan.
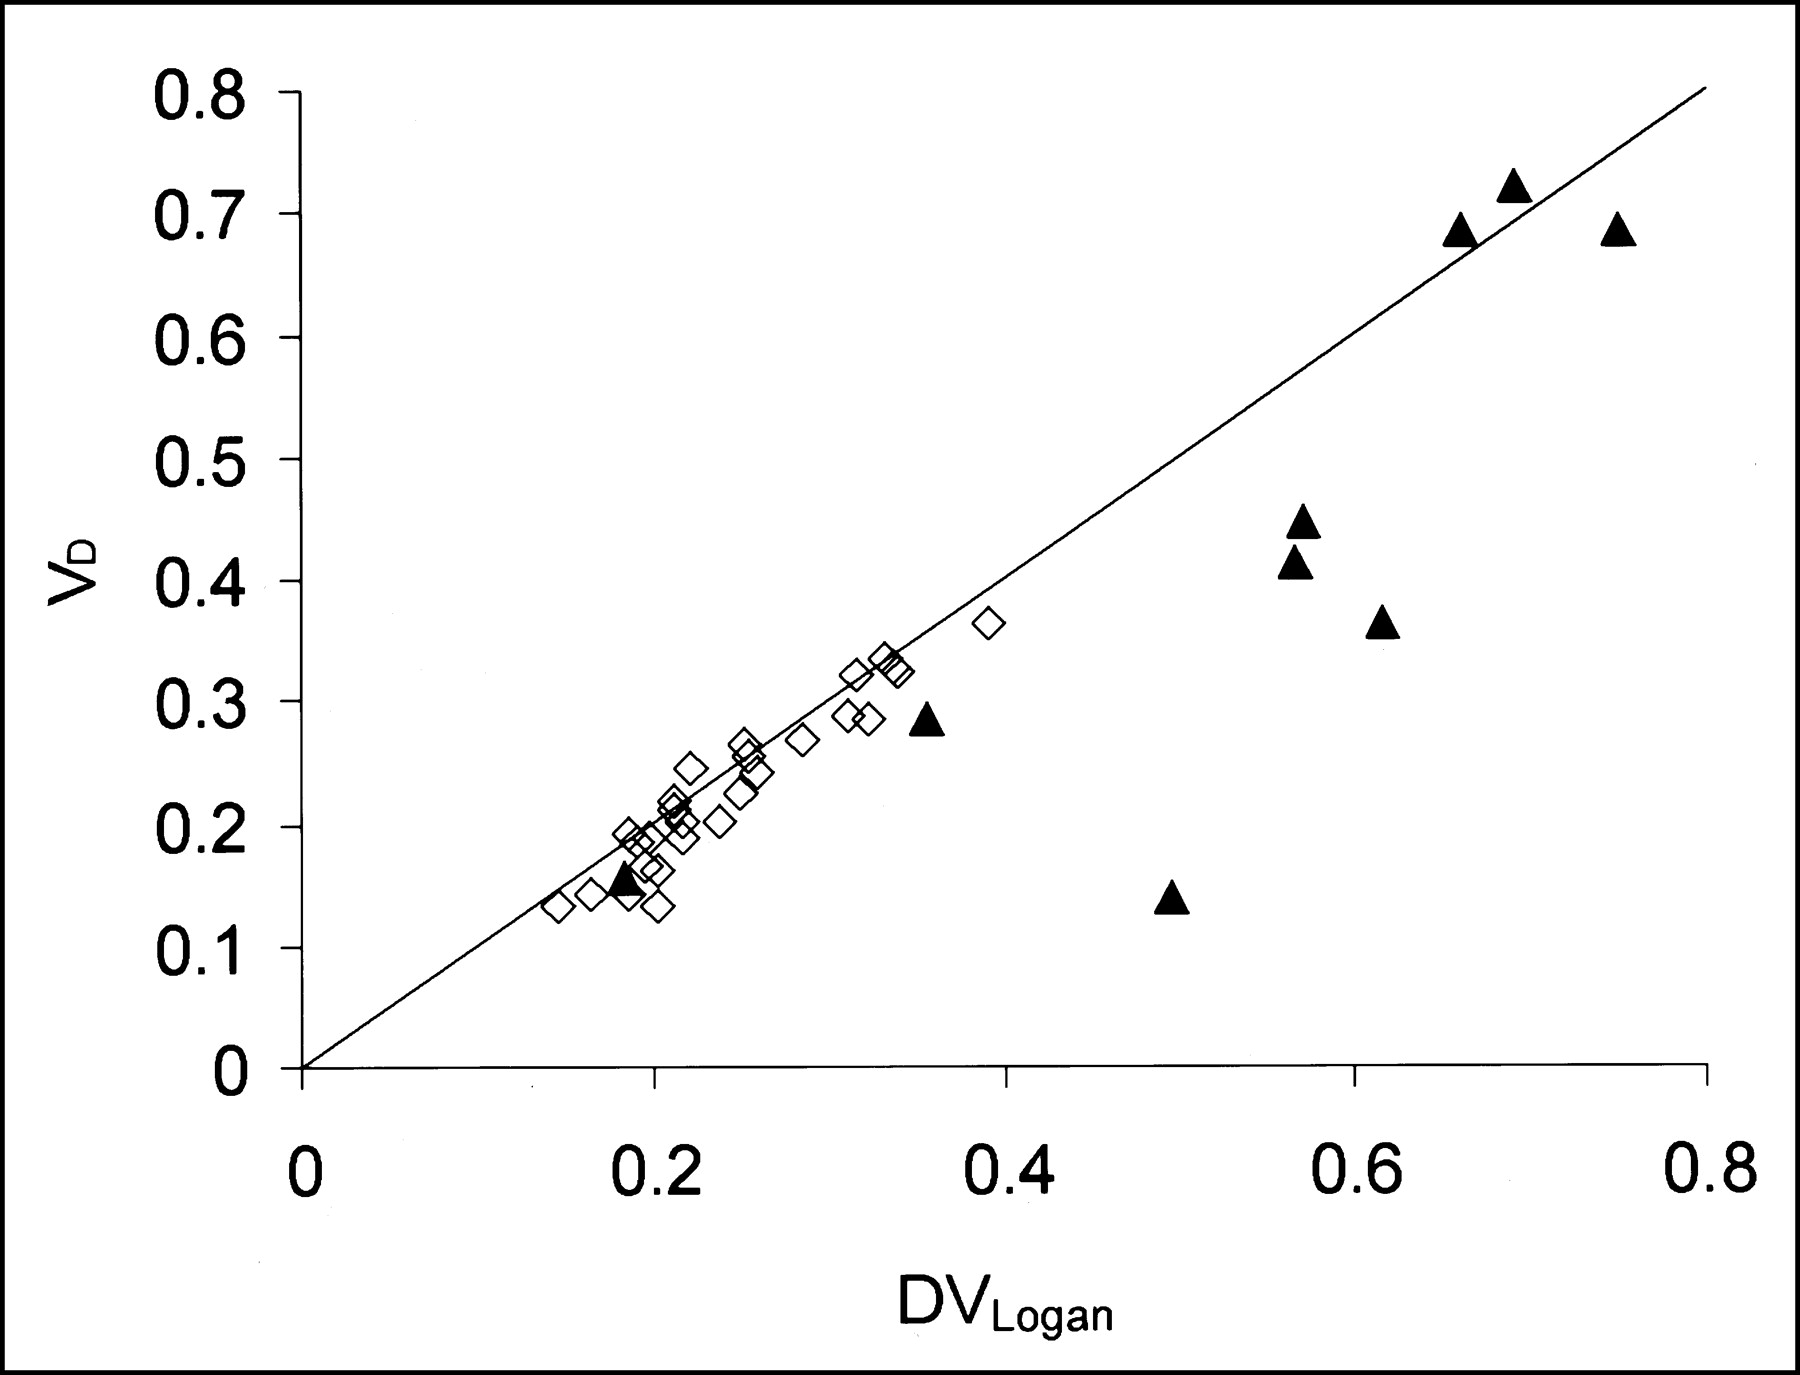
VD is plotted against DVLogan in brain tumor (▴) and in normal tissue (⋄). Solid, diagonal line indicates equality between y- and x-axes. VD is equal to DVLogan in normal tissue, where it ranges between 0.2 and 0.3, but VD is considerably lower than DVLogan in 4 tumors.
All measures of the bromide space (VD, DV′, and DVLogan, the latter exemplified in Fig. 6) showed patients 2 and 3 treated with dexamethasone with the lowest values for the ECS in normal brain tissue, whereas the ECS of the tumors of these 2 patients was in the range of the 7 other tumors.
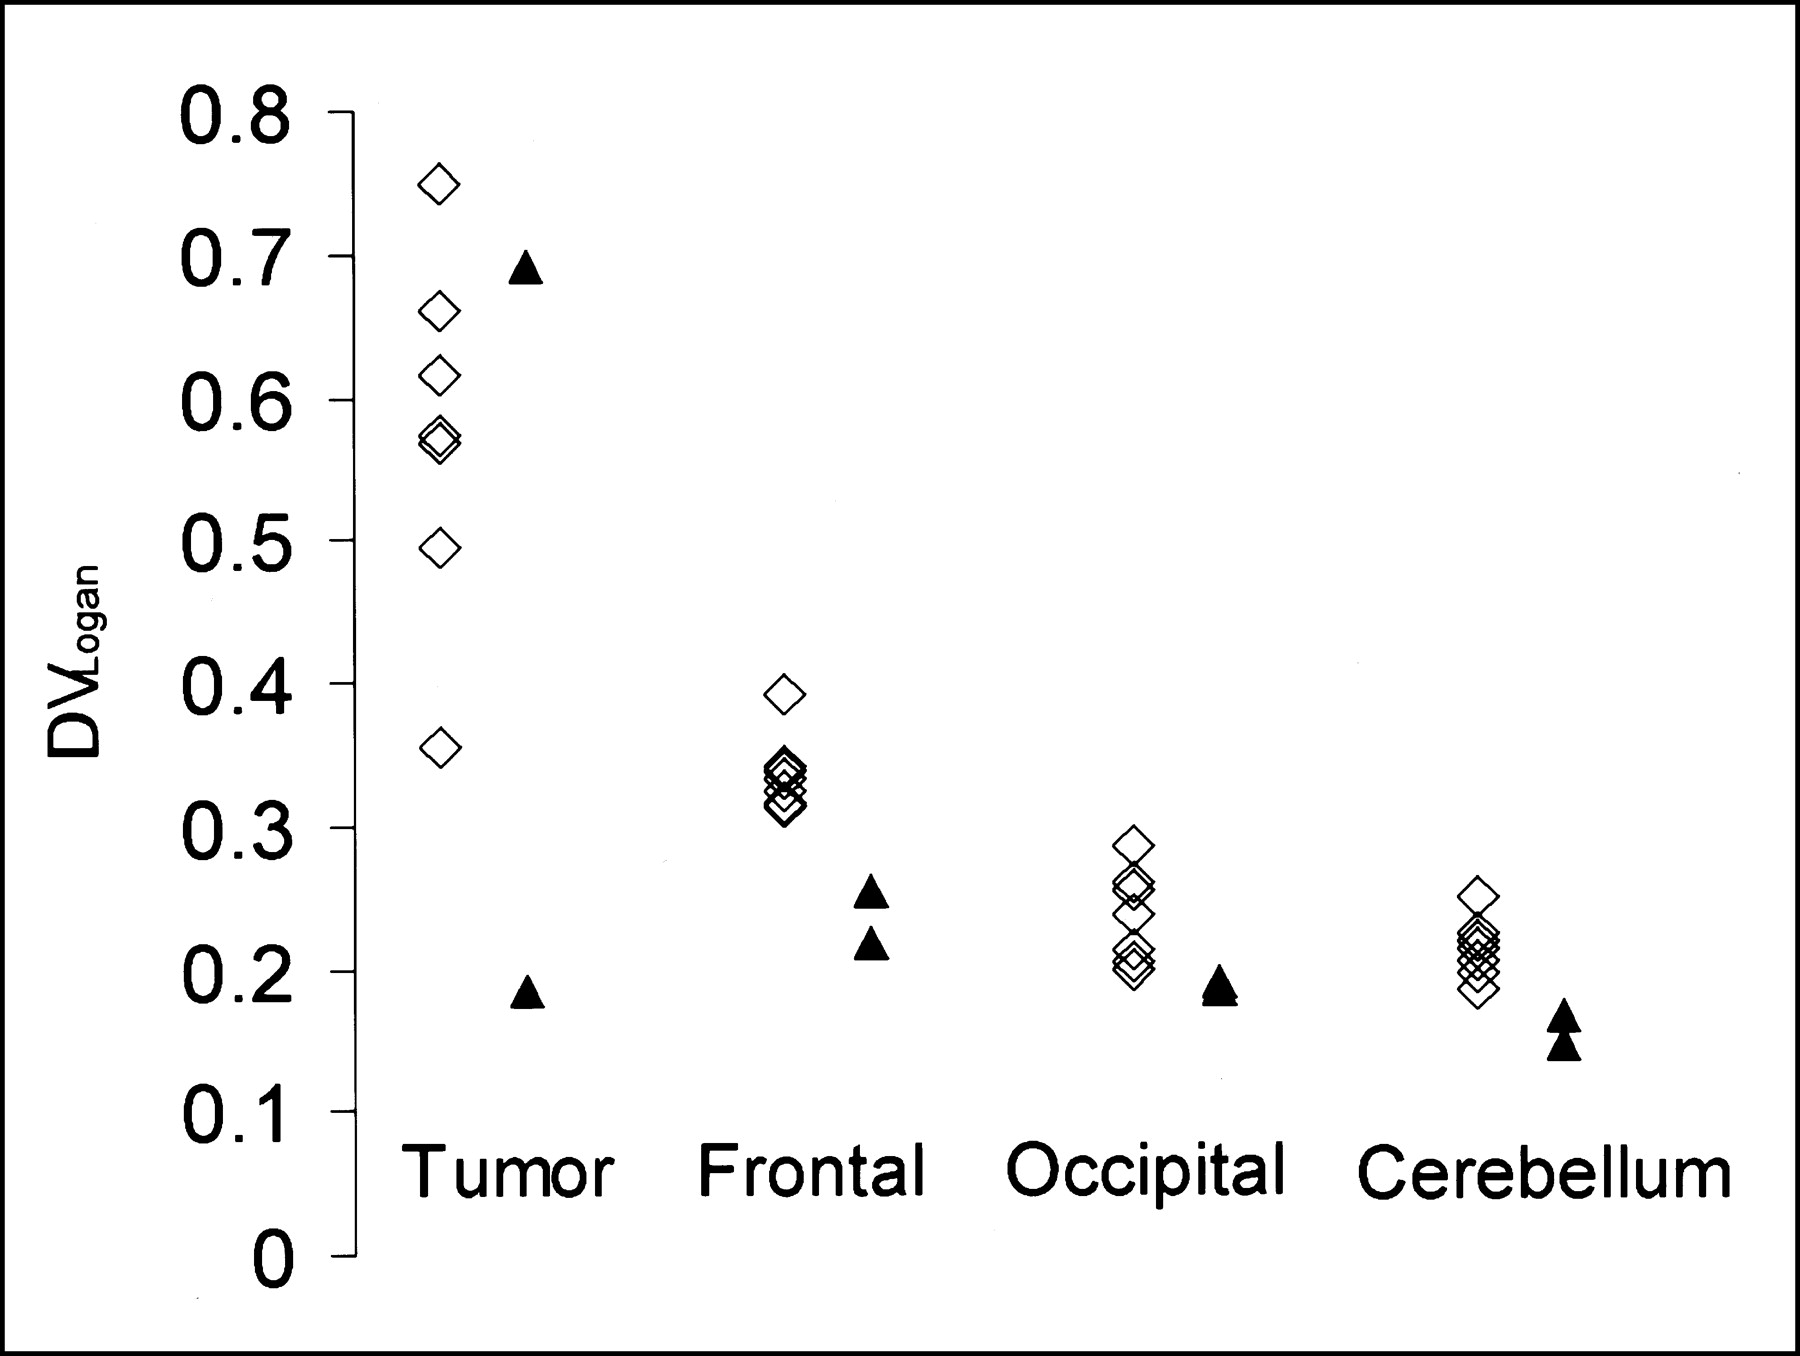
Steroid treatment and ECS. Patients with (▴) and without (⋄) dexamethasone treatment are shown. Two patients treated with dexamethasone show lowest DVLogan values in normal brain.
The intersubject variability of the ECS in the cerebellum of 9 patients was small (mean ± SD, 17.7% ± 2.8%; range, 13%–21.1%). ROI analysis comparing the regional radioactivity in tumor and cerebellum during the PET time frames 60–90 min after injection yielded ratios between 1.42 and 4.20 (Table 2). Multiplication of these ratios with the mean ECS in the cerebellum (17.7%) resulted in estimates for the ECS that were well correlated with the ECS as calculated with the Logan method (Fig. 7).

Comparison of tumor ECS based on DVLogan (x-axis) with simple ROI method comparing radioactivity in tumor with cerebellum 60–90 min after injection (y-axis) shows positive correlation (Spearman rank correlation, P < 0.05). Solid, diagonal line indicates equality between y- and x-axes.
Table 3 shows that the tumor area with increased 76Br-bromide uptake, manifest by increased DVLogan values in 76Br-bromide PET images as exemplified in patient 2 (Fig. 2), was often smaller than the lesion on T2-MR images but matched the size of the T1-MR lesion fairly well. However, patients 3 and 4, who had extensive lesions in T2-MR images, did not show increased 76Br-bromide uptake, with normal ECS values in these lesions. Therefore, the area with increased ECS values determined by PET generally did not exceed the lesion size as observed in T1-MR images and, in particular, did not extend into the peritumoral edema observed in T2-MR images. The size of the tumor area with increased 76Br-bromide uptake correlated with the rankings of gadolinium contrast-enhancement in T1-MR images as a trend.
MRI Lesion Size vs. 76Br-Bromide PET
DISCUSSION
For many years, research on tumor pathophysiology lagged behind that on cellular events of cancer, such as genetic alterations in which knowledge of basic principles advanced rapidly. However, alterations of the vasculature and interstitium and in vivo imaging of tumor pathophysiology gained recent interest, particularly with regard to the delivery of drugs through the tumor interstitium (22). In vivo imaging of the ECS in humans is possible with intravenous gadolinium and dynamic MRI (23). The ECS measured with this technique ranged from 10% to 50% for malignant gliomas (24). However, because gadolinium does not enter the brain across the intact BBB, ECS measurement in tumors with an intact BBB and in normal brain tissue is not possible with this method. In our study, based on the well-recognized fact that bromide ions distribute principally in the ECS in all tissues, we used 76Br-bromide PET to measure the ECS in human brain tumor patients. Bromide is a small ion that can freely pass the BBB and, therefore, can be used to measure the ECS irrespective of the state of BBB.
Previous 76Br-bromide PET studies in human stroke patients (13) yielded relatively low 76Br-bromide tissue-to-plasma radioactivity ratios ranging between 0.1 and 0.12 and, thus, differing considerably from our results. However, our values for the ECS of normal brain tissue are consistent with values of many other methods, which all agree that the ECS in the brain is of the order 20%. For example, the known distribution of 82Br-bromide in the brain of mice exhibits tissue-to-plasma radioactivity ratios of approximately 0.2 and 0.3 after 2 and 24 h, respectively (9). Radiotracer diffusion measurements performed in cats, dogs, and monkeys (25) confirm these higher values and are consistent with more recent work using real-time iontophoresis with tetramethylammonium in vivo (7). Earlier studies using electron microscopy did not consider shrinking artifacts due to the fixation process and reported falsely low ECS values between 6% and 7% (2), but procedures to hinder shrinking have been developed (26) and new electron microscopy studies have confirmed values of 20%.
In normal brain tissue we found the highest ECS values in the frontal lobe and the lowest values in the occipital lobe and the cerebellum. We have no explanation for these regional differences and we did not find evidence for such a pattern in the literature. However, we cannot exclude a regional bias of our ECS measurements—for example, by the attenuation correction algorithm that was not based on a measured, but on a standard, attenuation map of the skull.
Intersubject comparisons of normal brain tissue showed lower values for the ECS in the 2 patients who were treated with dexamethasone (Fig. 6), particularly in the frontal cortex. Although this finding has to be interpreted with care because of the small numbers of patients, it has been reported (27) that dexamethasone reduced the ECS in tumor and in adjacent brain tissue as measured by decreased albumin distribution in RG-2 glioma- bearing rats. However, the tumor ECS of our 2 dexamethasone-treated patients was within a wide range of the ECS of the 7 other tumors. The mechanism of possible dexamethasone action on the ECS of tumor and normal brain in humans is unexplained and needs more extensive investigation.
We found increased ECS values in 7 of 9 brain tumors (Table 2). It appears that the peritumoral edema, as delineated by signal increase in T2-MR images that usually exceeds the extent of lesion observed by T1-MR images, was not associated with increased ECS values—that is, increased 76Br-bromide tumor accumulation was confined to the lesion size in T1-MR images (Table 3). Moreover, 2 patients with space-occupying lesions on T1- and T2-MR images (patients 3 and 4) showed normal ECS values within their lesions. Patient 4 suffered from a slowly progressive, low-grade oligoastrocytoma and patient 3 from a lesion suspected to be lymphoma. The absence of increased 76Br-bromide accumulation cannot be attributed to the BBB because bromide readily crosses the intact barrier also in normal brain (Fig. 1A). Therefore, we assume that T2-MR signal increases in these 2 patients result from intracellular water accumulation and do not reflect an enlargement of the ECS.
Analysis of our PET data revealed 2 kinetic tissue compartments for 76Br-bromide in both normal brain and tumor. However, in some patients, fits for tumor and normal brain with the 3-compartment model did not worsen if k4 was kept at 0 and, thus, the reversibility or irreversibility of the second tissue compartment could not be established. We abandoned the 3-compartment model for ECS quantification and preferred DV′, DVLogan, VD, and simple tissue-to-plasma radioactivity ratios as likely more reliable measures. There was excellent agreement between DVLogan, DV′, and the measured tissue-to-plasma radioactivity ratios at 75 min and 4 h after injection. However, the tissue-to-plasma radioactivity ratios 24 h after injection were higher than the other measures (Fig. 4C), suggesting that DVLogan and DV′ do not account for a slow influx of 76Br-bromide into tissue between 4 and 24 h after injection. The Patlak parameter VD was also correlated with the total DV of bromide (DVLogan in Fig. 5). Equality of DVLogan and VD in normal brain indicates that the bromide fraction showing reversible tissue distribution within the first 60 min (VD) accounts for most of the total DV (DVLogan). In this case, the influence of the second, slow tissue compartment on the total DV of bromide is small and we deduce that VD, DVLogan, and DV′ provide reliable estimates of the ECS in normal brain. However, VD was considerably lower than DVLogan in 4 tumors (Fig. 5; Table 2); this was associated with higher Ki values. In these tumors, a relatively higher bromide tumor uptake into the second tissue compartment may have led to this different kinetic behavior. Possibly, slow intracellular uptake of bromide in necrotic tissue followed initial distribution in the ECS, because only viable cells can exclude bromide ions. Alternatively, a relatively insufficient tumor vasculature could have played a role in a perfusion-limited, slow bromide delivery to the ECS. From our data, there is no evidence whether the bromide distribution in only the first compartment (VD) or in both tissue compartments (DVLogan, DV′) gives a more appropriate estimate of tumor ECS, and further research is needed in this respect.
CONCLUSION
76Br-Bromide PET allows a quantitative measurement of the ECS in normal brain and in brain tumors. We based the calculation of the ECS on the DV of bromide in tissue, requiring arterial blood sampling and relatively long dynamic PET scans. In a more clinical setting, however, the tumor ECS can be estimated reliably and noninvasively by simple radioactivity ratios from ROI analysis of a static 30-min PET scan, where the cerebellum serves as a reference region with a small intersubject variability of the ECS. Limitations arise from the long effective half-life of 76Br-bromide in humans, which allows the application of only small amounts of radioactivity, resulting in low-count PET images with poor statistics—particularly in small tumor ROIs. Also, the presence of a second tissue compartment, which may affect the total 76Br-bromide DV, particularly in tumor, remains unexplained. Our study found unexpectedly that peritumoral edematous brain showed no enlargement of the ECS and that even progressing tumor with an extensive lesion can evolve without ECS expansion. This challenges the concept of tumor-induced brain edema, particularly as assessed with T2-MRI. 76Br-Bromide PET can also be applied to study the effect of postoperative radiotherapy on interstitial space in patients with malignant gliomas, which is relevant for drug distribution and subsequent chemotherapy.
Acknowledgments
The authors thank Yvonne Eichholzer and Claudia Keller for their technical assistance in radiochemistry and in PET scanning
Footnotes
Received Oct. 9, 2002; revision accepted Mar. 28, 2003.
For correspondence or reprints contact: Matthias Bruehlmeier, MD, Cantonal Hospital Aarau, Buchserstrasse 1, CH-5001 Aarau, Switzerland.
E-mail: matthias.bruehlmeier{at}ksa.ch
REFERENCES
In this issue


Jump to section
Related Articles
Cited By...
- Residual Tumor Volume, Cell Volume Fraction, and Tumor Cell Kill During Fractionated Chemoradiation Therapy of Human Glioblastoma using Quantitative Sodium MR Imaging
- Development of a Widely Usable Amino Acid Tracer: 76Br-{alpha}-Methyl-Phenylalanine for Tumor PET Imaging
- PET Imaging of Norepinephrine Transporter-Expressing Tumors Using 76Br-meta-Bromobenzylguanidine
- The Role of Myosin II in Glioma Invasion of the Brain