


Abstract
Gated blood-pool SPECT (GBPS) has several potential advantages over planar radionuclide ventriculography (PRNV), including the possibility of greater repeatability of left ventricular ejection fraction (LVEF) and the noninvasive calculation of left ventricular end-systolic volume and left ventricular end-diastolic volume (LVEDV). The aim of this study was to assess the repeatability of LVEF and LVEDV from GBPS and to compare LVEF with those from PRNV. Methods: Fifty patients underwent PRNV and GBPS, 23 of whom also had repeated studies in the same session. GPBS studies were processed using the Cedars Sinai Quantitative Blood-Pool SPECT (QBS) software that automatically calculates LVEF and LVEDV. Automatic processing with QBS was successful in 70% of the GBPS studies, with the remaining studies processed using the manual option in QBS. All PRNV studies were processed using a manual processing technique. Results: Comparison of LVEF from PRNV and GBPS yielded a correlation coefficient of 0.80. Bland–Altman analysis demonstrated a mean difference of 0.74% ± 7.62% (mean ± SD) between LVEF from the 2 techniques. The 95% limits of agreement are therefore −14.50% to +15.98%. The correlation between repeated measurements was 0.87 for GBPS and 0.95 for PRNV. Bland–Altman analysis revealed poorer repeatability for GBPS (95% limits of agreement, −9.63% to +14.97% vs. −4.66% to +5.92%; P = 0.003). The mean LVEDV was 198 ± 94 mL, with a mean difference of 9 ± 47 mL between repeated measurements. The 95% limits of agreement are therefore −85 to +103 mL. Conclusion: GBPS provides a less repeatable measurement of LVEF than PRNV. Repeatability of LVEDV measurements from GBPS is poor.
Planar radionuclide ventriculography (PRNV) is a well-established, highly repeatable technique for the assessment of left ventricular ejection fraction (LVEF) (1,2). Gated blood-pool SPECT (GBPS) is an alternative to PRNV (3–7) and offers potential advantages: Improved repeatability may be obtained because of the better separation of the cardiac chambers and the elimination of the need for background subtraction. There is no need to search for the best-septal projection at acquisition time, which is time-consuming. In addition, ventricular volumes can be calculated without blood samples and attenuation correction, both of which are needed with the planar technique.
Despite these advantages, GBPS has not replaced PRNV for the assessment of left ventricular function. This is probably because manual processing of GBPS data is much more time-consuming than for PRNV data. Two automatic processing packages for the calculation of left ventricular function from GBPS studies have been described recently and are commercially available (8,9). The aim of this study was to assess the repeatability of one of these software packages (9) for the measurement of LVEF and left ventricular volumes. In addition, the LVEFs obtained from GBPS were compared with those from PRNV studies in the same group of patients.
MATERIALS AND METHODS
Fifty patients with heart failure due to left ventricular systolic dysfunction (LVEF ≤ 40% by echocardiography), who were being assessed for inclusion in a study to assess the effects of different forms of ventricular pacing, were identified. Each patient had a permanent cardiac pacemaker in place, implanted for conventional indications, and was receiving optimal treatment for their heart failure in the form of an angiotensin-converting enzyme inhibitor and a β-blocker for at least 3 mo before entering the study. Loop diuretics were omitted on the morning of each scan. In each patient, the heart rate at which the pacemaker was set was left unchanged for at least 3 mo before the study and during the course of each of the scans. All 50 patients underwent planar and tomographic blood-pool imaging in the same session. Twenty-three of these patients had repeated planar and tomographic studies, immediately after completion of the first set of images. Patients were asked to sit up or get off the imaging couch between the first and second set of images. This action introduces potential differences in patient position between studies, which may influence the repeatability of the technique.
PRNV
Intravenous administration of stannous agent (Amersham Health, Buckinghamshire, U.K.) was followed 20 min later by 800 MBq 99mTc-pertechnetate. A left anterior oblique (LAO) best-septal view and an LAO 70° view gated to the electrocardiogram were acquired with a magnification factor of 2.19 (pixel size, 4.4 mm) and each for a duration of 600 s. Sixteen frames per cardiac cycle were acquired. All images were acquired using an ADAC Forte dual-head gamma camera (Philips Medical Systems, Eindhoven, The Netherlands) fitted with Vertex General Purpose (VXGP) collimators.
The images were transferred to a Link Medical MAPS 10,000 computing system (Link Medical, Hampshire, U.K.) for analysis. The LAO best-septal image was used for calculation of ejection fraction. A single region of interest (ROI) was drawn around the left ventricle, simultaneously using the end-diastolic, end-systolic, stroke volume, and paradox images. A further ROI was drawn adjacent to the ventricle to estimate background activity. The ventricular region was used to estimate ventricular counts at both end-diastole and end-systole. The average of the counts in the background region for each frame of the cardiac cycle was used for background correction and ejection fraction calculated using the standard formula:
 Eq. 1 where EF is ejection fraction, EDc is end-diastolic counts, ESc is end-systolic counts, and BGD is area-normalized background counts. In addition, all PRNVs were reframed to give 8 frames per cardiac cycle. These studies were reprocessed in the same way as for the 16-frame studies.
GBPS
Immediately after obtaining the planar views, a gated tomographic acquisition was performed using the gamma camera described above, with the 2 detectors in the 90° configuration. Data were acquired over a 180° arc, extending from the right anterior oblique to the left posterior oblique, in 64 steps (32 per detector) with data acquired for 20 s at each position. A roving acquisition zoom of 1.46 was applied, resulting in a pixel size of 6.6 mm. Eight frames per cardiac cycle were acquired.
The projection images were processed on an ADAC Pegasys computing system (Philips Medical Systems). Filtered backprojection was used to reconstruct the data with a Butterworth filter (cutoff frequency, 0.38 cycle/cm; order, 5). A single operator reoriented the resulting axial images to produce images in the short-axis projection. These short-axis images were than analyzed using the Quantitative Blood-Pool SPECT (QBS) software described by Van Kriekinge et al. (9). This software automatically fits left and right ventricular ROIs and calculates left and right ventricular ejection fractions and volumes. Only the left ventricular values were used in this study. An experienced observer visually checked the ROIs to ensure they followed the left ventricular contour and did not extend into other structures, such as the right ventricle or the left atrium. If the ROIs were judged to be incorrect, the manual option within QBS was used for calculation of LVEF and LV volumes. This is not an entirely manual option but, rather, a semiautomatic technique, which allows the user to define a left ventricular mask to assist the operation of the automatic algorithm.
To assess intraobserver reproducibility, a subgroup of 20 GBPS studies were reconstructed and processed again by the same operator, with an interval of 6 mo between processing each study. A second operator reconstructed and processed the same 20 studies to assess interobserver reproducibility.
Statistical Analysis
Correlation analysis was used to assess the strength of the relationship between ejection fractions calculated using GBPS with those calculated using PRNV. Bland–Altman analysis (10) was used to assess agreement between LVEFs from GBPS and PRNV. Similarly, repeatability and reproducibility were assessed using the correlation coefficient and Bland–Altman analysis. The statistical significance of differences in repeatability was assessed using the technique described by Martin Bland (Medical Statistics Group, St. George’s Hospital Medical School, London, U.K.; http://www.sghms.ac.uk/depts/phs/staff/jmb/compsd.htm). Briefly, the differences between repeated measurements using the same technique in the same subject are squared and transformed logarithmically. A standard t test was then used to compare these differences between techniques.
RESULTS
Automatic ROI fitting was successful in 70% of patients (35/50); the remaining patients were all processed using the manual option in QBS. The mean LVEF from 8-frame PRNV studies was significantly lower than that from 16-frame studies (21.6% ± 8.9% vs. 24.3% ± 10.2%; P < 0.001), but neither was significantly different from the mean LVEF from GBPS (23.6% ± 11.9%).
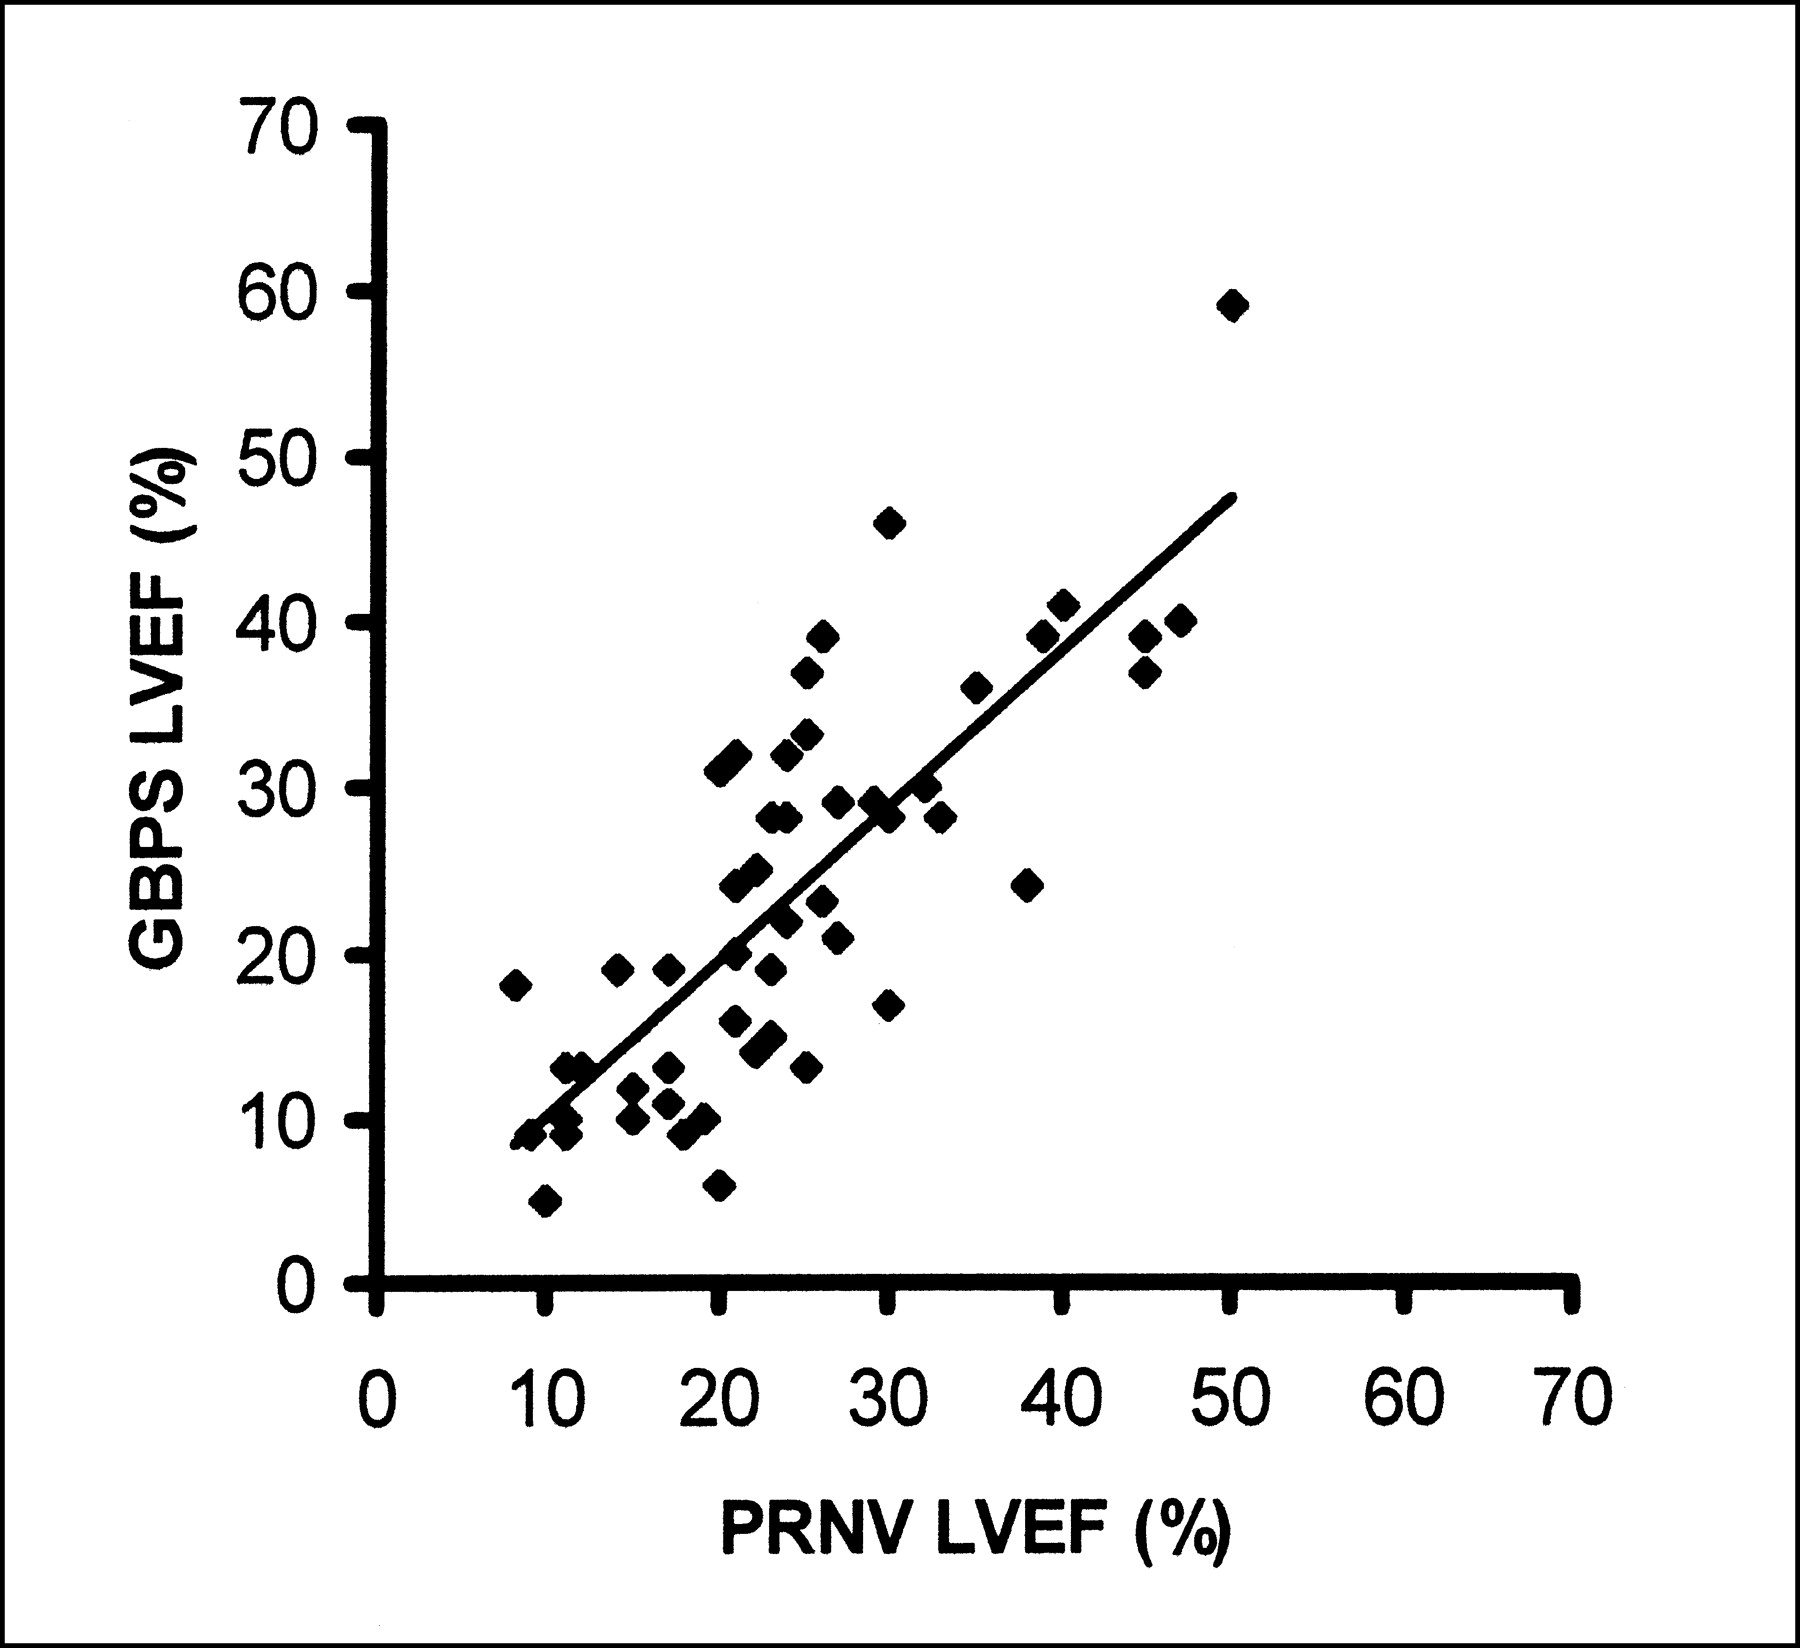
Comparison of LVEFs from PRNV and GBPS yielded a correlation coefficient of 0.80 for 16-frame PRNV studies (Fig. 1) and 0.79 for 8-frame studies. Bland–Altman analysis demonstrated a mean difference of 0.74% ± 7.62% (mean ± SD) between LVEFs from GBPS and 16-frame PRNV studies (Fig. 2) and −2.02% ± 7.38% between GBPS and 8-frame PRNV studies. The 95% limits of agreement are −14.50% to +15.98% and −16.78% to +12.74% for 16- and 8-frame PRNV studies, respectively. When only the 35 patients for whom automatic processing of the GBPS data were considered, the correlation was 0.83 (16 frames) and the mean difference was 0.86% ± 6.77% (95% limits of agreement, −12.68 to +13.54).

Regression analysis of LVEF from GBPS and 16-frame PRNV.

Bland–Altman plot of LVEF from GBPS and 16-frame PRNV shows wide 95% limits of agreement.
The correlation between repeated measurements of LVEF was 0.87 for GBPS, 0.95 for 16-frame PRNV, and 0.94 for 8-frame PRNV. Bland–Altman analysis revealed poorer repeatability for GBPS (2.67% ± 6.15%) compared with both 16- (1.26% ± 2.96%) and 8-frame PRNV studies (0.61% ± 2.74%). The 95% limits of agreement are therefore −9.63% to +14.97% and −4.66% to +5.92% (P = 0.003) for GBPS and 16-frame PRNV, respectively (Fig. 3). In the 10 patients for whom both GBPS studies were successfully processed automatically, the repeatability was similar to that for the whole group (1.00% ± 6.13%).

Bland–Altman plot of LVEF from repeated GBPS (A) and 16-frame PRNV (B) studies shows wider 95% limits for GBPS.
The mean left ventricular end-diastolic volume (LVEDV) from GBPS was 198 ± 94 mL, with a mean difference of 9 ± 47 mL between repeated measurements (Fig. 4). The 95% limits of agreement are therefore −85 to +103 mL. Subgroup analysis of the 10 patients for whom both GBPS studies were successfully processed automatically revealed better (P < 0.01) repeatability of LVEDV than for the whole group at 5 ± 26 mL.

Bland–Altman plot of LVEDV from repeated GBPS studies shows wide 95% limits of agreement.
When the same data were processed twice by the same observer, there was a high correlation between the 2 measurements of LVEF (r = 0.97) and LVEDV (r = 0.97). The mean paired difference was 0.70% ± 3.23% for LVEF and 6 ± 30 mL for LVEDV. When the same data were processed by a second operator, again, there was high correlation between the 2 measurements of LVEF (r = 0.96) and LVEDV (r = 0.98). The mean paired difference was 0.25% ± 4.10% for LVEF and 4 ± 27 mL for LVEDV.
DISCUSSION
This study investigated the use of GBPS imaging for the assessment of left ventricular function in a group of patients with heart failure. Planar gated blood-pool imaging is the gold standard for the assessment of LVEF, largely because of the excellent repeatability. This excellent repeatability was confirmed in this study, regardless of whether 16- or 8-frame studies were used. When assessing repeatability, the important figures in the analysis are the SDs because these indicate the random error and, therefore, uncertainty in measured values. The mean differences represent the systematic error and these were not significantly different from zero. This is as expected because no systematic error would be expected between repeated measurements using the same technique. The random error in LVEF from GBPS is more than twice that with PRNV. The 95% confidence intervals (±2 SD) around the systematic difference are ±5.92% and ±12.30% for PRNV and GBPS, respectively.
Although there was no significant systematic difference between LVEF from GBPS and PRNV, Bland–Altman analysis shows the relatively wide 95% confidence limits (−14.50% to 15.98%). These results are similar to the range reported by Van Kriekinge et al. (9) in 89 patients. This wide range is probably due to the poor repeatability of the GBPS technique. The use of 8 frames per cardiac cycle for the GBPS studies is likely to have given an underestimate of the LVEF compared with those that would be obtained using 16-frame studies. This has been demonstrated previously for tomographic myocardial perfusion studies in which 8-frame studies resulted in ejection fractions, on average, 3.7% lower than those from 16-frame studies (11). In this study, reframing of the PRNV data to 8 frames resulted in a lower mean LVEF compared with GBPS, but the difference was not statistically significant. The 95% confidence limits of agreement between 8-frame PRNV and GBPS studies were similar to those obtained with 16-frame studies.
A potential advantage of GPBS is the possibility of obtaining absolute ventricular volume measurements in addition to LVEF. However, this study demonstrates a 95% confidence interval of ±94 mL for measurements of LVEDV. This level of uncertainty will limit the clinical usefulness of such measurements.
The success rate of the automatic algorithm was relatively poor in this study, with 30% of studies requiring manual intervention. This is identical to the results of Van Kriekinge et al. (9), who found that automatic ROI fitting was successful in 70% of the patients (121/172) in their study. In our study, subgroup analysis of the patients in which automatic GBPS processing was successful revealed only a minor narrowing of the 95% confidence limits between LVEFs from PRNV and GBPS and between repeated GBPS studies. However, there was some improvement in the repeatability of LVEDV when only the automatically processed studies were considered.
Despite the automated nature of the QBS algorithm, differences between values obtained by repeated processing of the same data still exist, albeit smaller in magnitude than the differences between repeated acquisitions. These differences are probably due to small variations in the manual reorientation of the reconstructed data during reconstruction.
The type of patient used in this study represents a relatively small subgroup of all patients who require assessment of left ventricular function. Pacing induces ventricular dyssynchrony and this may have impaired the repeatability of the measurements in this study. However, it is likely that ventricular dyssynchrony reduces the accuracy and repeatability of measurements by echocardiography even more, whereas a pacemaker is generally held to be a contraindication to MRI. Accordingly, blood-pool imaging with nuclear techniques may be the technique of choice for imaging these patients. Additionally, the use of permanently paced patients reduces the potential confounding effect of changes in heart rate during data acquisition.
CONCLUSION
Despite potential advantages, GBPS processed using the QBS algorithm results in a less repeatable measurement of LVEF than PRNV. The repeatability of LVEDV measurements from GBPS is poor.
Acknowledgments
We acknowledge the assistance of the technical staff of the Nuclear Medicine Department in the acquisition of the data for this study and Ian Brabiner for his assistance with the processing of the SPECT data. This study was supported by a grant from the British Heart Foundation.
Footnotes
Received May 29, 2002; revision accepted Oct. 8, 2002.
For correspondence or reprints contact: Graham A. Wright, MSc, Department of Nuclear Medicine, Hull Royal Infirmary, Anlaby Rd., Kingston Upon Hull, U.K.
E-mail: graham{at}physicist.net
In this issue


Jump to section
Related Articles
Cited By...
- Evaluation of Left and Right Ventricular Ejection Fraction and Volumes from Gated Blood-Pool SPECT in Patients with Dilated Cardiomyopathy: Comparison with Cardiac MRI
- Mechanisms of Sudden Cardiac Death in Myocardial Infarction Survivors: Insights From the Randomized Trials of Implantable Cardioverter-Defibrillators