


Abstract
The use of mice with targeted gene deletions (knockouts [KOs]) provides an important tool to investigate the mechanisms underlying behavior, neuronal development, and the sequella of neuropsychiatric diseases. MRI has been used to image brain structural changes in KO mice but, to our knowledge, the feasibility of using PET to investigate brain neurochemistry in KO mice has not been demonstrated. Methods: We have evaluated the sensitivity of the microPET to image dopamine D2 receptor (DRD2) KO mice (D2−/−). PET measurements were performed in wild-type (D2+/+) mice and KO (D2−/−) mice using a microPET scanner. Briefly, each animal was anesthetized and injected intravenously with 11C-raclopride, a DRD2-specific ligand, and dynamic PET scanning was performed for 60 min. Results: The 11C-raclopride images of the KO mice showed significantly lower binding in the striatum (ST) than those of the wild-type (WT) mice, which was confirmed by the time-activity curves that revealed equivalent binding in the ST and cerebellum (CB) in KO mice, whereas the WT mice had significantly higher binding in the ST than in the CB. The ST/CB ratio was significantly higher in WT mice than in KO mice (ST/CB = 1.33 ± 0.13 and 1.05 ± 0.03, respectively; P < 0.002; n = 10). The microPET images were compared qualitatively with conventional autoradiography images. Conclusion: These data support the use of microPET as an effective in vivo imaging tool for studying noninvasively KO mice. These same tools can be extended to investigate other genetically engineered murine models of disease. Future studies will seek to use microPET to investigate the relationships between genes, neuronal activity, and behavior.
The use of PET and molecular imaging to study the biologic processes associated with neurologic disorders as well as other diseases is rapidly growing as an effective tool in biology and medicine. Recently, the use of labeled molecules specific to the disease of interest has made PET an important tool in detecting and studying a wide variety of diseases, including Alzheimer’s disease (1), Huntington’s disease (2), coronary heart disease (3), cancer (4,5), alcoholism (6,7), and drug abuse (8–10). Recent PET studies have started to link disease-associated genetic mutations with specific brain metabolic and biochemical abnormalities that occur before disease presentation (2,11–13). These studies have highlighted the potential of PET as a tool to investigate the consequences of genetic polymorphisms in regional brain function.
The feasibility of using PET to investigate the role of genes in the rodent would markedly extend its usefulness in elucidating the role of genes in brain function, aging, and adaptations to environmental and pharmacologic interventions. Although PET has been used to image the effects of genetic modifications in the rodent brain, to our knowledge, no such study has been reported in mice. Mice, through the use of “knock-out” (KO) and “knock-in” technologies have been particularly valuable in elucidating the role of genes and the proteins they encode in behavior and drug effects (14–16). This animal model has also been proven valuable in some instances in predicting the genotypic basis of neuropsychiatric disease (17–19).
Small-animal PET imaging and microPET technology have rapidly progressed since their introduction (20) and today offer a resolution of just under 2-mm full width at half maximum (21). This study examines the feasibility of using PET as a tool in imaging genetically engineered mice. Specifically, we evaluated the sensitivity of the microPET R4 tomograph (Concorde Microsystems, Knoxville, TN) to image the dopamine D2 receptor (DRD2) in both the D2 wild-type (WT) (D2+/+) mice and the KO (D2−/−) mice with 11C-raclopride, a classic DRD2 PET ligand (22,23). Parallel studies were performed with MRI to identify regional brain morphology. The PET data were qualitatively compared with conventional autoradiography.
The DRD2 KO mice have been a widely studied strain since first engineered (24,25). Among other characteristics, DRD2 KO mice (D2−/−) have a unique phenotype that includes reduced spontaneous locomotor activity (24), lack of a response to the rewarding effects of morphine (26), and a significantly different alcohol preference profile (27). In addition, it is well understood that the DRD2 plays a critical role in alcohol and drug abuse (28–31). Thus, these genetically engineered mice are extremely valuable as animal models of neuropsychiatric disorders, including alcohol and drug abuse.
MATERIALS AND METHODS
Materials
11C-Raclopride was synthesized in the Brookhaven National Laboratory Cyclotron as described (8,9). For the blocking study (experiment 2), raclopride was purchased from Sigma (St. Louis, MO).
Animals
Adult male congenic (N10) on C57Bl/6J mice [WT (D2+/+) and KO (D2−/−)] were obtained from Oregon Health and Science University and had a mean weight of 30 ± 4 g. This study consisted of 3 experiments, each with 2 groups. Experiment 1 (PET baseline unblocked) consisted of 5 WT and 5 KO mice that were injected with 11C-raclopride and then imaged with microPET. In parallel, these animals were imaged with MRI for anatomic coregistration. Experiment 2 (PET blocking) consisted of 2 WT and 2 KO mice that were coinjected with unlabeled raclopride (1 mg/kg) and 11C-raclopride and then similarly imaged with microPET. Experiment 3 (autoradiography) consisted of 4 WT and 4 KO mice that were euthanized, their brains were frozen and cut with a cryostat, and sections were processed for in vitro labeling with 3H-spiperone (0.6 nmol/L; 3,552 GBq [96 Ci/mmol]; Amersham, Piscataway, NJ).
Animals were individually housed in a room controlled for temperature and humidity as well as a 12-h light/12-h dark cycle. Food was always available ad libitum. All studies were conducted in accordance with the guidelines established by the National Institutes of Health and were approved by the Institutional Animal Care and Use Committee of Brookhaven National Laboratory.
Experiment 1: MicroPET Imaging
Mice were anesthetized intraperitoneally, with a mixture of ketamine (100 mg/kg) and xylazine (10 mg/kg) and placed in a stereotactic head holder in a prone position on the bed of the scanner. Animals were then injected via the tail vein with 11C-raclopride (5,550 ± 1,832 kBq [150 ± 49.5 μCi] for KO; 5,714 ± 1,621 kBq [154.4 ± 43.8 μCi] for WT; specific activity, 14.8–55.5 GBq/μmol [0.4–1.5 Ci/μmol] at injection). Injected volumes were <200 μL. Mice were imaged in the microPET R4 scanner (Fig. 1). Total acquisition time was 60 min (24 frames: 6 frames, 10 s; 3 frames, 20 s; 8 frames, 60 s; 4 frames, 300 s; 3 frames, 600 s), and data were acquired in fully 3-dimensional mode with maximum axial acceptance angle (±28°). Images were reconstructed using Fourier rebinning (32) followed by 2-dimensional filtered backprojection with a ramp filter cutoff at Nyquist frequency. Using the mouse stereotactic atlas (33) and the harderian glands as a reference point, the coronal planes of the striatum (ST) and the cerebellum (CB) were identified in the same manner. Specifically, for each animal the ST and CB were identified as 3 and 7 slices, respectively, caudal to the harderian glands (slice thickness, 1.2 mm). It has been shown previously that the harderian glands (located just rostral of the brain), because of their uptake of radioactivity, are routinely used as markers in rodent PET studies (34–36).
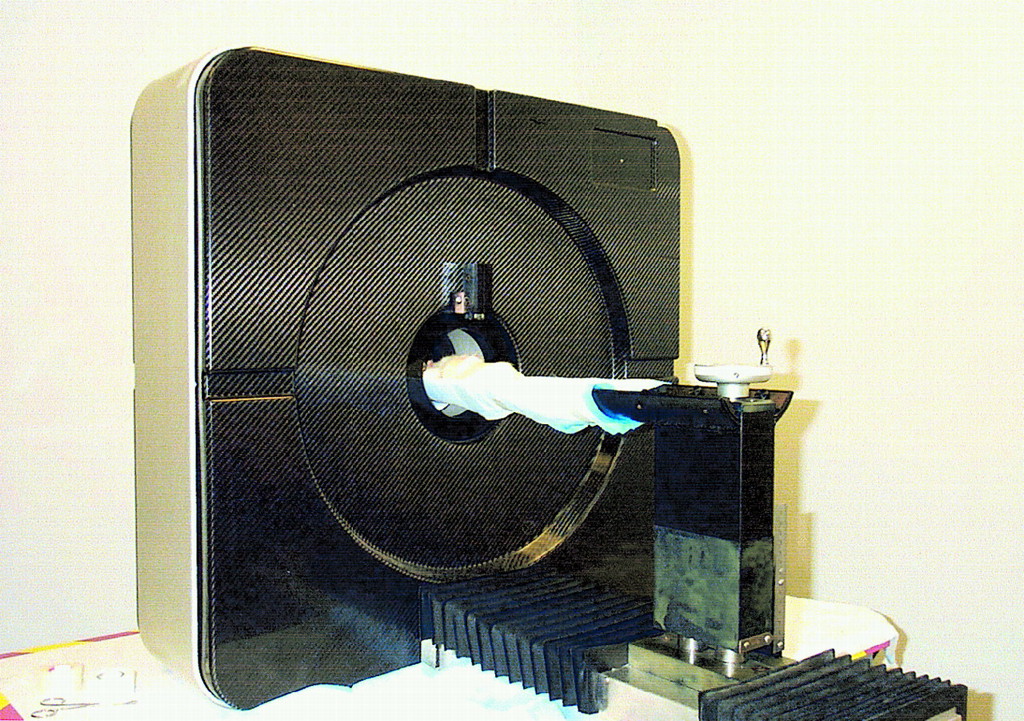
Photograph of Concorde microPET R4 system.
MRI
After the PET studies the animals were scanned with an MR camera for anatomic comparison. All images were obtained using a whole-body, 4-T Varian/Siemens instrument (Hamburg, Germany) equipped with actively shielded gradient coils (maximum gradient strength, 40 mT/m; slew rate, 124 T/m/s). The animals were reproducibly positioned inside a 5-cm-diameter birdcage radiofrequency coil. Anatomic images were obtained with a 3-dimensional spin-echo pulse sequence with a slab selection (slab thickness, 2 cm) along the coronal orientation. Other acquisition parameters were excitation time, 40 ms; relaxation time, 100 ms; number of excitations, 2; field of view, 3 × 3 × 3 cm3; data size, 256 × 128 × 64 (read, phase, slice). The total acquisition time was about 27 min. The raw data were zero filled (to 128) at the third dimension and Fourier transferred slightly weighted with a gaussian function in all 3 dimensions. The final imaging resolution was 234 μm, isotropically.
Experiment 2: Blocking Study
This procedure was identical to the previous experiment except that each animal received a coinjection of unlabeled raclopride (1 mg/kg) and 11C-raclopride (3,330 kBq [90 μCi]; specific activity, 14.8–37 GBq/μmol [0.4–1 Ci/μmol]).
MicroPET Analysis
Regions of interest (ROIs) for the ST and CB were selected using a mouse stereotactic atlas (33), and the ST/CB ratios were calculated for each animal. Briefly, the left and right ST ROIs were averaged and divided by the CB ROI over the 60-min duration of each scan. Time-activity data was then used to calculate distribution volume ratios (DVRs) using a Logan plot-graphic analysis technique (37). This graphic technique is widely used and provides a linear function of receptor availability of PET data that does not require blood sampling (38). Qualitative analysis was performed on the microPET images and they were compared with conventional autoradiography images.
Because the spatial resolution of the scanner is similar to the sizes and separations of the structures of interest in the mouse brain, partial-volume and spillover effects were a concern. Because of the approximately constant resolution and sizes of the structures and ROIs among studies, partial-volume effects are expected to be similar for a given structure and, to some extent, cancel out in the ST/CB ratios, especially when comparing the ratios between different strains. In addition, accurate partial-volume correction is quite problematic and beyond the scope of this work. Thus, no correction has been attempted with these data.
Spillover was a particular concern because the proximity to the ST of the harderian glands (∼2–3 mm), which have a high uptake similar to that of the ST. An attempt was made to estimate the effect of this spillover by drawing additional ROIs on the harderian glands and estimating the contribution to the ST ROI on the basis of the known separation and spatial resolution.
Experiment 3: Autoradiography
In the autoradiography study, we used 3H-spiperone (0.6 nmol/L; 3,552 GBq/mmol [96 Ci/mmol]; Amersham); a D2-like receptor antagonist (nonselective for D2, D3, and D4, but with highest affinity to D2 receptor) as a ligand and 40 nmol/L ketanserin (antagonist) was added to block 5-hydroxytryptamine-2 receptors. A parallel set of slide sections was used to assess the nonspecific binding with the same concentrations of tritiated ligand and ketanserin plus 5 μmol/L (+)-butaclamol, a nonselective dopamine receptor ligand.
RESULTS
Experiment 1: MicroPET
Qualitative assessment of the microPET images was performed, and a representative example of each strain is presented in Figure 2. Specifically, Figure 2 illustrates coronal microPET images of the ST after intravenous injection of 11C-raclopride. A clear and significant difference in 11C-raclopride labeling of the ST was observed between the 2 strains, with WT (D2+/+) mice showing intense ST labeling as opposed to KO (D2−/−) mice.
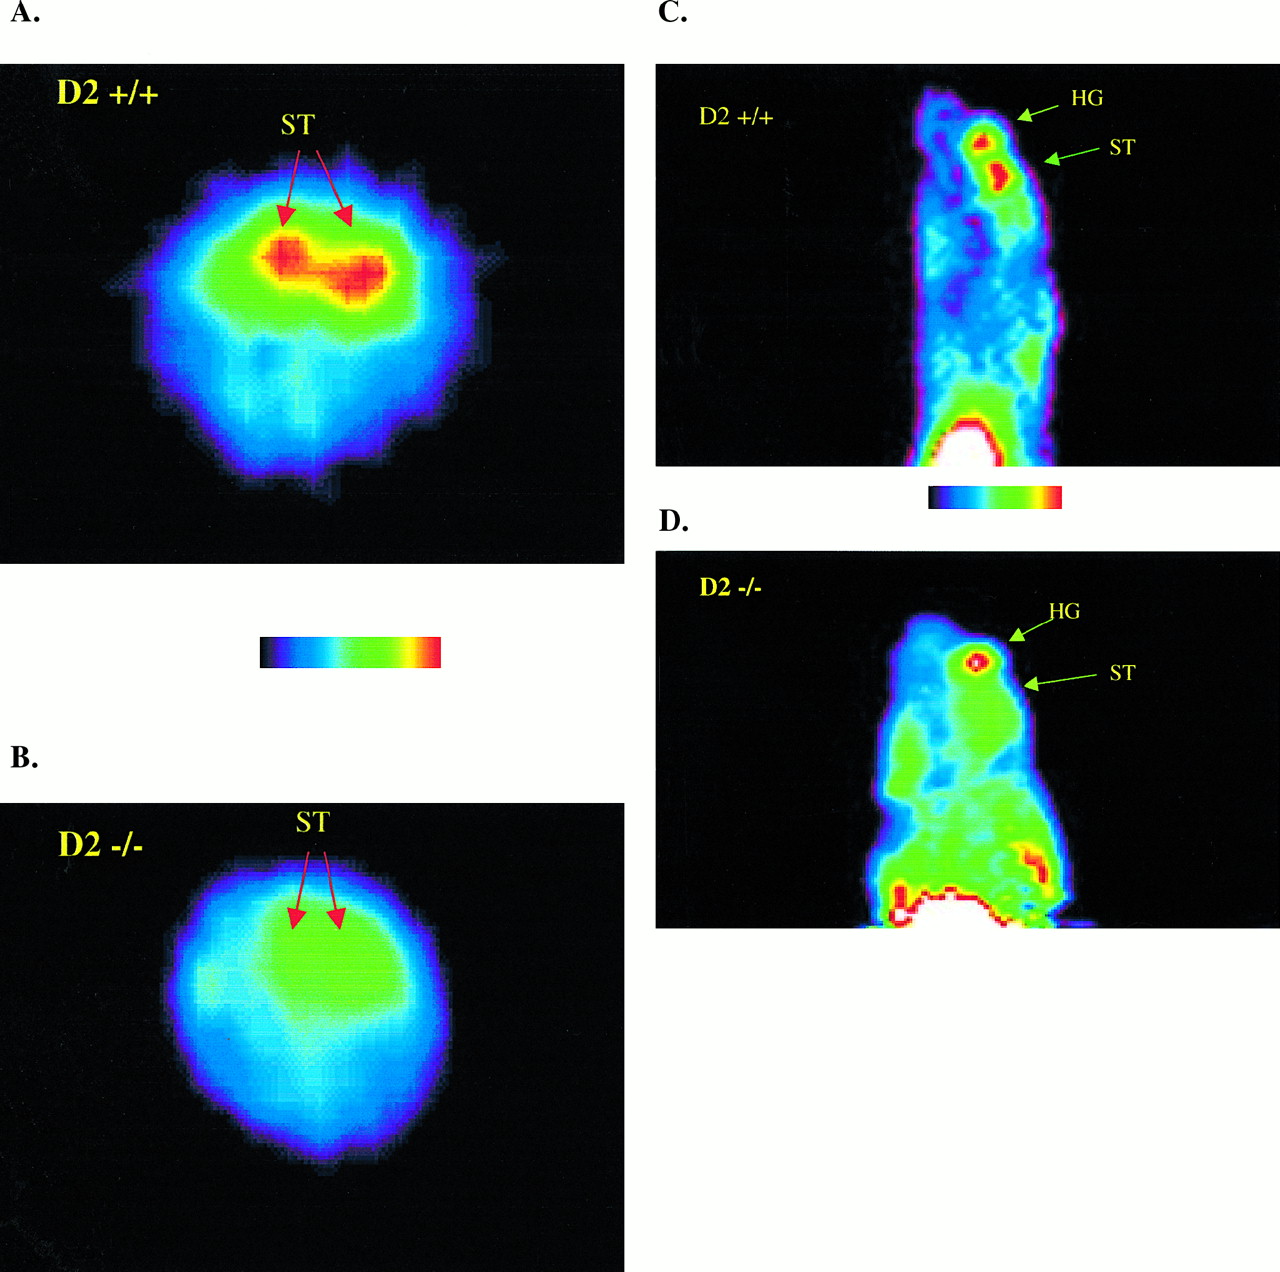
Transverse (A and B) and sagittal (C and D) microPET images (summed across frames 11–24) of ST injected with 11C-raclopride. (A and C) WT (D2+/+) mouse. (B and D) KO (D2−/−) mouse. HG = harderian gland.
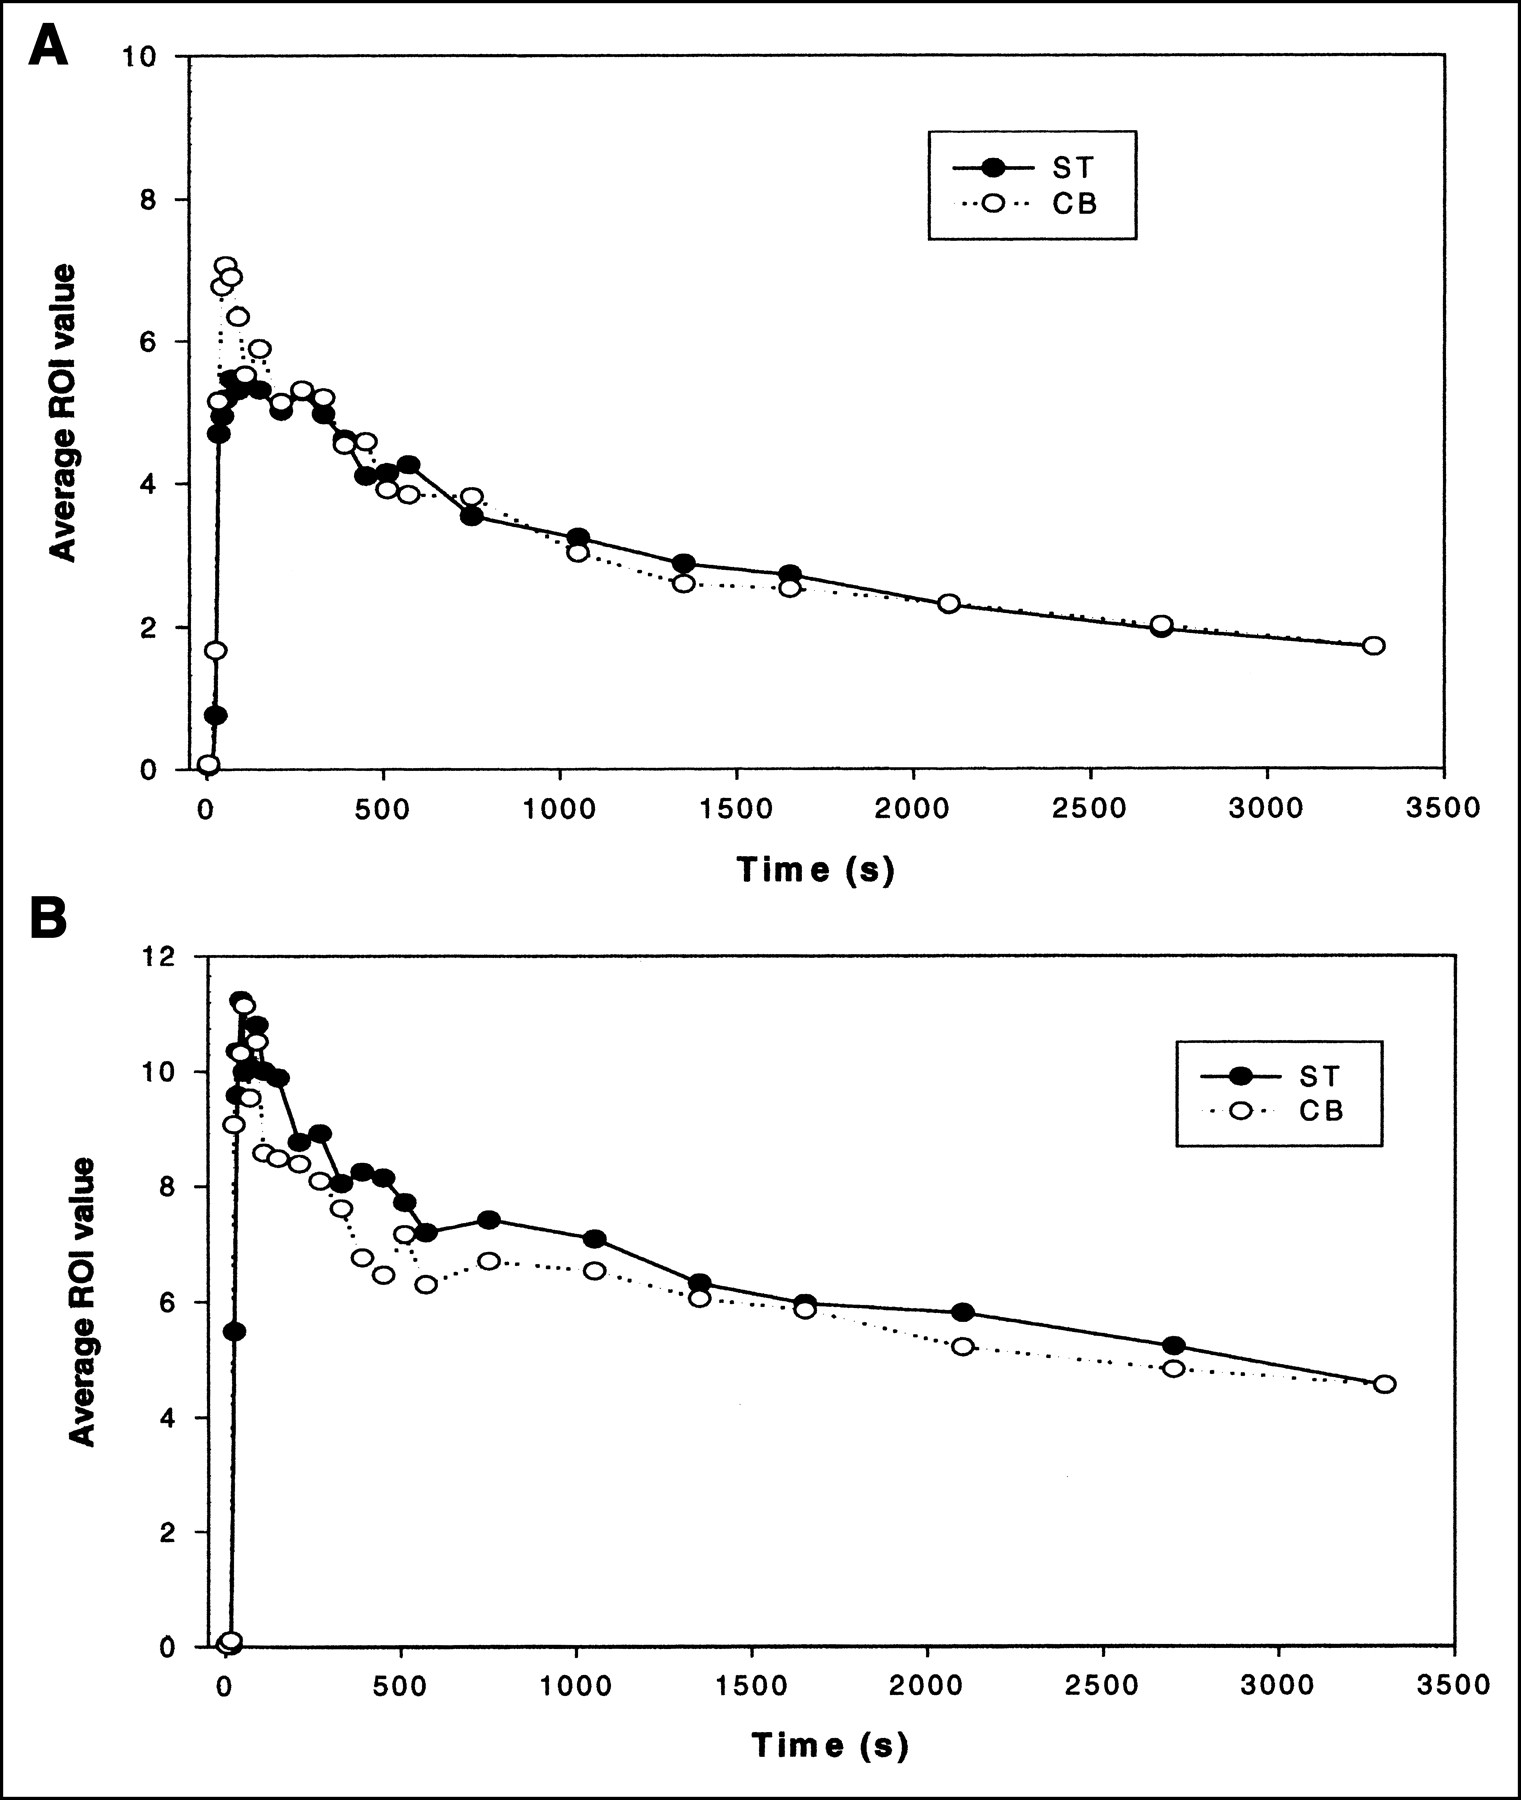
Quantitative analysis of the microPET images consisted of: the ST/CB binding ratios over time for all animals, the DVR plot for each strain, and representative examples of the time-activity curve for each strain were examined. Pairwise t test comparisons between the 2 strains revealed a statistically significant difference in the ST/CB ratios (P < 0.001). Specifically, the mean ratio for each strain was 1.33 ± 0.13 and 1.05 ± 0.03 for the D2 WT and D2 KO, respectively (Fig. 3A). In addition, using the time−activity curve data, a representative plot is illustrated for each strain in Figure 3B, in which it is clearly visible that the WT ST has a slower clearance compared with the CB, whereas in the KO plot, the time-activity curves for both structures were indistinguishable. Figure 3C illustrates the DVR for each strain. Specifically, when applying this technique on the microPET images, a DVR was calculated (WT = 1.26; KO = 1.02).

(A) ST/CB binding ratio over time (mean ± SEM). (B) Representative examples of time-activity curves of ST and CB normalized to injected dose for KO (D2−/−) mice (top) and WT (D2+/+) mice (bottom). (C) DVR plot for WT (□) and KO (▪) mouse. CREFdt = reference tissue radioactivity at time t; ROI(T) = ROI radioactivity at time t; t or T = time that is midpoint of scan time.
A conservative estimate of the effect of spillover from the harderian glands to the ST data was calculated to be <10% on the basis of the harderian ROI values and a 2-mm separation. In addition, the difference in harderian activity (relative to CB) between strains was found to be statistically insignificant (P > 0.05). Both results imply that spillover has not significantly biased the observed difference between the ST/CB values of the WT and KO strains.
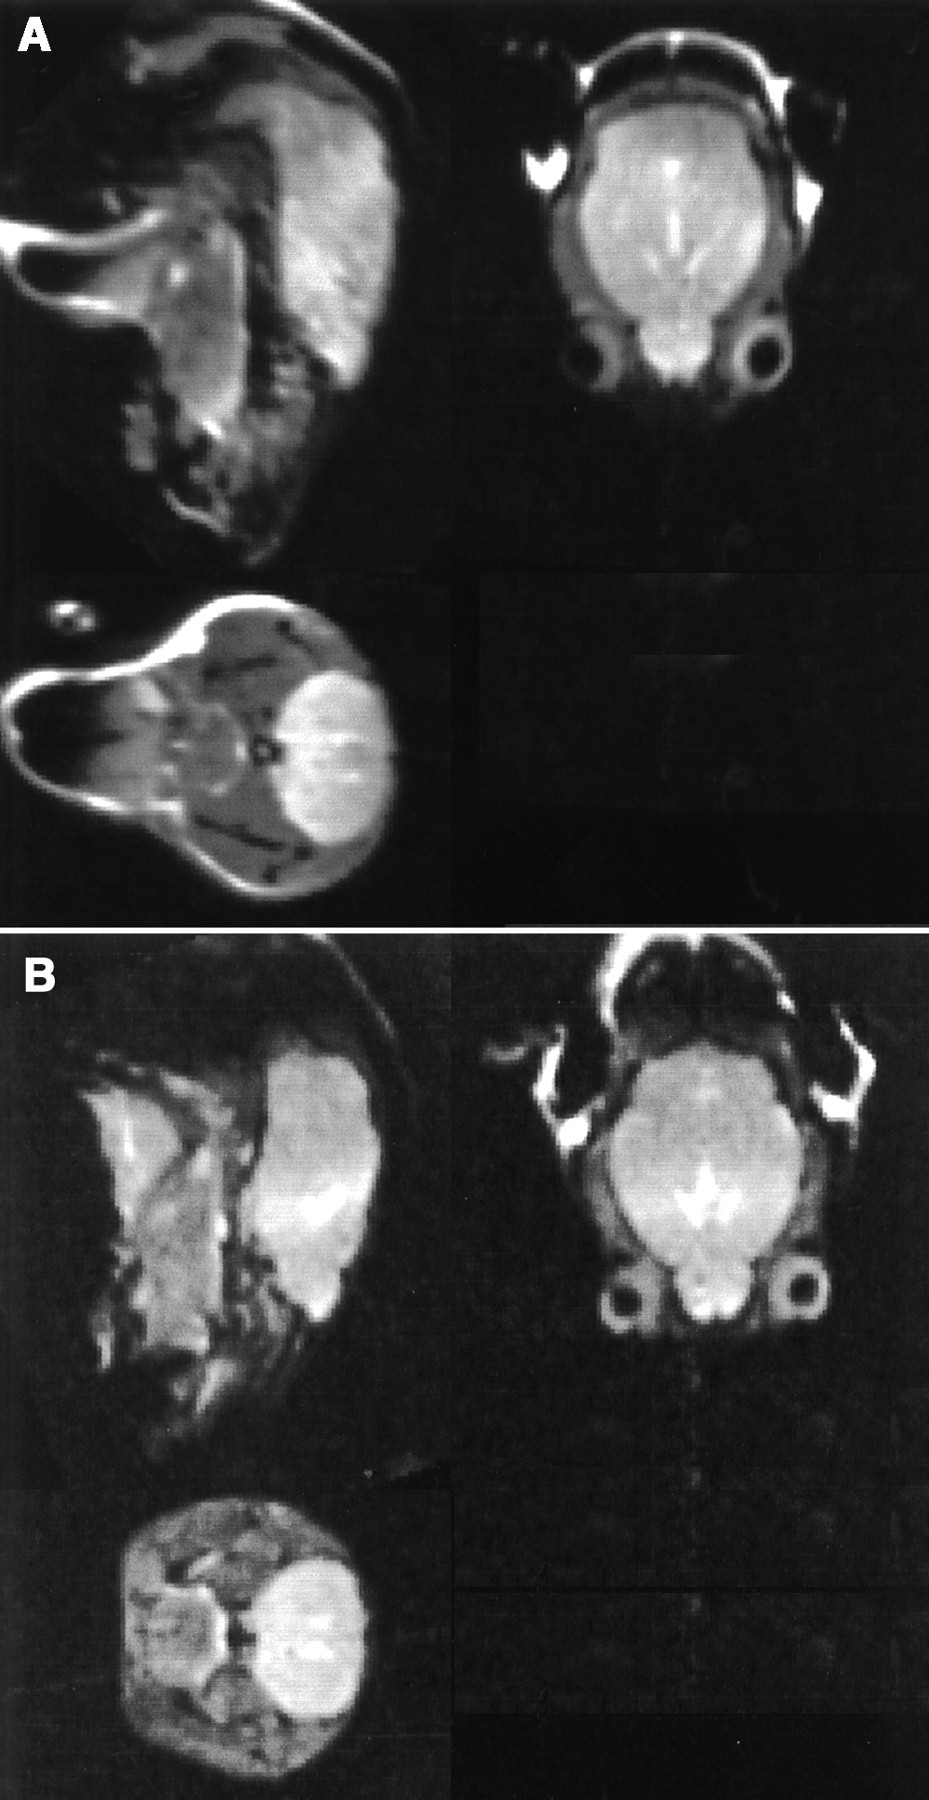
High-field brain MRI scans obtained on the all mice are shown in Figure 4. Analyses and review of the sagittal, horizontal, and coronal planes of each animal identified all major cranial and cerebral structures. Specifically, the olfactory bulbs, the cortex, the brain stem, and the ventricular system were observed in the sagittal and horizontal planes of each strain, whereas, in the coronal plane, the lateral ventricles and the ST were observed (Fig. 4). No significant anatomic differences were noted in the brains of the KO and the WT animals scanned.

MR images of WT (A) and KO (B) mouse (sagittal plane, top left; horizontal plane, top right; coronal plane, bottom left).
Experiment 2: Blocking
The blocking experiment revealed the nonspecific binding of the radiotracer. Qualitative analysis of the microPET images demonstrated that the ST of the WT (D2+/+) mice did not show significant binding as reported previously (Fig. 2) compared with the KO (D2−/−) mice. In fact, blocking microPET images of the WT and KO mice appeared very similar. Next, a time-activity curve analysis of both strains revealed similarly no differences (Fig. 5).

Representative examples of time-activity curves of ST and CB normalized to injected dose for blocking study. (A) KO (D2−/−) mouse. (B) WT (D2+/+) mouse.
Experiment 3: Autoradiography
D2 autoradiography assessment (Fig. 6) demonstrated in WT (D2+/+) mice that the ST (caudate putamen), the nucleus accumbens, and the olfactory tubercle (OT) all had high 3H-spiperone binding, with the highest density in the ST. Whereas in the KO (D2−/−) mice, almost 100% of the D2 binding was eliminated in most of the ST compared with the WT mice, except for a small part of the ventral and lateral ST, the nucleus accumbens, and the OT, where D3 receptor may remain. There were no significant differences in nonspecific binding between strains. In addition, there was increased D2-like receptor binding signal in the cerebral cortex of the KO mice, which is an area with a relatively high concentration for D4 receptors.
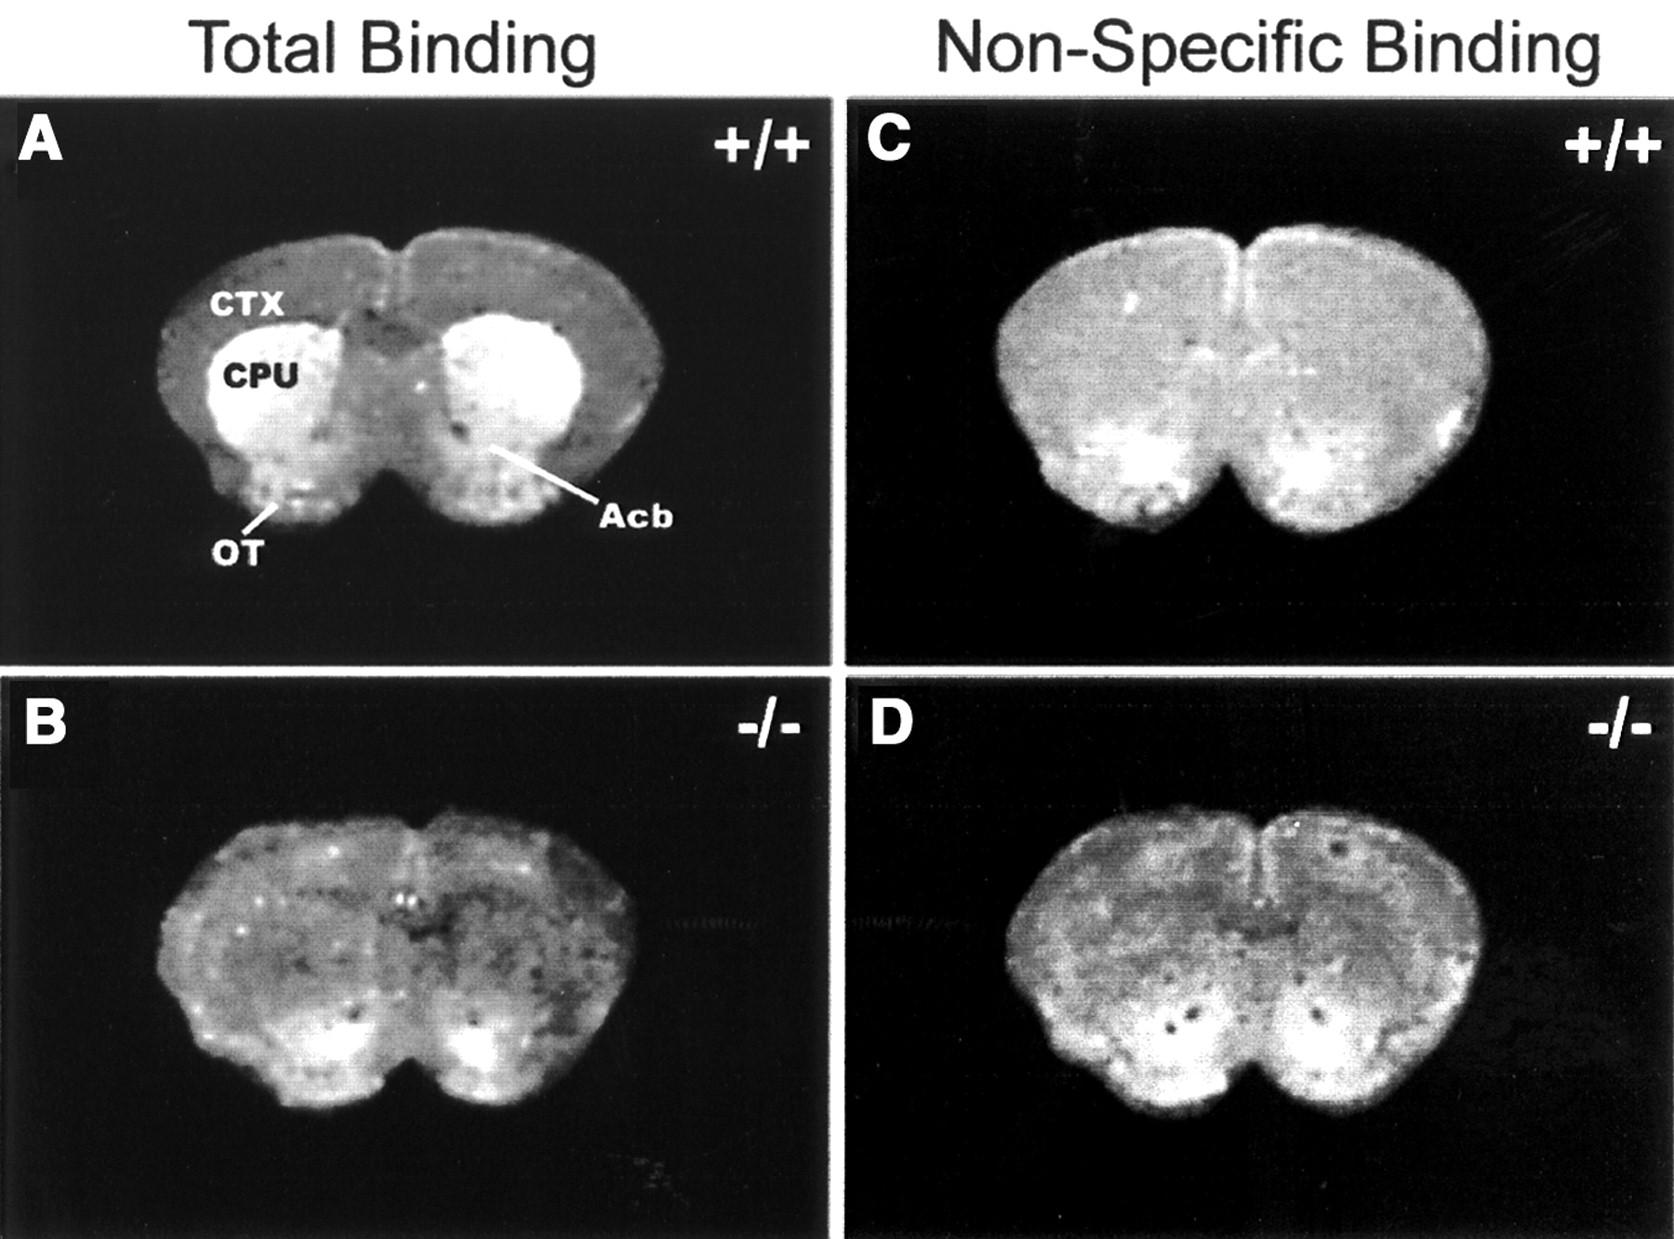
Autoradiograms of 3H-spiperone binding autoradiography in WT (A and C, +/+) and DRD2 KO (B and D, −/−) mice. (A and B) Total binding images in presence of 0.6 nmol/L 3H-spiperone and 40 nmol/L ketanserin. (C and D) Nonspecific binding images in presence of same concentration of tritiated ligand and ketanserin plus 5 μmol/L (+)-butaclamol. DRD2 binding signal was wiped out in most of caudate putamen (CPU) region in DRD2 KO mice (B) in comparison with WT counterpart (A). CTX = cerebral cortex; Acb = nucleus accumbens.
DISCUSSION
Over the last few years remarkable advances in behavioral genetics and murine genetic engineering have produced phenotypes with the potential of linking specific genes and their function. Traditionally, the study of these transgenic manipulations on function has been through necroscopic investigation. With the advent of sophisticated imaging devices such as PET, SPECT, and MRI, the notion of noninvasively studying the physiology and neurochemistry of the brain is a reality. This study demonstrated the feasibility of using microPET to examine genetically manipulated mice.
Analysis of the 11C-raclopride brain microPET images revealed clear differences between the KO (D2−/−) mice and the WT (D2+/+) mice. Among the different brain regions, the ST in particular is both significant in size and DRD2 density and was easily discernible with microPET in the WT mice but was indistinguishable in the KO mice. On the other hand, the CB is also a relatively large structure of the brain but does not have any D2 receptors. When computing the ST/CB ratio over time, it was found that the KO mice displayed a ratio of about 1—in other words, the ST DRD2 levels were essentially the same as background. In contrast, the WT mice showed an ∼28% greater ST/CB ratio and this was highly statistically significant. This significant D2 binding in the ST of the WT versus KO mice was consistent with the in vitro studies on these strains (experiment 3).
Next, the receptor-binding kinetics was plotted (time-activity curve) for the averaged ROI value of the ST and CB in each strain. The data illustrated that the time-activity curve for the KO mice was unique in that the ST and CB curves were almost superimposed onto each other. In contrast, analysis of the time-activity curve of the WT mice demonstrated a consistently and significantly higher curve for the ST versus the CB.
The DVR graphic technique for describing receptor availability in each strain showed a highly significant difference between the strains (∼23% greater in the WT vs. KO). Comparing the DVRs of the 2 strains with the ST/CB ratio, data revealed a high degree of concurrence, which was consistent with the literature (38).
In contrast, the 11C-raclopride images obtained during the blocking experiment did not reveal any noticeable differences in radiotracer distribution between the WO and KO mice. There were also no differences in the time-activity curve data. In vitro autoradiography assessment of the 2 strains of mice demonstrated the highest density of D2 receptor binding in the ST in the WT (D2+/+) mice. This was in agreement with the in vivo microPET images. However, in the KO (D2−/−) mice a low level of 3H-spiperone binding was observed in the ventrolateral ST, which is an area with a relatively high density of D3 receptors.
Although review and analyses of the microPET data revealed significant differences in the neurochemical profile between the WT and KO mice (in agreement with in vitro studies), there were no anatomic differences between these animals as evident from the MR images.
There are, of course, limitations to the use of PET in the study of the mouse brain. The limited spatial resolution results in partial-volume effects that significantly affect absolute quantitation of small structures and require data to be carefully interpreted. In addition, for tracer studies the specific activity of the doses must be maximized to provide sufficient image statistics while maintaining tracer levels of binding (39). For example, in this work the average raclopride mass associated with the 11C-raclopride was 20 ± 17 nmol/kg (KO) and 22 ± 22 nmol/kg (WT), ∼10 times the in vitro dissociation constant for raclopride. Using the analysis for a 30-g mouse (39), the average DRD2 occupancy in each group was calculated to be 47% (KO) and 46% (WT). Although DRD2 occupancy is only relevant to the WT group, it is useful to note that differences in raclopride mass cannot explain the observed quantitative (ST/CB) and qualitative (image contrast) differences between the KO and WT groups. However, the binding of ∼50% of the DRD2 in the mouse brain by 11C-raclopride is a significant limitation of applying PET to imaging DRD2 in the mouse brain. Thus, systematic studies exploring dopaminergic function in the mouse brain may require, higher 11C-raclopride specific activity. For example, to reach <10% DRD2 occupancy, only 2,775 kBq (75 μCi) 11C-raclopride with a specific activity of 55.5 kBq/μmol (1.5 Ci/μmol) could be injected. Although further studies are required to determine the minimum11C-raclopride dose at which useful microPET ROI data can be generated from the mouse brain, the ability to perform studies in this work using <3,700 kBq (<100 μCi) 11C-raclopride is encouraging.
CONCLUSION
On the whole, our data do support the use of microPET as an effective tool for studying noninvasively KO mice. These same tools can be extended to investigate other genetically engineered murine models of disease.
Future studies will focus on incorporating specialized microMRI (7 T) with our microPET studies. MicroMRI would provide us with higher resolution images of the brain that could then be coregistered by computer with the same animal’s microPET images. The amalgamation of these 2 sophisticated imaging systems in the future will further increase the feasibility of using noninvasive imaging technology to study in vivo genetically manipulated mice dynamically and to correlate these data with each animal’s behavior.
Acknowledgments
The authors thank Dr. Gene-Jack Wang, Dr. Frank Telang, Naomi Pappas, Don Warner, Noelwa Netusil, Pauline Carter, and Payton King for PET operations and Dr. David Schlyer, Michael Schueller, Richard Ferrier, Colleen Shea, Yonweu Xu, and Victor Garza for cyclotron operations and radiotracer preparation. The authors also thank Dr. Oline Ronnekleiv for assistance with the autoradiography and Katherine Suchland for her support and maintenance of the transgenic mouse colony. This work was supported by the National Institute of Alcohol Abuse and Alcoholism (grant AA/ODO9481-04) and the National Institute of Drug Abuse (grant DA06891-06). This research was performed under contract DE-AC02-98CH10886 with the U.S. Department of Energy.
Footnotes
Received Mar. 8, 2002; revision accepted Jul. 25, 2002.
For correspondence or reprints contact: Panayotis K. Thanos, PhD, Medical Department, Brookhaven National Laboratory, Upton, NY 11973-5000.
E-mail: thanos{at}bnl.gov
REFERENCES
In this issue


Jump to section
Related Articles
Cited By...
- Noninvasive Nuclear Imaging Enables the In Vivo Quantification of Striatal Dopamine Receptor Expression and Raclopride Affinity in Mice
- Restricted Cortical and Amygdaloid Removal of Vesicular Glutamate Transporter 2 in Preadolescent Mice Impacts Dopaminergic Activity and Neuronal Circuitry of Higher Brain Function
- Impaired dopamine release and synaptic plasticity in the striatum of PINK1-deficient mice
- Dynamic Imaging of Striatal D2 Receptors in Mice Using Quad-HIDAC PET
- Reproducibility of 11C-Raclopride Binding in the Rat Brain Measured with the MicroPET R4: Effects of Scatter Correction and Tracer Specific Activity