


Article Figures & Data
Figures
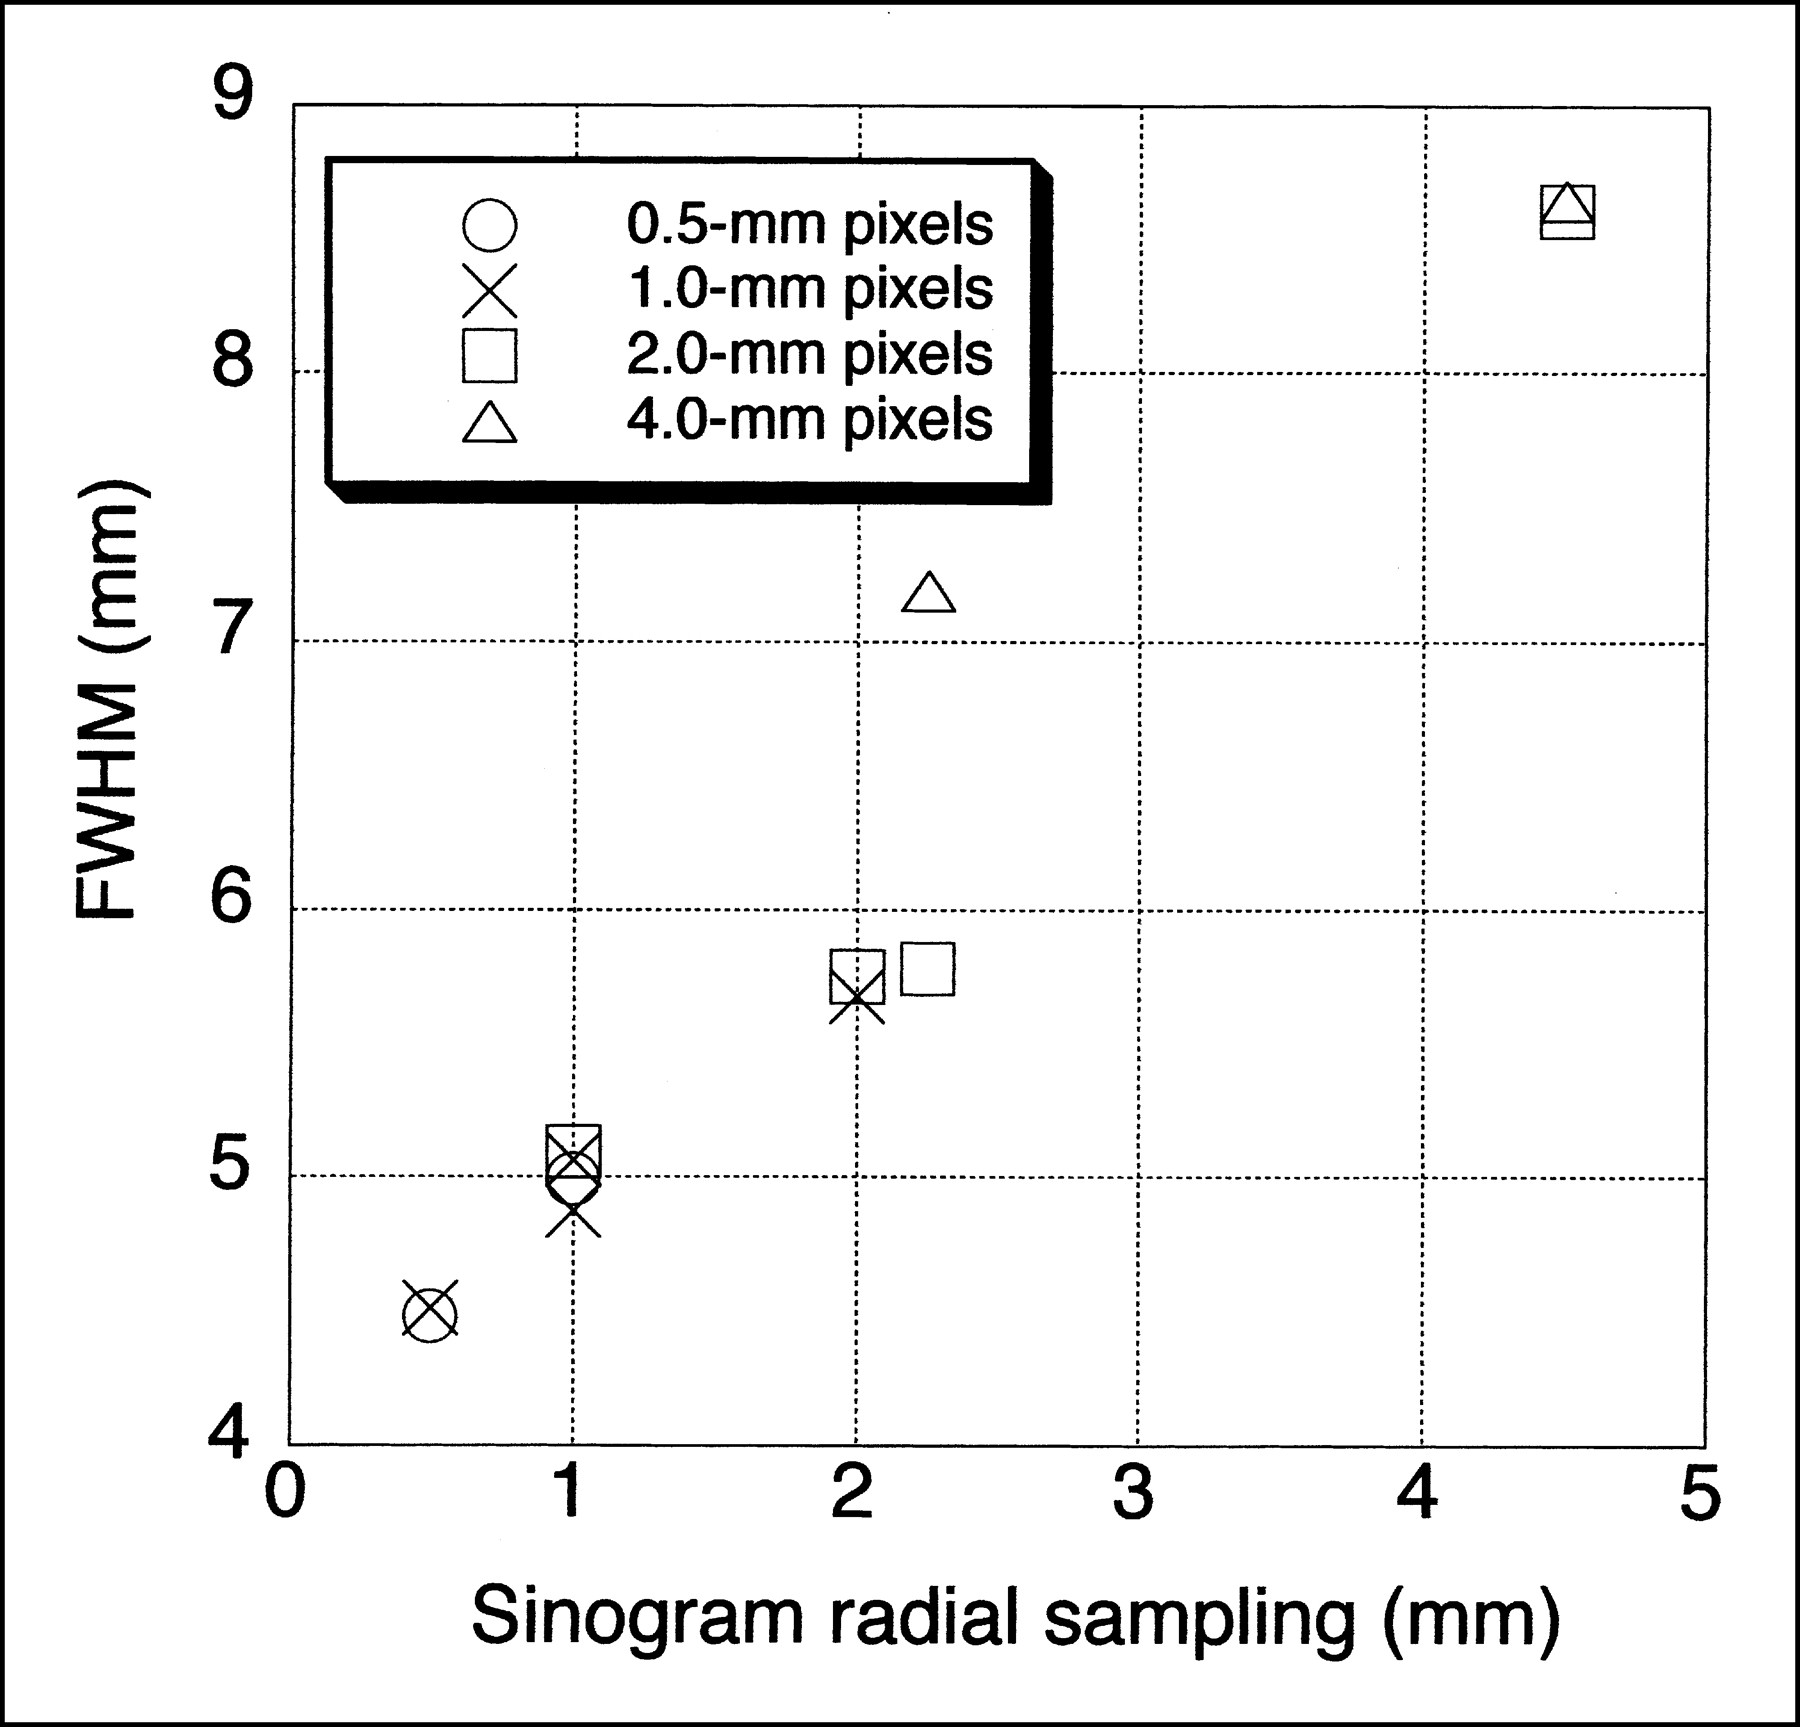
- FIGURE 1.
Effect of acquisition and reconstruction sampling on transverse spatial resolution. FWHM values for central point source are shown for ADAC UGM C-PET scanner as function of radial sampling in sinogram and image pixel size. Following NU 2-2001 protocol, best spatial resolution would be measured; clinical parameters typically have 2- to 4-mm sinogram radial sampling and pixel size, which result in significantly degraded resolution on this system.
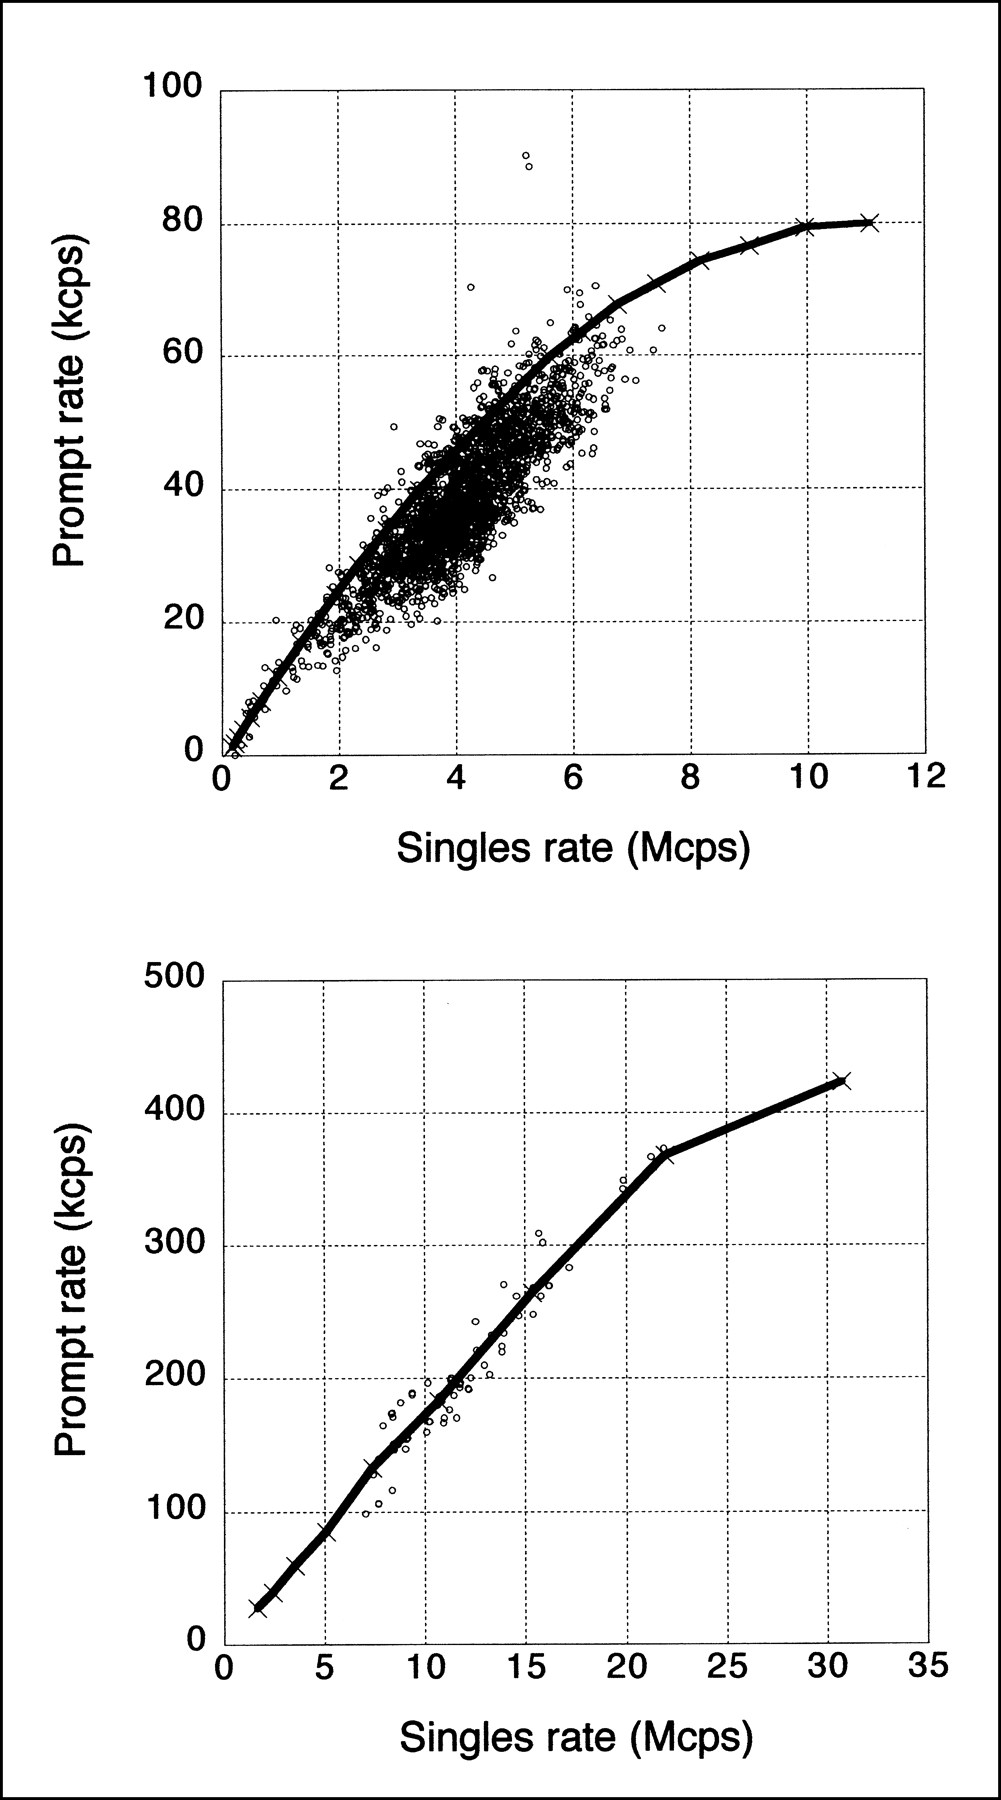
- FIGURE 2.
Comparison of phantom and patient counting rates. (Top) Prompt rate vs. singles rate for 70-cm-long line source in 20-cm-diameter polyethylene cylinder (solid line) and for whole-body patient studies (○) taken on ADAC UGM C-PET scanner. (Bottom) Prompt rate vs. singles rate for 20-cm-diameter × 19-cm-long water-filled cylinder (solid line) and for brain patient studies (○) taken on University of Pennsylvania G-PET scanner. Singles rate is proportional to (unknown) activity in patients.
- FIGURE 3.
Representative image from image quality measurement for 6-min emission scan with hot sphere:background activity ratio of 8:1. Data were taken on ADAC UGM C-PET scanner and reconstructed with 3D RAMLA. Shown on right is placement of ROIs for quantitative analysis. Not shown is ROI for assessment of accuracy of corrections for attenuation and scatter, drawn on central lung-like cylindric insert.
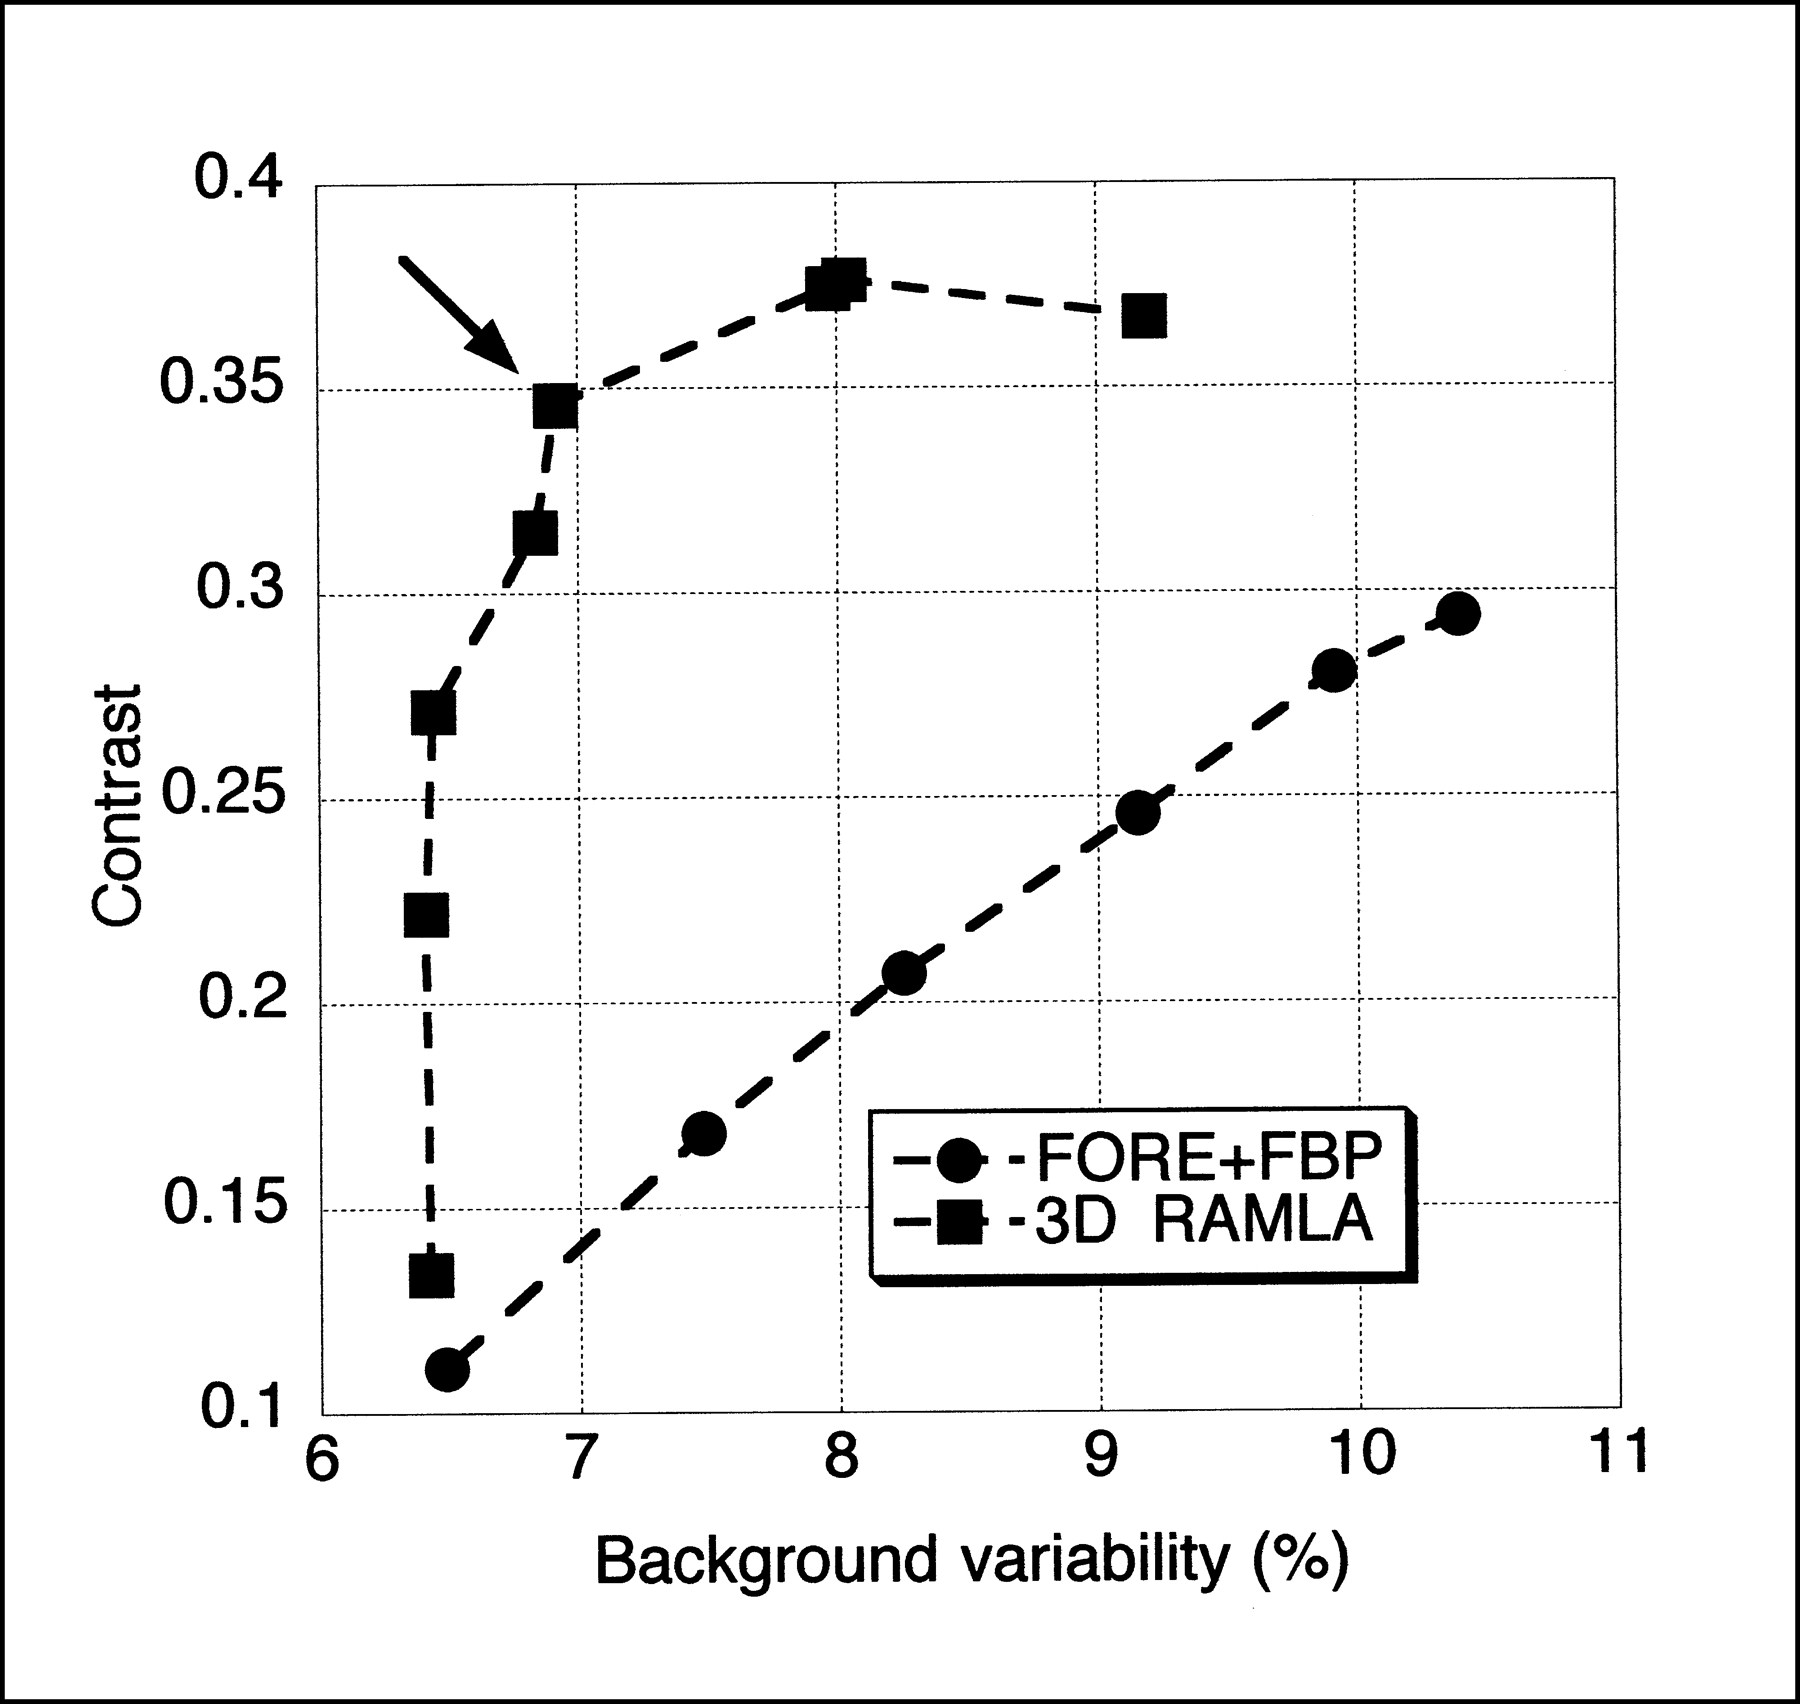
- FIGURE 4.
Effect of reconstruction algorithm on image quality results taken on ADAC UGM C-PET scanner. Results for 1.7-cm hot sphere are shown for FBP for Hanning filters with cutoff frequencies ranging between 2 and 0.33 times Nyquist frequency as well as for ramp filter with cutoff at Nyquist frequency and 3D RAMLA for range of reconstruction parameters (number of iterations and relaxation parameter). Arrow shows results for parameters used in clinical studies. FORE = Fourier rebinning.

Tables
Direction Profile width = 1 mm Profile width = 2 × FWHM FWHM (mm) FWTM (mm) FWHM (mm) FWTM (mm) Y 4.4 ± 0.1 9.1 ± 0.1 4.9 ± 0.3 12.2 ± 0.5 X 4.6 ± 0.2 11.8 ± 2.0 5.4 ± 0.1 11.5 ± 0.7 Average (X, Y) 4.5 ± 0.2 10.5 ± 2.0 5.2 ± 0.4 11.9 ± 0.7 Data were taken on ADAC UGM C-PET scanner. Values are for x = y = 0 cm, averaged over Z = 0 and Z = ¼ axial FOV. Overall average is over X and Y values for 2 axial positions (4 numbers).
Axial position FWHM (mm) Meas. 1 Meas. 2 A 8.3 6.8 B 8.5 7.8 C 6.1 6.5 D 6.0 6.2 Average (A, B) 8.4 7.3 Average (C, D) 6.05 6.35 Average (A, B, C, D) 7.2 ± 1.4 6.8 ± 0.7 Results from 2 separate measurements (Meas. 1 and Meas. 2), taken on GE Advance scanner in 3D acquisition mode, are shown. Axial position A was at center of axial FOV, whereas position B was ¼ of axial FOV from center. Positions C and D were ½ slice separation from positions A and B, respectively.
Acquisition mode Standard Peak NEC rate (kcps) Activity concentration at peak NEC (kBq/mL) Peak true rate (kcps) Activity concentration at peak trues (kBq/mL) 2D* NU 2-1994 261 152 557 267 2D† NU 2-2001 125 58 189 58 3D NU 2-1994 146 24 449 53 3D NU 2-2001 19.2 7.15 109 19.7 ↵* Data from (16).
↵† Results were not at peak NEC or peak true rates because there was insufficient activity in source to measure these peak rates.
Data were acquired on GE Advance scanner. As point of reference, typical average activity concentration seen in clinical FDG study is 3–4 kBq/mL, for 370-MBq injection in 70-kg patient after 1-h uptake period.
Diameter (cm) Scan 1 Scan 2 Average % Diff. 1.0 0.047 0.076 0.061 48 1.3 0.16 0.19 0.17 18 1.7 0.24 0.22 0.23 8.7 2.2 0.42 0.44 0.43 4.6 2.8 0.48 0.45 0.46 6.5 3.7 0.48 0.47 0.48 2.1 Data were acquired on ADAC UGM C-PET scanner. Percentage difference (% Diff.) was calculated as absolute difference between 2 scans, divided by average value.
Diameter (cm) Scan 1 Scan 2 Average % Diff. 1.0 8.93 7.61 8.27 16.0 1.3 8.78 6.82 7.80 25.1 1.7 7.94 6.75 7.35 16.2 2.2 7.96 6.87 7.42 14.7 2.8 7.50 6.42 6.96 15.5 3.7 6.91 5.97 6.44 14.6 Data were acquired on ADAC UGM C-PET scanner. Percentage difference (% Diff.) was calculated as absolute difference between 2 scans, divided by average value.
In this issue


Jump to section
Related Articles
Cited By...
- Impact of 68Ga-PSMA PET/CT on the Radiotherapeutic Approach to Prostate Cancer in Comparison to CT: A Retrospective Analysis
- Simulation of Tracer Dose Reduction in 18F-FDG PET/MRI: Effects on Oncologic Reading, Image Quality, and Artifacts
- Estrogen Receptor Binding (18F-FES PET) and Glycolytic Activity (18F-FDG PET) Predict Progression-Free Survival on Endocrine Therapy in Patients with ER+ Breast Cancer
- A New PET Scanner with Semiconductor Detectors Enables Better Identification of Intratumoral Inhomogeneity
- Benefit of Time-of-Flight in PET: Experimental and Clinical Results
- Impact of Acquisition Geometry, Image Processing, and Patient Size on Lesion Detection in Whole-Body 18F-FDG PET
- Imaging of Weak-Source Distributions in LSO-Based Small-Animal PET Scanners
- Performance Measurement of the microPET Focus 120 Scanner
- Optimizing Injected Dose in Clinical PET by Accurately Modeling the Counting-Rate Response Functions Specific to Individual Patient Scans
- Imaging Characteristics of a 3-Dimensional GSO Whole-Body PET Camera
- PET Performance Measurements for an LSO-Based Combined PET/CT Scanner Using the National Electrical Manufacturers Association NU 2-2001 Standard
- NEMA NU 2 Performance Tests for Scanners with Intrinsic Radioactivity
- Performance of a Brain PET Camera Based on Anger-Logic Gadolinium Oxyorthosilicate Detectors