


Abstract
Our objective was to investigate the properties of [1-11C]acetate as a quantitative perfusion tracer for myocardial PET studies. Methods: We determined the flow dependence of the effective acetate extraction by a comparison with [13N]ammonia in 24 patients at rest (n = 8) and under pharmacologic vasodilation (n = 16). Furthermore, we compared the statistical quality of the perfusion values derived with both tracers. Quantification was based on an irreversible 2-compartment model for [13N]ammonia and a reversible 1-compartment model for [1-11C]acetate. Area-conserving polar maps were used to determine the correlation between the unidirectional uptake parameters of both tracers on a pixel-by-pixel basis for the whole left ventricular myocardium. Results: A fit of a generalized Renkin–Crone formula to the data yielded the unidirectional acetate extraction fraction E(f) = 1 − 0.64e−1.20/f. An extraction correction based on this formula led to good quantitative agreement of perfusion values derived with [13N]ammonia and [1-11C]acetate over the whole observed flow range (average difference of flow values, 3%; correlation coefficient, 0.96). This agreement proved the applicability of acetate as a quantitative perfusion tracer even under stress conditions. An analysis of the statistical properties of the parameter estimates showed, moreover, that statistical errors were reduced by a factor of nearly 2 in comparison with ammonia. Conclusion: [1-11C]acetate allows accurate quantification of myocardial perfusion with PET at rest as well as under stress conditions. The use of acetate leads to distinctly improved statistical accuracy for the perfusion estimates in comparison with ammonia. This accuracy facilitates the generation of reliable parametric polar maps, which are especially useful for clinical application of myocardial perfusion quantification.
Some years ago, [1-11C]acetate was established for the evaluation of myocardial oxygen metabolism with PET (1–6). Subsequently, usefulness in clinical diagnostics has been shown (7–18). The potential for qualitative assessment of myocardial blood flow, which is a consequence of the high first-pass extraction of acetate, has also been noted (7,8,19).
Two groups have investigated multicompartmental models for describing the observed tracer kinetics (20,21). Computer simulations showed, especially, that perfusion quantification with a simple 1-compartment model is possible if an extraction correction is performed (21).
One group has directly compared perfusion values determined with [13N]ammonia and unidirectional acetate uptake under resting conditions in humans (22) and concluded that acetate is a suitable tracer for perfusion measurements. Recently, Porenta et al. (23) rescaled the initial tracer uptake rate to estimate resting perfusion. A 1-compartment model combined with an extraction correction based on the extraction measurements of Armbrecht et al. (2) for canine myocardium has also been used to estimate quantitative perfusion with acetate (18). Despite the numerous studies that have used acetate as a perfusion marker, essentially no data are available for the extraction fraction of acetate in humans under high-flow conditions.
Because a general use of acetate for perfusion quantification requires that this tracer be usable at arbitrary flow levels, we determined the acetate extraction fraction by a comparison with ammonia at rest and under pharmacologic vasodilation. A second aim of this study was to evaluate the statistical accuracy of perfusion estimates derived with both tracers.
MATERIALS AND METHODS
Patients
Twenty-four patients with proven coronary artery disease (n = 17) and/or suspected endothelial dysfunction (n = 10) were included (20 men, 4 women; age range, 36–79 y; median age, 62 y). For determination of the acetate extraction fraction, 2 successive PET scans with [13N]ammonia and [1-11C]acetate either at rest (n = 8) or under pharmacologic vasodilation (n = 16) were used. The investigation was performed in accord with the guidelines of the local ethics committee.
Data Acquisition and Reconstruction
Pairs of PET scans with [13N]ammonia and [1-11C]acetate were acquired. The respective scans were obtained in direct succession without patient repositioning using either an ECAT 951/31 scanner or an ECAT 922 scanner (CTI, Knoxville, TN/Siemens Medical Systems, Inc., Hoffman Estates, IL). All scans were acquired dynamically (12 × 10 s, 5 × 30 s, 2 × 120 s, and 1 × 900 s for ammonia [sum, 23.5 min]; 10 × 10 s, 1 × 60 s, 5 × 100 s, 3 × 180 s, and 5 × 300 s for acetate [sum, 45 min]) after bolus injection (30 s) of the tracer (ammonia, 1.1 GBq; acetate, 1.1 GBq).
High-flow conditions were achieved by pharmacologic vasodilation with adenosine (ammonia studies, 0.14 mg/kg/min during 6 min, with tracer application after 3 min; acetate studies, 0.14 mg/kg/min during 8 min, with tracer application after 2 min). A modified adenosine infusion scheme for the acetate studies was used to guarantee maximum vasodilation during the whole phase of tracer accumulation, which is prolonged in comparison with ammonia. In this way, constant flow conditions were achieved in the respective time ranges that are most important for perfusion quantification.
Because of the short half-life of adenosine (10 s), there was no interference between the successive studies. In the studies under vasodilation, an ST-segment depression was observed in 1 patient. Arrhythmic episodes occurred in 3 patients. During all studies, the rate–pressure product (RPP) was monitored. The variation of the RPP between the pairs of successive studies was 3% ± 16% (mean ± SD).
Transaxial images were reconstructed (with attenuation correction based on measured transmission [20 min], filtered backprojection with a Hanning filter and a cutoff of 0.38, and a 128 × 128 image matrix) and 3-dimensionally smoothed to isotropic resolution (a full width at half maximum of approximately 10 mm).
Image Processing
The image data were transformed into dynamic polar maps whose pixels represented equal areas of the myocardial surface (area-conserving polar maps). This transformation was achieved using an automatic rendering of the center of the left ventricular myocardial wall in the transaxially acquired image volume (24,25). Rendering was based on summed images from the dynamic scans. The chosen intervals (ammonia, 15 min starting 8.5 min after injection; acetate, 5 min starting 2.5 min after injection) yielded a good delineation of anatomy with both tracers. An individual mapping of each study into the respective polar map was performed to account for possible slight patient movement between the 2 runs. In this way, a good spatial correspondence of pixel pairs from both polar maps was ensured. Because all polar map pixels represented equal areas, the correct relative weighting of the different myocardial regions was ensured during further data evaluation.
The arterial input function was automatically determined in the cavum of the left ventricle by shrinking the detected myocardial surface to 30% of the original size toward the center of the ventricle, resulting in a typical separation of 15–20 mm between endocardial wall and boundary of the input function volume of interest. The resulting input function exhibited high statistical accuracy and included minimal spillover (typically 2% or less) from tissue.
Quantification was performed on an individual-pixel basis in the dynamic polar maps using the compartmental models described below. The resulting parametric polar maps of perfusion f (determined with [13N]ammonia) and initial acetate uptake K1 were used for further data evaluation.
Compartmental Model for Ammonia
Quantification of the ammonia studies was based on the irreversible 2-tissue-compartment model described by Hutchins et al. (26). The differential equation of this model is:
 where c1 is free tracer in tissue; c2 is metabolically bound tracer; ct = c1 + c2, or total tracer concentration in tissue; and ca is arterial [13N]ammonia concentration. Ammonia is considered as freely diffusible across the capillary wall. Therefore, the unidirectional uptake parameter K1 equals perfusion f.
Data fitting was extended over the whole time course of the acquisition (23 min). An averaged metabolite correction of the input function was performed by fitting the formula
 to the data presented by Rosenspire et al. (27), which yields t0 = 0.48 min and T1/2 = 6.69 min. (cm is measured total arterial tracer concentration, including metabolites. The parameter t0 was introduced to account for the visible delayed onset of metabolite activity.)
Compartmental Model for Acetate
For quantification of the [1-11C]acetate studies, a reversible 1-tissue-compartment model was used. This model resulted from simplification of a detailed 5-compartment model discussed previously (21). The differential equation is given by:
 where ct is tracer concentration in tissue; ca is arterial [1-11C]acetate concentration); and K1 and k2 correspond to Ka and kb, respectively, in (21). Data fitting extended over the first 20 min after injection. The fact that this interval extended beyond the time of adenosine-induced vasodilation might have caused a small bias in the K1 estimates because of the significantly increased flow-sensitive time range in comparison with that of ammonia. The adequacy of the chosen fitting interval was therefore checked by independent data evaluations of 10- and 5-min intervals, respectively.
An averaged metabolite correction of the input function was performed using the result of Buck et al. (28):
 Eq. 4
which is in reasonable agreement with the more recent data of Sun et al. (22).
Eq. 4
which is in reasonable agreement with the more recent data of Sun et al. (22).
Recovery and Spillover Correction
Recovery and spillover effects were corrected as follows. The signal cs measured by the PET scanner (i.e., the apparent myocardial tracer concentration) is:
 Eq. 5
where ct is true myocardial tracer concentration, cm is measured total tracer concentration in blood, R is recovery fraction of myocardial tracer concentration, S is spillover fraction of blood-pool activity, and fbv is fractional blood volume.
Eq. 5
where ct is true myocardial tracer concentration, cm is measured total tracer concentration in blood, R is recovery fraction of myocardial tracer concentration, S is spillover fraction of blood-pool activity, and fbv is fractional blood volume.
Defining total blood volume as tbv = R × fbv + S, Equation 5 can be rewritten as:
 Eq. 6
Eq. 6
The complementary nature of spillover and recovery effects noted by Hutchins et al. (29) leads to the approximate identity R ≈ 1 − S. Because R × fbv ≪ S, it follows that tbv ≈ S and, therefore, R ≈ 1 − tbv. The following approximation results:
 Eq. 7
The use of Equation 7 enables a satisfactory implicit correction of spillover and recovery effects (29,30).
Eq. 7
The use of Equation 7 enables a satisfactory implicit correction of spillover and recovery effects (29,30).
Determination of Compartmental Model Parameters
Quantification was performed on an individual-pixel basis in the dynamic polar maps. We used the multilinear least squares algorithm originally developed by Blomqvist (31) for the 18F-FDG model, which is structurally identical to the ammonia model used in the current investigation. Setting k3 = 0, one can easily adapt the formalism to the 1-compartment model used for acetate. The modifications necessary to account for fractional blood volume and metabolites are included.
A comparison of the statistical accuracy of perfusion estimates obtained with both tracers was performed by independently fitting the global left ventricular time–activity curves with the discussed models. The global curves were applied to maximize the statistical accuracy of the data used in the comparison. Unweighted fits were performed and error estimates were derived from the covariance matrix C after multiplication with the reduced χ2 (sum of least squares deviations divided by the degrees of freedom of the fit): C → χ2C (32). This is equivalent to interpreting all deviations between data and fit as stemming from statistical uncertainties of the data. This procedure allows derivation of realistic error estimates if the actual statistical uncertainties of the data are unknown or are difficult to obtain, as is the case for reconstructed image data.
Determination of Acetate Extraction Fraction
The relationship between unidirectional acetate uptake K1 and perfusion f can be written as:
 Eq. 8
where E(f) is the flow-dependent unidirectional extraction fraction. We used a generalized Renkin–Crone formula to describe the flow dependence of E:
Eq. 8
where E(f) is the flow-dependent unidirectional extraction fraction. We used a generalized Renkin–Crone formula to describe the flow dependence of E:
 Eq. 9
which is equivalent to the standard formula of Renkin (33) and Crone (34):
Eq. 9
which is equivalent to the standard formula of Renkin (33) and Crone (34):
 if one assumes the following flow dependence of the PS product:
 Inserting Equation 9 into Equation 8 yields:
 Eq. 10
The parameters a and b were determined by standard nonlinear least squares fitting (Levenberg–Marquardt algorithm) of Equation 10 to the pixel-by-pixel correlation of acetate K1 values and corresponding perfusion values f determined with ammonia.
In analogy with the procedure used for the compartmental model fits, error estimates for the derived acetate extraction fraction were based on the covariance matrix after multiplication with χ2. The covariance matrix C of the fitted parameters a and b is:
 where σa and σb are the SEs and σab is the covariance of both parameters. Based on the covariance matrix, the SE of the extraction fraction E is given by error propagation in the Renkin–Crone formula:
 Eq. 11
Inserting the partial derivatives resulting from Equation 9 yields:
 Eq. 12
SEs correspond to the 68% confidence limit. In the following, the more conservative error estimate ΔE = 2σE is used, which corresponds to the 95% confidence limit.
Eq. 12
SEs correspond to the 68% confidence limit. In the following, the more conservative error estimate ΔE = 2σE is used, which corresponds to the 95% confidence limit.
The formalism outlined above is based on the assumption that the underlying data points are uncorrelated. The strong correlations between neighboring pixels in the polar maps (caused by the combined effects of image reconstruction, spatial smoothing, and transformation into polar maps) therefore prevent determination of parameter estimation errors and confidence limits from the pixel-based fit. Thus, independent fittings were performed after averaging the data either over 90° polar map segments or over the complete polar maps (left ventricular averages). This averaging essentially removes correlations between the data points so that Equation 12 becomes applicable.
RESULTS
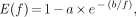
In Figure 1, the pixel-by-pixel correlation of ammonia-derived perfusion and unidirectional acetate uptake is shown using the pooled data from all 24 pairs of parametric polar maps. The curve resulting from the least squares fit of Equation 10 to the data is indicated by the gray line.

Two-dimensional histogram of pixel-by-pixel correlation of f (ammonia) and K1 (acetate) together with fit of Equation 10 to data. Data from all 24 patients are pooled in histogram. Note logarithmic color coding of histogram frequencies.
Reduction of the fitting interval for acetate from 20 to 10 min leads to an average increase in the derived K1 estimates of 1.8% (3% at f = 4 mL/min/mL). Reduction to 5 min yields an average increase of 3.3% (7% at f = 4 mL/min/mL). Thus, any potential bias is small. Because reduction of the fitting interval diminishes the statistical quality of the K1 estimates and deteriorates identifiability of k2, the 20-min fitting interval is preferred.
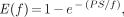
To derive realistic error estimates, we performed independent fits after averaging the data over large regions of interest. In Figure 2, the results are shown using 90° polar map segments and left ventricular averages. Both fits yield similar results. The fit to the pixel-by-pixel correlation is covered by the indicated confidence limits, approaching the lower limit at high flows. The calculated confidence limits agree reasonably well with each other, showing the validity of the error estimation procedure. We have adopted theslightly more conservative error estimate based on the fit to the left ventricular averages because in this case the assumption of uncorrelated data points is strictly fulfilled. Combining this error estimate with the result from the pixel-based fit finally yields, for the acetate extraction fraction,
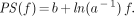
 Using this relation, perfusion values are derived from the measured K1 values according to Equation 10 (using, for instance, table lookup). An example is given in Figure 3. Shown are polar maps of the respective parameters, which are scaled to a common maximum to show the reduction in K1 relative to f.

(A) Correlation of region-of-interest averages of f (ammonia) and K1 (acetate) together with fit of Equation 10 to data (solid line). Each region of interest covers 90° segment of polar map. Dotted lines indicate confidence limit of ΔE = 2σE. (B) Correlation of left ventricular averages of f (ammonia) and K1 (acetate) together with fit of Equation 10 to data (solid line). Dotted lines indicate confidence limit of ΔE = 2σE. Average uncertainty in displayed flow range is ΔE/E ≈ ±6%, increasing to approximately 9% at f = 4 mL/min/mL. Linear correlation coefficient of data is 0.97. Dashed line is straight line fit.

Parametric polar maps of measured acetate uptake rate K1 (left) and corresponding perfusion after extraction correction according to Equation 13 (middle). Perfusion measured with ammonia (right) is shown for comparison. This investigation was performed under pharmacologic vasodilation in patient with large inferolateral infarction. Reduction of K1 relative to f is obvious. Extraction correction yields satisfactory quantitative agreement of perfusion values derived with acetate and ammonia.
Averaging over the respective polar maps allows computation of the global left ventricular perfusion. Averaging of the differences between acetate-derived perfusion and ammonia-derived perfusion yields −3% ± 15%. Table 1 shows the individual global perfusion values for all patients.
Left Ventricular Perfusion Determined with Acetate and Ammonia
The consistency of the implicit recovery and spillover correction achieved by introducing the total blood volume parameter tbv is shown by comparing the fitted values in the pairs of scans. Table 2 gives the results.
Left Ventricular Averages of Total Blood Volume
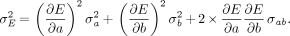
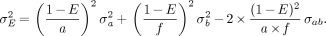
The flow dependence of the acetate extraction fraction according to Equation 13 is shown, together with published data, in Figure 4.
Comparison of measured flow dependence of acetate extraction fraction with published data. Reported results are plotted in approximate flow range covered by measurements. In investigation of Sun et al. (22), methodology similar to ours was used in group of healthy volunteers under resting conditions. Armbrecht et al. (2) derived their result invasively in open-chest dogs. std.dev. = SD.
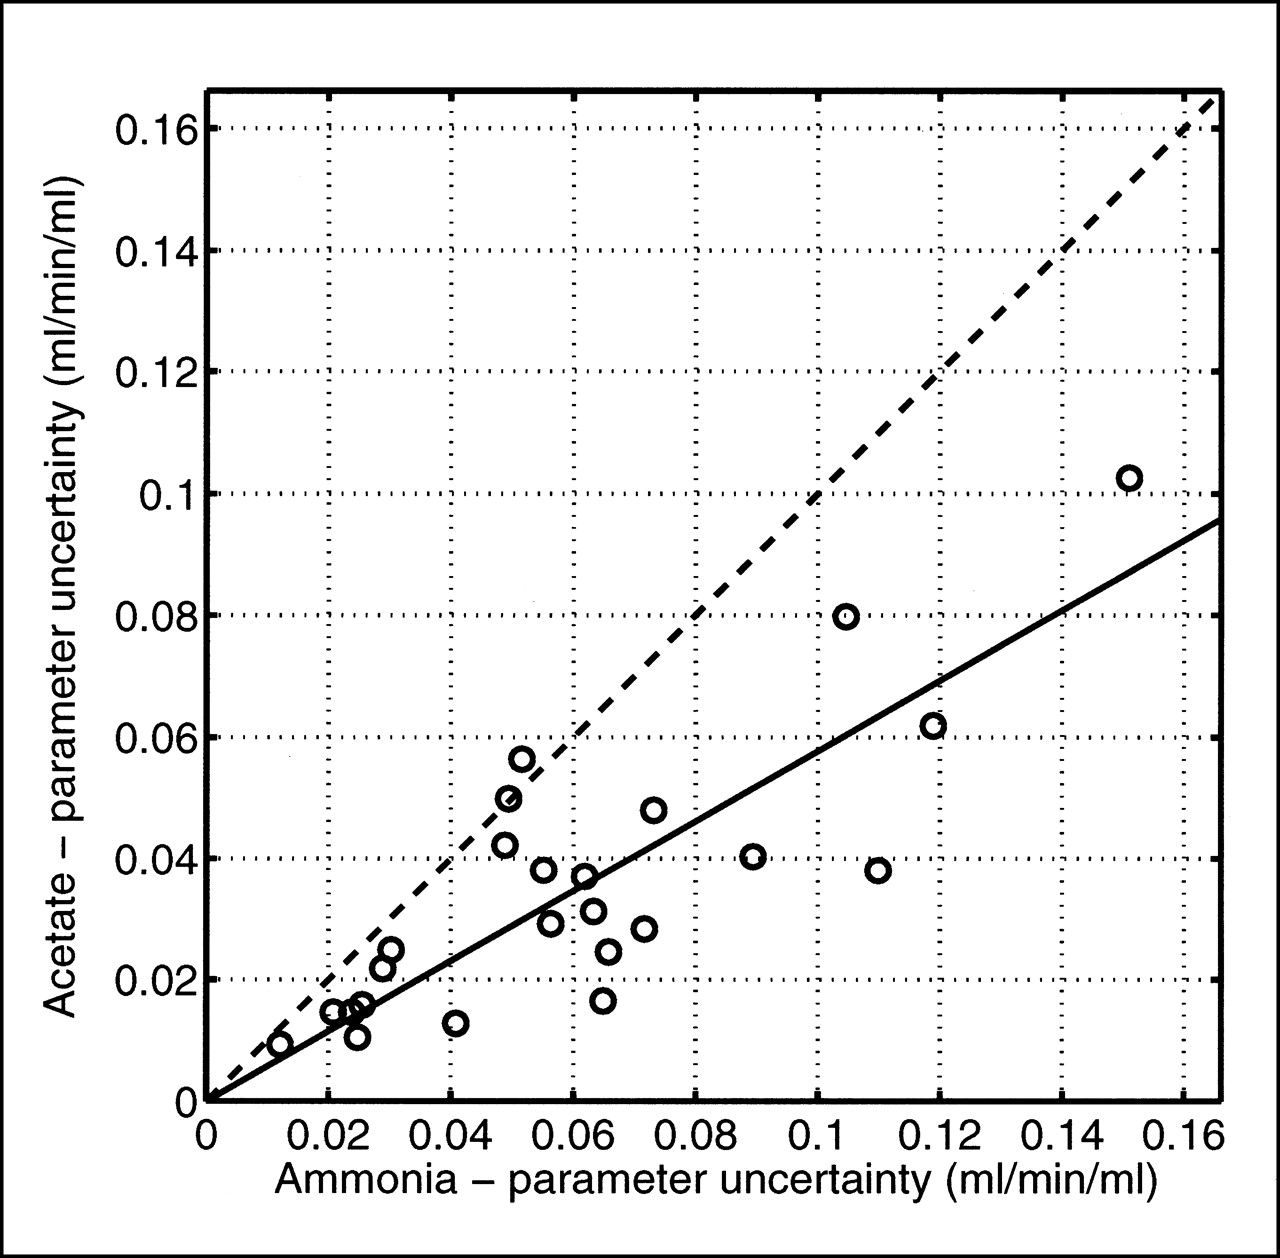
The global left ventricular time–activity curves (obtained by averaging over the dynamic polar maps) were used to compare the statistical accuracy of perfusion values derived with ammonia and acetate. For acetate, extraction correction of the derived K1 values according to Equation 13 was performed. The estimation errors resulting from the least squares fits are shown in Figure 5. On average, the estimation errors were reduced to 58% for acetate in comparison with ammonia.

Accuracy of perfusion estimates obtained with ammonia and acetate. Shown are parameter estimation errors resulting from fits of model equations to global left ventricular time–activity curves. Estimation errors for acetate are reduced to 58% in comparison with ammonia. Solid line = least squares fit of straight line through origin; dashed line = line of identity.
DISCUSSION
The current investigation used the Hutchins model (the model developed by Hutchins et al. (26,29)) to quantify [13N]ammonia studies. An alternative approach has been developed and refined at the University of California, Los Angeles (UCLA) (35–37). This approach differs from the Hutchins model with respect to interpretation of the underlying 2-compartment configuration and allows a reduction in the number of free model parameters. Contrary to the Hutchins model, perfusion determination with this approach necessitates an extraction correction (38,39). Data evaluation is restricted to the very early phase (usually up to 60–120 s after injection).
Recently, the performance of different implementations of this approach as well as the Hutchins model has been investigated by the UCLA group (30). According to that study, both approaches yielded perfusion values that correlated linearly with microsphere-derived perfusion. For the Hutchins model, a systematic underestimate of perfusion by 25% was reported. The authors concluded that a variant of the UCLA approach should be the method of choice, mainly because of a superior signal-to-noise ratio. We have nevertheless preferred the Hutchins model for our investigation because, as has been noted (30), the quantitative discrepancies between both approaches might well be explained by details of implementation and region-of-interest positioning. This possibility is supported by our own experience that the discrepancies of both methods are usually smaller, amounting to <10% for f < 2 mL/min/mL. The discrepancies might also be attributed to the fact that the validity of the extraction correction, which is necessary in the UCLA approach, has been strictly proven only for canine myocardium. The Hutchins model, on the other hand, treats ammonia as freely diffusible (which leads to identification of K1 and f) and is, therefore, not affected by the question of applicability of extraction data from animal experiments. Moreover, open questions remain concerning the neglect of slow clearance of free ammonia from tissue in the UCLA approach (40). Our weighing of the advantages and disadvantages of the alternative approaches resulted in a preference for the Hutchins model. If the mentioned 10%–25% differences between the alternative ammonia models are interpreted as an estimate of the systematic accuracy of perfusion quantification with this tracer, a similar systematic uncertainty about the acetate extraction fraction (and acetate-derived perfusion values) will be the consequence.
For acetate, 1- and 2-compartment models resulting from simplifications of a more detailed 5-compartment model have been shown to be suitable for quantification of PET investigations (21). Similar model configurations have been used in other studies (22,28). Within the first 20 min after injection, the 1-compartment model usually constitutes a sufficiently accurate description of the tracer kinetics. Only at later times does the influence of the second compartment, which reflects transport into the amino acid pool, become significant. If the 1-compartment model is to be used to determine high oxygen consumption rates (corresponding to rapid tissue clearance), a reduction in the scanning time may be needed. In this study, however, one is interested only in the uptake parameter K1. This parameter can always be determined accurately with the 1-compartment approach and is virtually unaffected by transition to a 2-compartment configuration (18,21). Possible bias in the K1 estimates at high flows (caused by extending the fitting interval beyond the time of adenosine-induced vasodilation) has been investigated by performing additional fits using 10- and 5-min intervals. Reduction to 10 min leads to negligible alterations of the fitted K1 values (1.8% on average). Reduction to 5 min yields alterations of 3.3% on average and 7% at high flows. Thus, any potential bias is small. We therefore think it more reasonable to extend fitting to 20 min to avoid loss of the statistical accuracy of the K1 estimates. The residual bias of K1 does not translate into bias of the flow estimates because the extraction correction is derived by directly comparing the measured K1 with ammonia-derived perfusion.
The adequacy of metabolite, recovery, and spillover correction requires some discussion. The occurrence of metabolites in the blood pool can pose a problem for quantification of PET studies both with ammonia and with acetate. The average metabolite corrections (Eqs. 2 and 4) that we have used for both tracers are considered sufficient in the present case. The metabolite fraction is always increasing slowly with time (half-times of approximately 5–6 min), and metabolite correction modifies the area under the time–activity curve (which corresponds to the total tracer amount delivered to tissue) only slightly during bolus passage of the tracer through the myocardium. Because perfusion quantification is influenced mainly by this early phase, the influence of metabolites on quantification of uptake parameters is expected to be small.
Omission of metabolite correction alters the uptake parameters by usually <10%. Thus, deviations of the average metabolite correction from the individually optimal correction will have even less influence on the derived values. The remaining deviations of the fitted K1 and f from their correct values are uncorrelated and contribute to the statistical uncertainties of the parameter estimates in the fit of Equation 10.
Recovery and spillover have a large effect on the determination of uptake parameters (K1 or f) in myocardial PET. The approach used in this study, namely the implicit correction of limited recovery and spillover by including a total blood volume parameter tbv in the evaluation, has yielded good quantitative accuracy for the derived uptake parameters (29,30).
We have checked the consistency of the implicit correction by comparing the tbv values derived from the pairs of scans with ammonia and acetate. We found that the tbv values exhibit a strong linear correlation (r = 0.86) and that the expected increase in tbv during adenosine infusion is clearly seen with both tracers. Moreover, as Table 2 shows, the tbv values differ, on average, by a few percentage points at most, both at rest and under stress conditions. Thus, the applied recovery corrections are similar, and potential deviations of f and K1 from their true values correlate in each pair of scans. As a consequence, the measured ratio K1/f (i.e., the extraction fraction) is altered much less than the individual parameters, implying, in turn, that the influence on the fit of Equation 10 is minimal.
Our determination of the acetate extraction fraction was based on a fit of Equation 10 to the K1(f) correlation. We did not attempt to correct the data before the fit with respect to the possible influence of RPP variations between the pairs of successive studies. These variations were mainly in the range of ±10%. On average, the RPP increased by approximately 3% between successive scans, indicating similar small potential changes in perfusion between the 2 scans. These small effects cannot be corrected reliably because of inherent uncertainties concerning the relationship between RPP and perfusion. During vasodilation, the usual assumption of approximate proportionality between RPP and perfusion is invalid in any case. The observed RPP changes may contribute, to a certain extent, to the observed statistical fluctuations of the data but are not expected to introduce any significant bias in the parameter estimation.
We have used the generalized Renkin–Crone formula (Eq. 9) to describe the observed flow dependence of the extraction fraction. Equation 9 has the advantage that the low-flow behavior is theoretically correct: at sufficiently low flows, extraction should always approach 100%, implying K1(f = 0) = 0. The general validity of Equation 9, however, depends on certain assumptions, which cannot easily be shown to be true in the present case.
From a purely phenomenological point of view, the use of this relation in the evaluation of the K1(f) dependence yields a higher goodness of fit than a simple linear regression (which is also a 2-parameter fit). The improvement is most obvious for the pixel-based evaluation, in which the nonlinear variation of K1(f) is clearly visible (as in Fig. 1). In fits to averaged data (Fig. 2), the nonlinear variation is less obvious because of the reduced dynamic range of the data. For evaluation of the global averages, linear regression yields nearly the same goodness of fit, so in this case there is no clear preference for the Renkin–Crone formula. Nevertheless, the erroneous low-flow behavior of the linear regression (extraction fraction exceeding 100%) should be noted.
As can be seen from a comparison of Figures 1 and 2, the fits to the averaged data deviate visibly from the pixel-based fit at higher flows, although the deviations never exceed the reported confidence limit. The small deviation might be explained by the fact that the averaging reduces the dynamic range of the data. Moreover, because of the nonlinear dependence of extraction on flow, a small bias is introduced in the determination of E(f) if the data are averaged over areas with heterogeneous flow. For these reasons, the pixel-based fit is adopted, whereas the average-based fit is used for determination of estimation errors, which cannot be derived otherwise.
The final result is given by Equation 13, in which the parameter uncertainties are taken from the fit to the left ventricular averages (Fig. 2B). From these values, the 95% confidence limit displayed in Figure 4 is derived. The average uncertainty in the displayed flow range is ΔE/E ≈ ±6%, increasing to approximately 9% at f = 4 mL/min/mL. This confidence limit, by indicating the possible contribution of the extraction correction to the uncertainty of the derived perfusion values, also shows that the extraction correction can be considered sufficiently accurate for application to myocardial PET.
Acetate has already been used by some groups for qualitative assessment of myocardial perfusion (7,8,19). One group (23) used data from dog experiments for a rough estimate of the extraction fraction, neglecting the influence of variable tissue clearance rates and the flow dependence of the extraction. Neglecting the tissue clearance results in an apparent reduction of the net extraction fraction and explains the low value—52%—used by that group (23). Only 2 groups have addressed the problem of determining the flow dependence of the acetate extraction (2,22).
Armbrecht et al. (2) performed their investigation in open-chest dogs. In comparison with our results, the reported extraction fraction was significantly lower over the whole physiologic flow range (Fig. 4). The reasons might be 2-fold. First, a different extraction fraction of acetate in human and canine myocardium would easily explain the observed difference of approximately 25% under resting conditions. A second important factor is the necessarily simplifying nature of the compartmental models used for description of acetate kinetics. As has been extensively discussed (21), the impulse response curves measured by Armbrecht et al., notably the delayed onset of tissue clearance, can be explained only by the rather complex multicompartmental models, which are not applicable to PET investigations. The simplified models used for evaluation of PET investigations summarize the unresolved rapid initial transport steps by a single parameter, the effective initial uptake K1. The extraction fraction, defined as the ratio K1/f, is thus not identical to the first-pass extraction measured by Armbrecht et al. after passage of a short intraarterially injected bolus. Both factors, actual differences in the extraction fraction between humans and dogs as well as nonequivalent definitions of the extraction fraction, can explain the observed differences.
Besides our study, another determination of the acetate extraction fraction in humans was performed. Sun et al. (22) compared successive PET scans obtained with [13N]ammonia and [1-11C]acetate in 12 healthy volunteers under resting conditions. Our data extend to higher flow levels and allow derivation of the extraction fraction under these conditions as well (Fig. 4). We think a further improvement is achieved by a consequent quantification on an individual-pixel basis, which avoids the problem of averaging over flow heterogeneities.
Within the restricted flow range covered by the investigation of Sun et al. (22), the quantitative agreement with our results is remarkably good (Fig. 4). This supports the conjecture that the effective acetate extraction fraction in humans is significantly higher than assumed previously as a result of animal experiments. The increasing deviations at low flows are a consequence of the linear regression fit used by Sun et al., which leads to problems when extrapolating toward low flows. The fact that Sun et al. used the alternative ammonia model and a special 2-compartment model for acetate supports our conclusion that the influence of the chosen model structure on the determination of the extraction fraction is small.
The good agreement of results moreover indicates that the extraction fraction is not dependent on pathophysiologic alterations. The healthy volunteers investigated by Sun et al. (22), as well as our heterogeneous patient group, exhibited consistent values for the acetate extraction under resting conditions. This consistency confirms the conclusion drawn by Sun et al. that, at a given flow level, the acetate extraction fraction in humans exhibits no significant interindividual variations—a prerequisite for perfusion quantification with this tracer.
Apart from the systematic accuracy, the obtainable statistical accuracy of the perfusion estimates is important. Figure 5 clearly shows the improved statistical accuracy of perfusion estimates derived with acetate. The estimation errors are reduced to 58% in comparison with ammonia, using the same injected activities. This finding remains valid despite the fact that error estimates were derived using averaged time–activity curves for the left ventricle. Averaging over flow heterogeneities does lead to systematic bias in the parameter estimates. Nevertheless, the models do fit the curves well and the resulting values for the statistical accuracy of the parameters still represent reasonable estimates.
A direct consequence of the reduced statistical fluctuations of the perfusion estimates is an improvement in the quality of parametric polar maps or parametric images. In our experience, acetate-derived perfusion maps are usually of higher quality. This fact might also be attributed, in part, to an improved ability to delineate the myocardium early in the scan, thus reducing problems with patient movement.
CONCLUSION
[1-11C]acetate is a suitable tracer for accurate perfusion quantification with PET over the whole physiologic flow range. Using identical injected doses, the statistical accuracy of the perfusion estimates is increased by a factor of nearly 2 in comparison with [13N]ammonia. A second advantage is the reduced sensitivity of the quantification procedure to patient movement because of improved delineation of the myocardium in the early phase. The ability to quantify perfusion and oxygen consumption simultaneously in a single PET investigation might allow replacement of the current dual-tracer techniques for detection of viable myocardium. The capability to generate reliable parametric maps facilitates routine clinical application of myocardial perfusion quantification.
Footnotes
Received Jul. 5, 2000; revision accepted Nov. 14, 2000.
For correspondence or reprints contact: Jörg van den Hoff, PhD, Klinik für Nuklearmedizin, Medizinische Hochschule Hannover, Carl-Neuberg-Strasse 1, 30625 Hannover, Germany.
REFERENCES
In this issue


Jump to section
Related Articles
Cited By...
- Myocardial Metabolism in Endurance Exercise-Induced Left Ventricular Hypertrophy
- Metoprolol Reduces Hemodynamic and Metabolic Overload in Asymptomatic Aortic Valve Stenosis Patients: A Randomized Trial
- Myocardial Oxygen Consumption and Efficiency in Aortic Valve Stenosis Patients With and Without Heart Failure
- Effect of levosimendan therapy on myocardial infarct size and left ventricular function after acute coronary occlusion
- Seven-Day Caloric and Saturated Fat Restriction Increases Myocardial Dietary Fatty Acid Partitioning in Impaired Glucose-Tolerant Subjects
- 11C-Acetate Clearance as an Index of Oxygen Consumption of the Right Myocardium in Idiopathic Pulmonary Arterial Hypertension: A Validation Study Using 15O-Labeled Tracers and PET
- In Vivo Visualization of Amyloid Deposits in the Heart with 11C-PIB and PET
- Increased Myocardial Uptake of Dietary Fatty Acids Linked to Cardiac Dysfunction in Glucose-Intolerant Humans
- Normal Postprandial Nonesterified Fatty Acid Uptake in Muscles Despite Increased Circulating Fatty Acids in Type 2 Diabetes
- Myocardial blood flow in patients with low-flow, low-gradient aortic stenosis: differences between true and pseudo-severe aortic stenosis. Results from the multicentre TOPAS (Truly or Pseudo-Severe Aortic Stenosis) study
- Myocardial Sympathetic Innervation in Patients with Symptomatic Coronary Artery Disease: Follow-up After 1 Year with Neurostimulation
- 1-11C-Acetate Kinetics of Prostate Cancer
- Cardiac Efficiency and Oxygen Consumption Measured with 11C-Acetate PET After Long-Term Cardiac Resynchronization Therapy
- Attenuation Correction of Myocardial SPECT Perfusion Images with Low-Dose CT: Evaluation of the Method by Comparison with Perfusion PET
- Influence of mobilized stem cells on myocardial infarct repair in a nonhuman primate model
- Simple and Accurate Assessment of Forward Cardiac Output by Use of 1-11C-Acetate PET Verified in a Pig Model
- What Is the Best Approach to Quantify Myocardial Blood Flow with PET?