


Abstract
We have evaluated a method for absolute in vivo quantification of 99mTc-sestamibi uptake in a porcine model of myocardial perfusion. Methods: Correlated CT and radionuclide images were obtained from eight adult pigs using a combined CT–SPECT imaging system. In each case, the CT image is used to generate an object-specific attenuation map that is incorporated into an iterative algorithm for reconstruction and attenuation correction of the radionuclide image. Anatomic information available from the correlated CT image is used to correct the radionuclide image for partial-volume errors by mathematically modeling the radionuclide imaging process. A volume of interest, or template, that approximates the geometric extent of the myocardium is defined from the CT image. Once defined, the template is assigned unit activity and is mathematically projected using a realistic physical model of the radionuclide imaging process including nonideal collimation and object-specific attenuation. The template is then reconstructed from these projections to obtain a pixel-by-pixel partial-volume correction for the myocardium in the radionuclide image. The CT image is also used to delimit the anatomic boundaries of the myocardium for quantification of the radionuclide images. The pixel intensities in the corrected radionuclide image are calibrated in units of activity concentration (MBq/g) and compared with the ex vivo activity concentration measured directly from the excised myocardium. Results: Without corrections, the measured in vivo activity concentration in the porcine myocardium was only 10% of the true value. Correcting for object-specific attenuation improved the accuracy of this measurement but resulted in values that were still only 42% of the true value. By correcting for both attenuation and partial-volume errors, we were able to achieve absolute quantification with an accuracy error near 10%. Conclusion: We have shown that, by applying object-specific attenuation corrections and suitable partial-volume corrections, absolute regional activity concentration can be measured accurately in the porcine myocardium.
Since the 1980s, SPECT imaging has been used to study myocardial perfusion noninvasively. Current techniques for assessing myocardial perfusion studies generally rely on visual interpretation and on analysis of relative tracer activity within the myocardial regions defined by an individual SPECT study. Most of these techniques rely on maximal counts derived from radial sectors of reconstructed short-axis slices (maximum count circumferential profiles) normalized by count values in regions of peak intensity assumed to represent normally perfused regions (1) to determine relative tracer activity at rest and after stress. One serious limitation of these relative quantification techniques is that there is no guarantee that there will be a normally perfused myocardial segment. Consider patients with multivessel disease. Although qualitative and relative quantitative analysis may identify the most severely stenosed coronary artery, less severely stenosed arteries may not be identified without an absolute measure of the radionuclide uptake in the myocardium. In the extreme case of balanced triple-vessel disease (2), an overall reduction in activity may be completely overlooked if the data are examined on a relative scale but may be quite evident when evaluated on an absolute scale.
Making only a relative measurement of the radionuclide distribution has further limitations. It does not allow one to compare the amount of tracer uptake at rest with the amount of tracer uptake after stress, which could provide an estimate of coronary artery flow reserve capacity (3). Furthermore, it does not allow for quantitative longitudinal measurements that would show absolute changes in coronary reserve capacity resulting from therapeutic intervention (3).
The ultimate goal is to achieve absolute quantification—that is, to make an absolute measurement of becquerels of tracer per gram of tissue in a specified region of the left ventricular myocardium. Unfortunately, photon attenuation, scatter radiation, partial-volume errors, and other perturbations compromise absolute quantification of radionuclide uptake from SPECT (4–6). Despite the advent of patient-specific attenuation correction, the relatively poor spatial resolution of SPECT remains a major limiting factor for the accuracy of quantitative studies. Once attenuation corrections have been applied, partial-volume effects become a major source of error for absolute quantification of the activity concentration in myocardial SPECT, resulting in underestimation of the true radionuclide content by approximately 50% (7–9). These partial-volume effects severely limit the ability of SPECT to account for structurally dependent variations in reconstructed myocardial activity between individuals (10) and can cause artifactual regional variations in activity around the myocardium within a given individual (11) because of variations in wall thickness (12).
To achieve absolute quantification of single-photon radiopharmaceuticals using a noninvasive technique, we must compensate for physical errors such as photon attenuation, scatter radiation, and partial-volume errors. Traditionally, radionuclide quantification has focused on methods that compensate the radionuclide image for these effects. However, methods that correct the radionuclide image for partial-volume errors using collimator response models cannot recover spatial frequencies that are lost during image acquisition. Similarly, the use of recovery coefficients (13,14) requires a priori information about size and shape and generally is used only for simple target geometries (e.g., spheres or circular annuli (15)). We have departed from this paradigm by developing a method that incorporates a physical model of the image acquisition process into the quantification process itself (9,16) rather than compensating for these effects in the reconstruction of the radionuclide image. In this study we show absolute quantification of radiolabeled tracers in a porcine model of myocardial perfusion by comparing in vivo tracer uptake measurements obtained with a combined CT–SPECT imaging system with ex vivo tracer uptake measurements obtained directly from excised tissue.
MATERIALS AND METHODS
System Description
Our studies were performed using a dual-mode imaging system that combines a commercial CT scanner (GE 9800 Quick; General Electric Medical Systems, Milwaukee, WI) with a single-head scintillation camera (model 600 XR/T; General Electric) into a single imaging system capable of recording coregistered anatomic information from CT and function information from SPECT (17). Because the CT–SPECT system uses a common patient table, no repositioning (other than table translation) is required between the CT and SPECT data acquisitions, which minimizes shifts in internal anatomy and allows accurate image registration. The two datasets are coregistered in software using a rigid-body transformation matrix derived from the images of fiducial markers scanned in the CT–SPECT system (7). Volumes of interest defined in one space can then be easily transferred to the other image space using this transformation matrix. Furthermore, the coregistered CT image can be used to generate an object-specific attenuation map that is incorporated into an iterative maximum-likelihood expectation maximization (MLEM) reconstruction algorithm for attenuation compensation of the radionuclide image (7,8,18,19). Details of the image registration technique and the attenuation map generation have been published (7,20).
Data Acquisition
For all imaging studies, CT data were acquired at 140 kVp, 70 mA, with a 2-s scan time and a 48-cm field of view. The scan region covered the full extent of the myocardium and extended past the dome of the liver. Axial slice collimation and spacing was 3 mm over the entire scan region. The total scan time was approximately 10 min. The CT images were reconstructed with a 512 × 512 format using the filtered backprojection algorithm provided by the scanner manufacturer (General Electric) before being transferred to a workstation for further processing.
The correlated radionuclide images were acquired with 128 angular views over 360° using a 128 × 128 matrix, 15 s per view, a 15% energy window centered at 140 keV, a 23-cm radius of rotation, and a low-energy, high-resolution (LEHR) collimator. With our single-head scintillation camera, the total data acquisition time was approximately 40 min. The radionuclide data were reconstructed as 128 × 128 images using 30 iterations of an MLEM algorithm (21) both with and without attenuation compensation using the object-specific attenuation map derived from the CT image. As shown by previous experiments in our laboratory (18), 30 iterations are sufficient to reach near-convergence with the MLEM algorithm for objects of the size of the myocardium.
Animal Study Protocol
Animal studies were performed on the combined CT–SPECT imaging system to determine if absolute in vivo quantification of a radiotracer uptake could be measured accurately in a porcine model of myocardial perfusion using 99mTc-sestamibi (DuPont Pharmaceuticals, Wilmington, DE). In these experiments, in vivo measurements of the radionuclide uptake in the myocardium could be compared directly with ex vivo activity concentration measurements of the excised tissue. All animal studies were performed with the approval of the institutional committee on animal research.
Eight adult pigs, each weighing approximately 30 kg (mean weight, 28.3 ± 1.5 kg; weight range, 26.3–30.6 kg), were anesthetized and mechanically ventilated on a respirator (Harvard Apparatus, Inc., South Natick, MA). At least 60 min before imaging, each animal was injected intravenously with 1.11 GBq (30 mCi) 99mTc-sestamibi. In two animals, myocardial blood flow was modified by a vasodilator (dipyridamole). Dipyridamole was infused over a 4-min period with 99mTc-sestamibi administered 7 min after the start of the dipyridamole infusion. In three animals, regional myocardial blood flow was modified by occlusion of the left anterior descending (LAD) coronary artery. A left lateral thoracotomy was performed in the fifth intercostal space and the LAD coronary artery was isolated distal to the first major diagonal branch. A snare occluder was placed around the artery and the ribs were repositioned to approximate a closed-chest configuration. Once the animal was positioned on the imaging table, the occlusion was initiated by tightening the snare occluder surrounding the LAD coronary artery. To allow for blood clearance of the radiopharmaceutical, the occlusion was maintained for a total of 6 min, with the administration of 99mTc-sestamibi occurring 2 min after the start of the occlusion. After the 6-min occlusion, the snare occluder was released and the LAD coronary artery was reperfused.
All animals were imaged in the supine position. During CT data acquisition, iodinated contrast agent (300 mg I/mL iohexol) was infused continuously through an ear vein catheter at a constant rate of 5 mL/min to opacify the cardiac blood pool, thus allowing the myocardium to be visualized. To reduce streak artifacts in the CT image caused by respiratory motion, use of the ventilator was suspended during CT image acquisition. After CT data acquisition, the imaging table was extended to the scintillation camera without repositioning the animal on the table in preparation for SPECT scanning. To reduce effects associated with hepatic activity, a minimum of 60 min was allowed to elapse after the 99mTc-sestamibi was injected before SPECT imaging was initiated. After the desired images were acquired, the animal was killed and a set of CT and SPECT images was acquired free of any respiratory or cardiac motion effects.
Ex Vivo Quantification
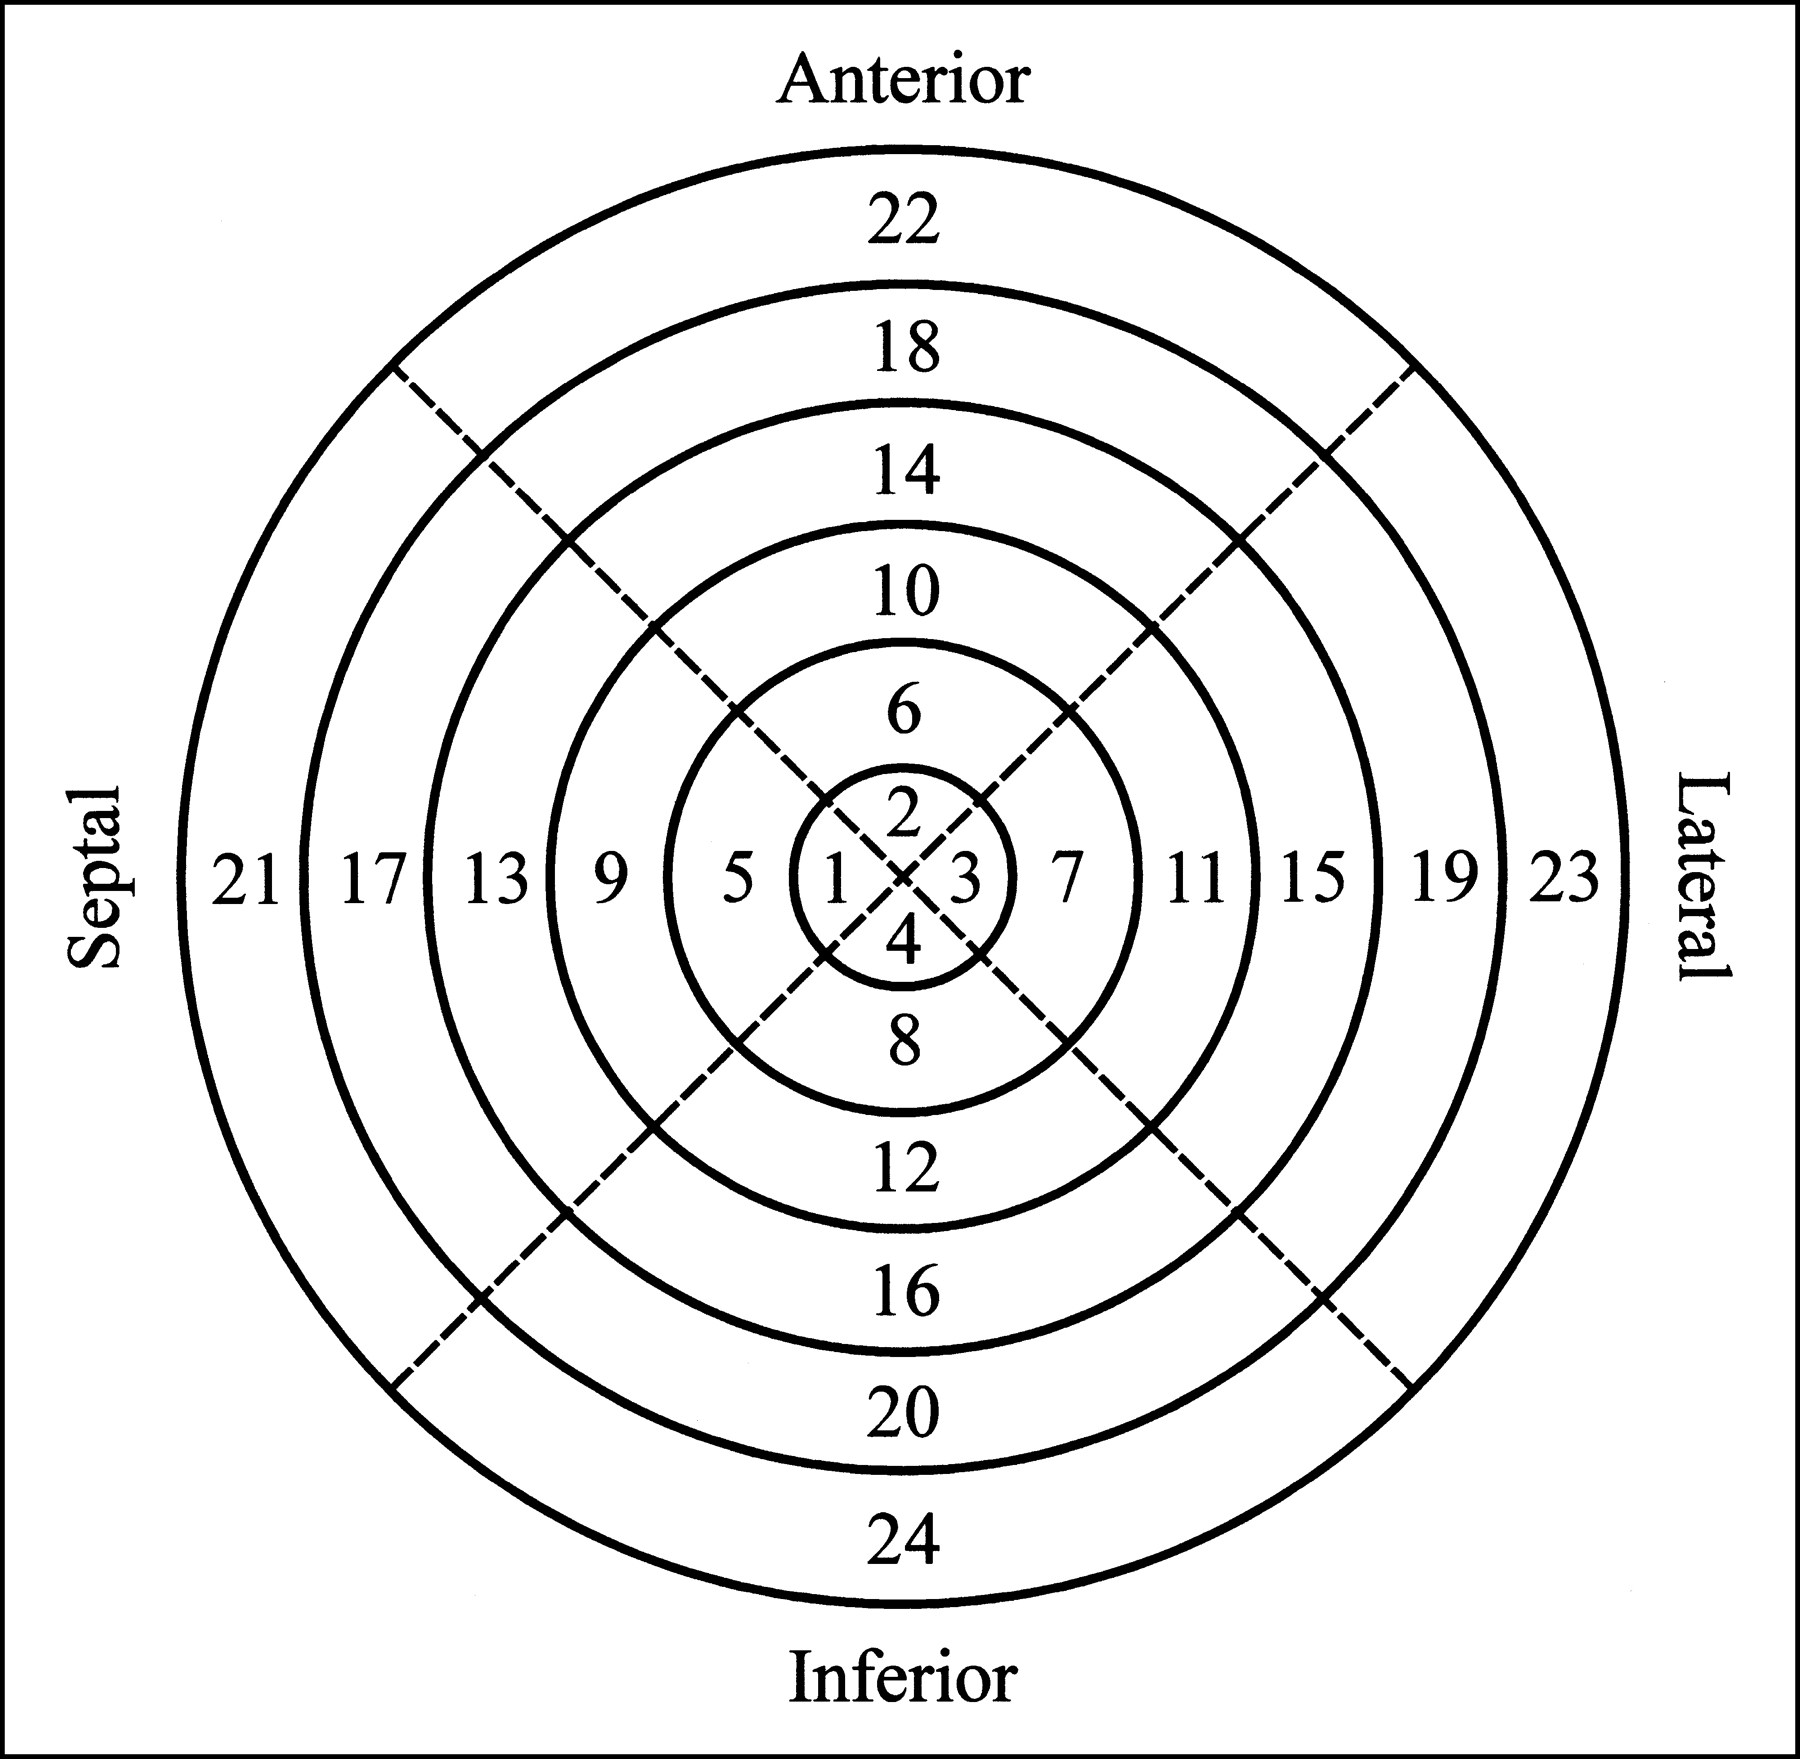
To quantify the regional activity concentration in the myocardium, the heart was removed from the dead animal after the imaging study. Starting from the apex, the myocardium was sliced into approximately 1-cm-thick short-axis slices. Then, for each slice, the left ventricle was separated from the right ventricle and, using the junction of the right ventricle as a reference, the left ventricle was further divided into four roughly equal-sized sections corresponding to the septal, anterior, lateral, and inferior walls. For those animals without a surgically induced defect, the apical slice typically was left intact. The individual tissue samples were then weighed and the radionuclide contents were measured by placing the tissue samples directly on the face of the scintillation camera with a vial containing a known activity of 99mTc as a calibration source. For identification, the myocardial segments were numbered according to the layout shown in Figure 1. For those cases in which the apical slice was left intact, it would be numbered segment 4 and the remaining segments would be numbered as shown (i.e., there would be no segment 1, 2, or 3).

Schematic bull’s eye plot indicates numbering sequence used to identify various myocardial segments. When apical slice was left intact, it would be numbered segment 4 and remaining segments would be numbered as shown.
SPECT Quantification
To calibrate the reconstructed image values into units of activity concentration (kBq/mL), a 14.3-cm-diameter cylindric water phantom containing a known uniform activity concentration of 99mTc was also imaged in the CT–SPECT system. To avoid any possible errors caused by changes in camera efficiency or technique, the calibration factor was measured for each animal study. As expected, the measured calibration factor remained relatively constant between experiments, with a mean value of 0.666 ± 0.011 (kBq/mL)/reconstruction counts and a range of 0.655–0.688 (kBq/mL)/reconstruction counts.
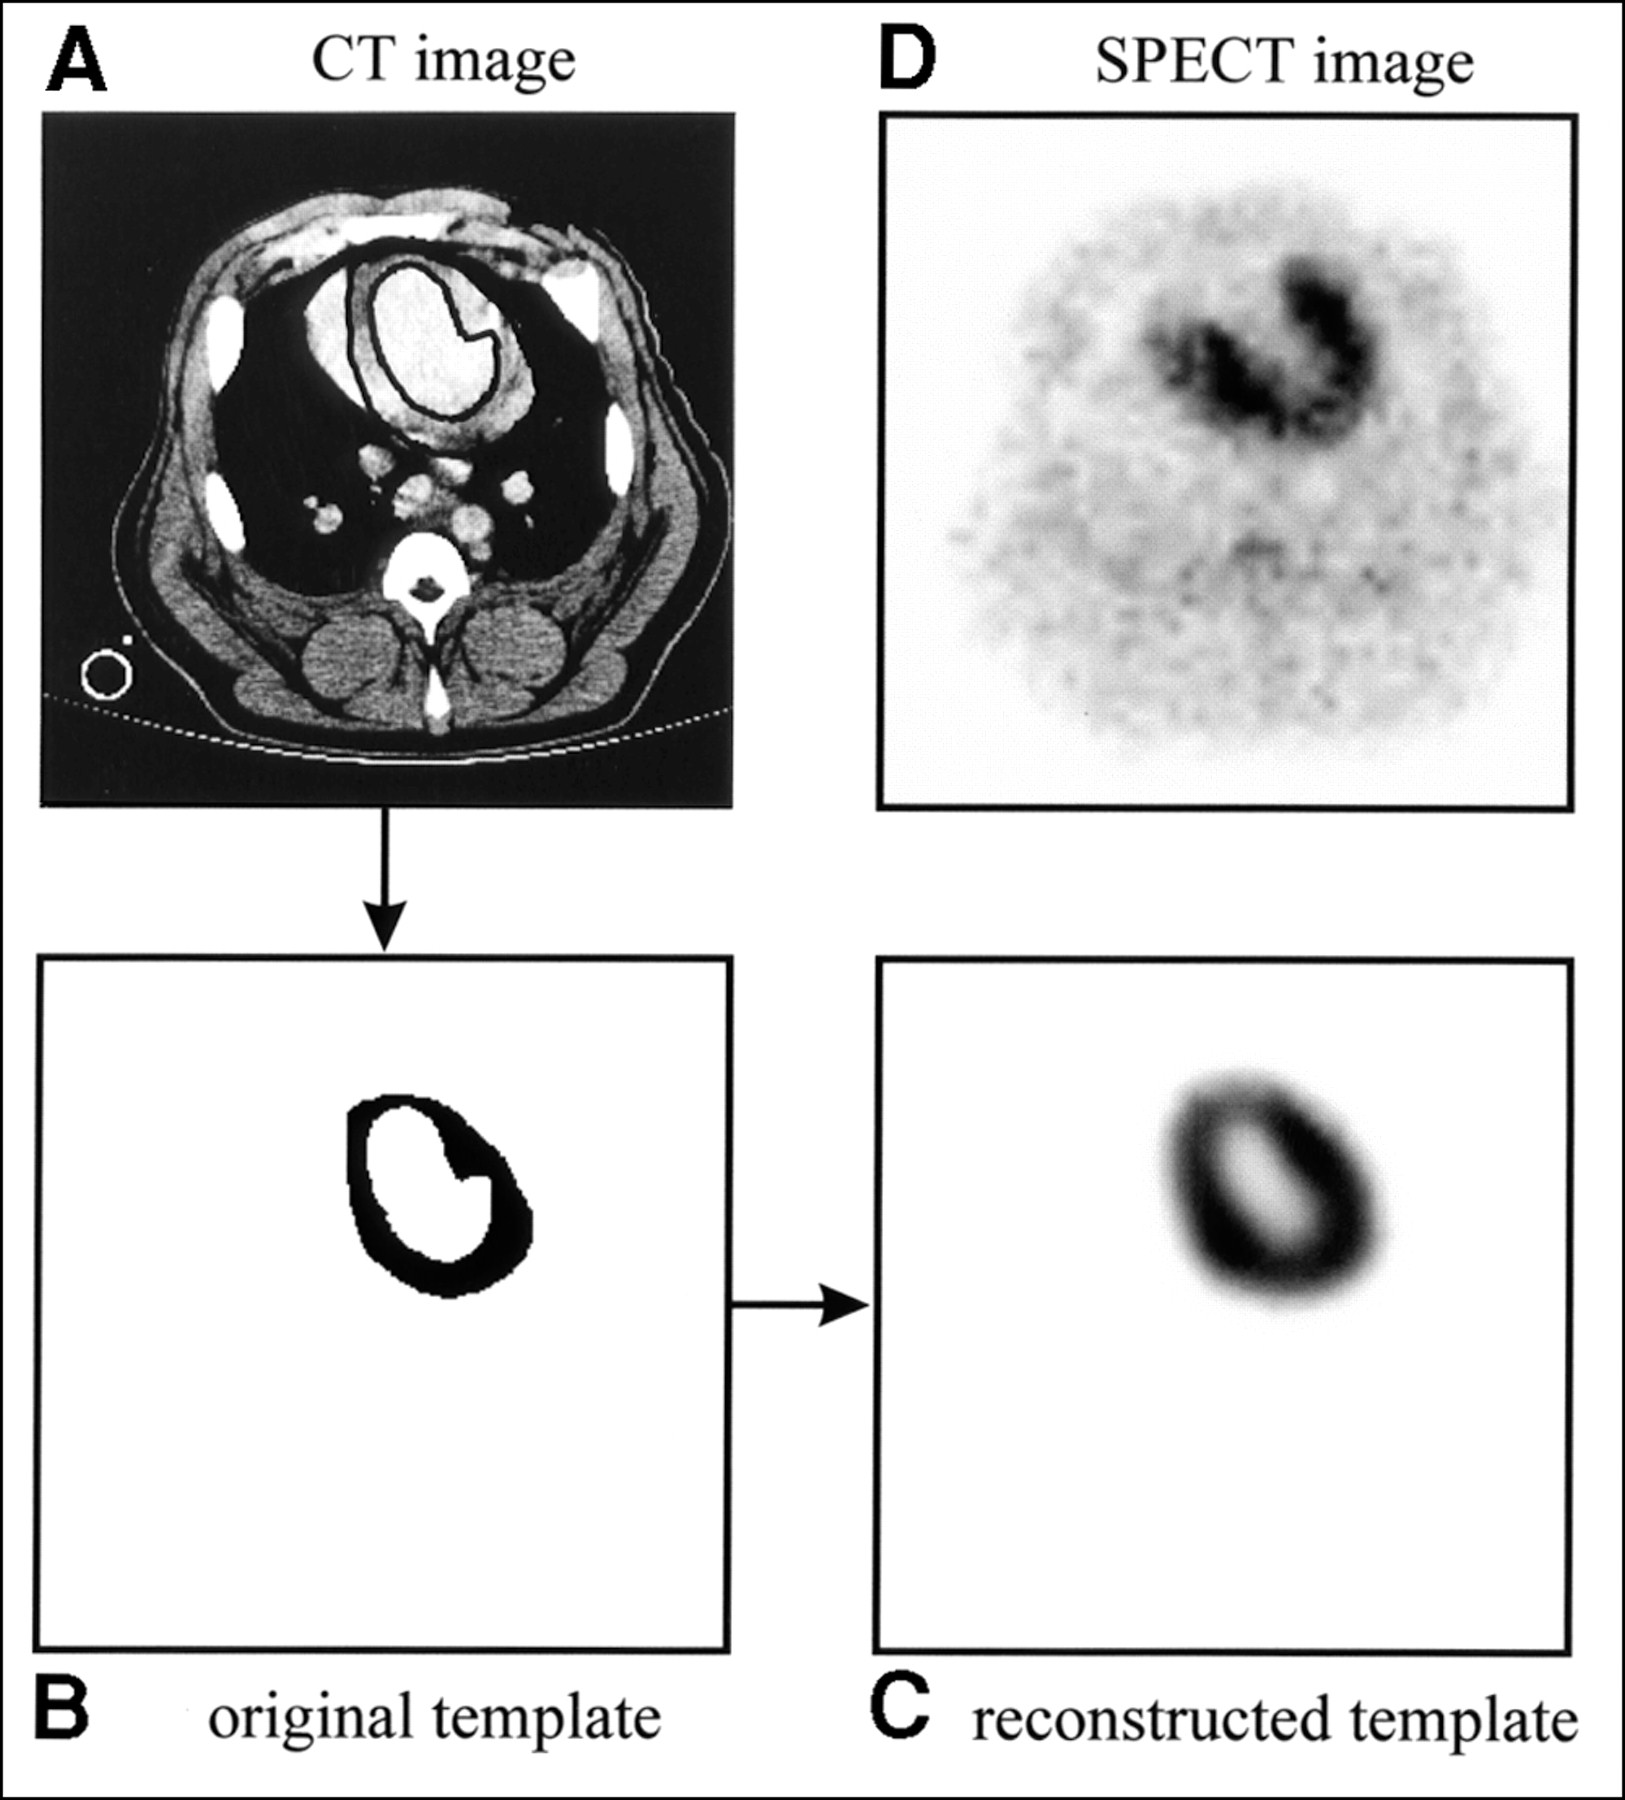
To model the partial-volume effects and other distortions resulting from the imaging process, the high-resolution CT images are used to model a perfectly uniform myocardial distribution of activity that accurately reflects the geometry of the myocardial mass. Because iodinated contrast agent is used during the CT data acquisition, the myocardial wall can be visualized on the CT image. Endocardial and epicardial borders are defined manually on each of the transaxial slices of the CT image (Fig. 2A) to delineate the myocardial volume of interest. All pixels in this volume of interest, or template, are assigned a value of 1 to represent a uniform activity distribution over the geometric extent of the myocardium (Fig. 2B). Then, using a realistic physical model of the SPECT imaging process (including photon attenuation and nonideal collimation), the template is mathematically projected into 128 angular views to simulate the SPECT acquisition. In the projection model, photon attenuation is calculated using the attenuation map created from the correlated CT image (7,16), and nonideal collimation is accounted for using a distance-dependent blurring model for the LEHR collimator (16,22). Finally, the template image is reconstructed (Fig. 2C) with the same iterative MLEM algorithm and attenuation map used to reconstruct the radionuclide image (Fig. 2D). Whereas the original template, defined on the high-resolution CT image, specifies the geometry for the volume of interest on the radionuclide image, the reconstructed template image is effectively a map of correction factors for the volume of interest on the radionuclide image (9). This technique is similar to methods used to correct for partial-volume errors in PET of the brain using registered MR images (23–25).
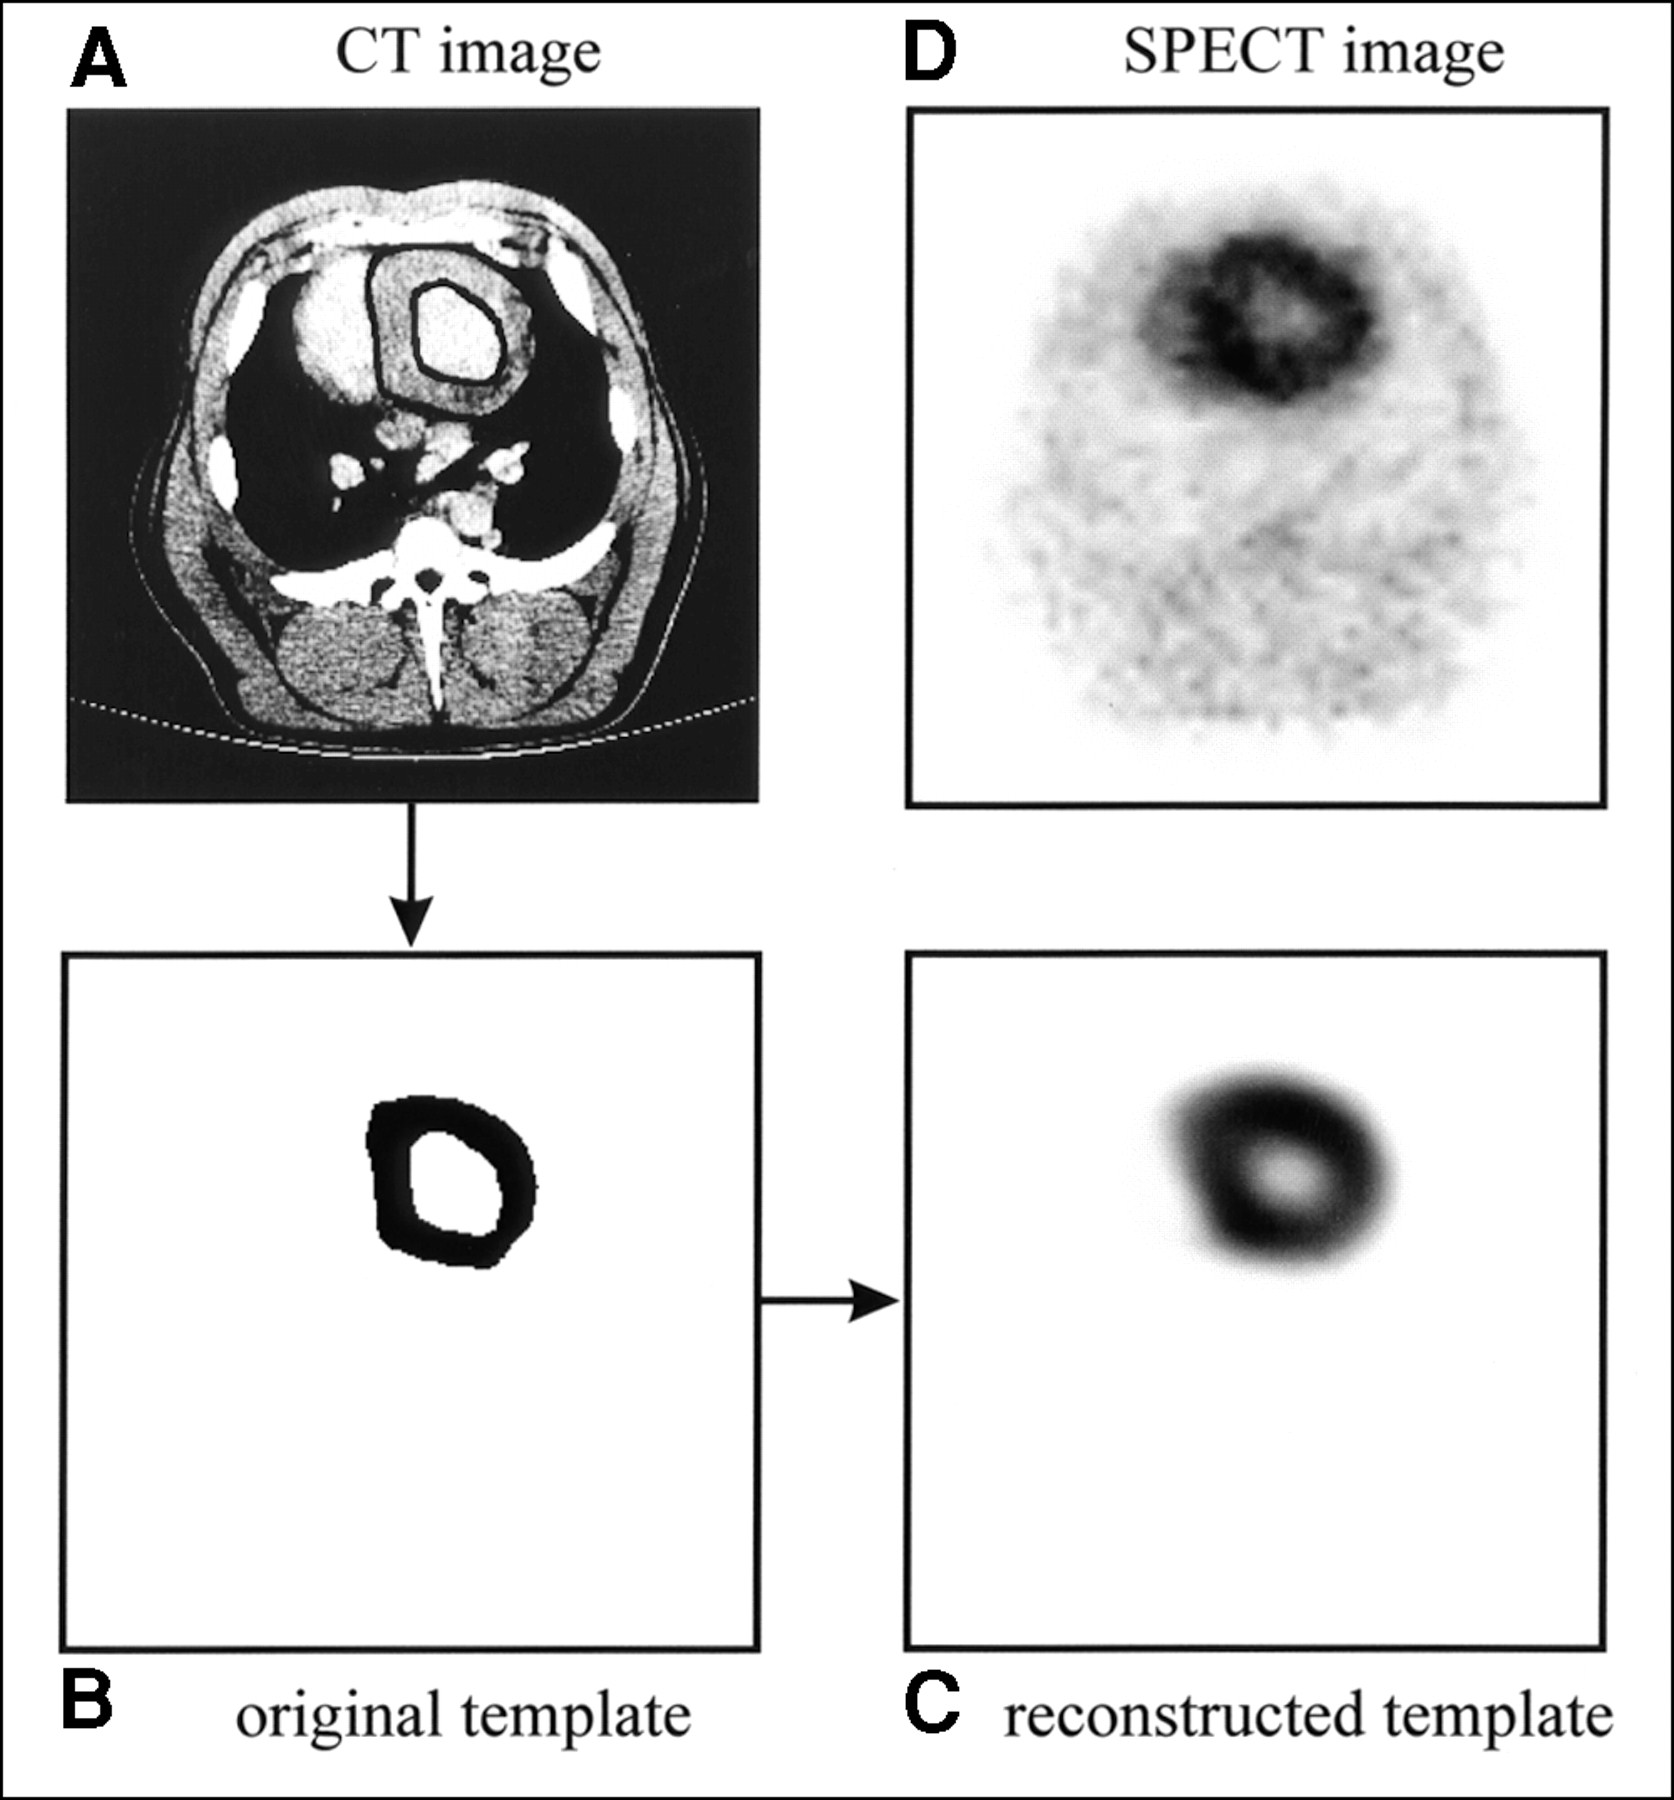
(A) Axial slice from one CT image of normal pig shown with endocardial and epicardial borders drawn. (B) Myocardial region of interest, or template, derived from CT image. Each pixel in template is assigned value of 1 to represent uniform activity concentration distribution over extent of myocardium. (C) Reconstructed template image obtained after mathematically modeling SPECT acquisition process. (D) Corresponding 99mTc-sestamibi image.
After reconstruction, the radionuclide image and the template are reoriented into short-axis slices. Because the original template defines the geometry of the myocardium, it can be used to specify the region of interest to be quantified in the radionuclide image. This can be particularly useful for quantifying ischemic regions, where it can be difficult to identify the myocardium on the radionuclide image alone (Fig. 3). For all of our studies, the relative activity concentration for the myocardium is determined from the mean pixel value within the myocardial volume of interest as defined by the CT-derived template. The mean myocardial pixel value is then scaled by the calibration factor measured with the uniform water phantom described previously to convert to absolute activity concentration. To correct for partial-volume effects, the reconstructed image is divided by the reconstructed template on a pixel-by-pixel basis before quantification. Note that, unlike conventional image correction techniques, the method we describe focuses on quantification of the image rather than improving image quality. To quantify the activity concentration, the reconstructed image is divided by the reconstructed template. However, outside of the region of interest to be quantified (i.e., the myocardial volume), the reconstructed template contains zero-value pixels, which creates discontinuities. Because the activity concentration is determined from the mean pixel value within the myocardial volume of interest, the resulting discontinuities do not affect the quantification process. However, they do prevent one from using this method to produce a radionuclide image that is corrected for partial-volume effects.

(A) Axial slice from one CT image of pig with surgically induced LAD coronary artery occlusion shown with endocardial and epicardial borders drawn. Cross section through ventilation tube is visible in lower left corner of CT image. (B) Myocardial region of interest, or template, derived from CT image. (C) Reconstructed template image obtained after mathematically modeling SPECT acquisition process. (D) Corresponding 99mTc-sestamibi image shows severe anteroseptal perfusion defect.
The in vivo and ex vivo activity measurements were compared by matching the thickness of excised myocardial tissue slices with those of the reconstructed SPECT images. This was done by determining the activity concentration from the average counts within the CT-derived volume of interest averaged over the five tomographic slices of the radionuclide image corresponding to the 1-cm-thick myocardial tissue slice. Then, using the junction of the right ventricle as a reference, the CT-derived volume of interest is divided into four segments corresponding to the septal, anterior, lateral, and inferior walls to quantify the regional activity concentration of each segment to compare with the ex vivo measurement described earlier.
Because the in vivo and ex vivo measurements were obtained at different times, a correction for the changing activity concentration of 99mTc-sestamibi within the myocardium was required. This correction must account for the physical decay of the radionuclide and the biologic washout of the radiopharmaceutical from the myocardium. We assume a monoexponential model for the biologic washout. To determine the biologic half-life (tbiol) of 99mTc-sestamibi in the porcine myocardium, we acquired a series of anterior planar images at specific times over the course of one of the imaging studies. A region of interest was drawn around the myocardium on the planar image and the integral counts within this region of interest were determined for each dataset. Then, by plotting the integral counts (n) within the myocardial region of interest as a function of time (t), we can determine tbiol by fitting the data to:
 Eq. 1
where N0 is a normalization factor and tphys is the physical half-life of 99mTc (i.e., 6 h).
Eq. 1
where N0 is a normalization factor and tphys is the physical half-life of 99mTc (i.e., 6 h).
RESULTS
Biologic Washout of 99mTc-Sestamibi
The biologic washout of 99mTc-sestamibi is illustrated in Figure 4, where the integral counts in the myocardial region of interest for the planar images from one animal are plotted as a function of measurement time. Before the time at which the animal is killed, the myocardial activity concentration decreases more rapidly than the physical decay of the isotope alone, indicating both physical and biologic decay. These data were fit to Equation 1 to obtain a tbiol for 99mTc-sestamibi in porcine myocardium of 355 ± 24 min. This is approximately half of the tbiol of 99mTc-sestamibi in normal human myocardium (680 ± 45 min) (26). After the animal is killed, the myocardial activity concentration decreases with the tphys of 99mTc as indicated in Figure 4. To correct for physical decay and tracer kinetics in all subsequent measurements, we assume both physical decay and biologic washout while the animal is alive (with half-lives of 360 min and 355 min, respectively), but only physical decay after the animal has been killed.
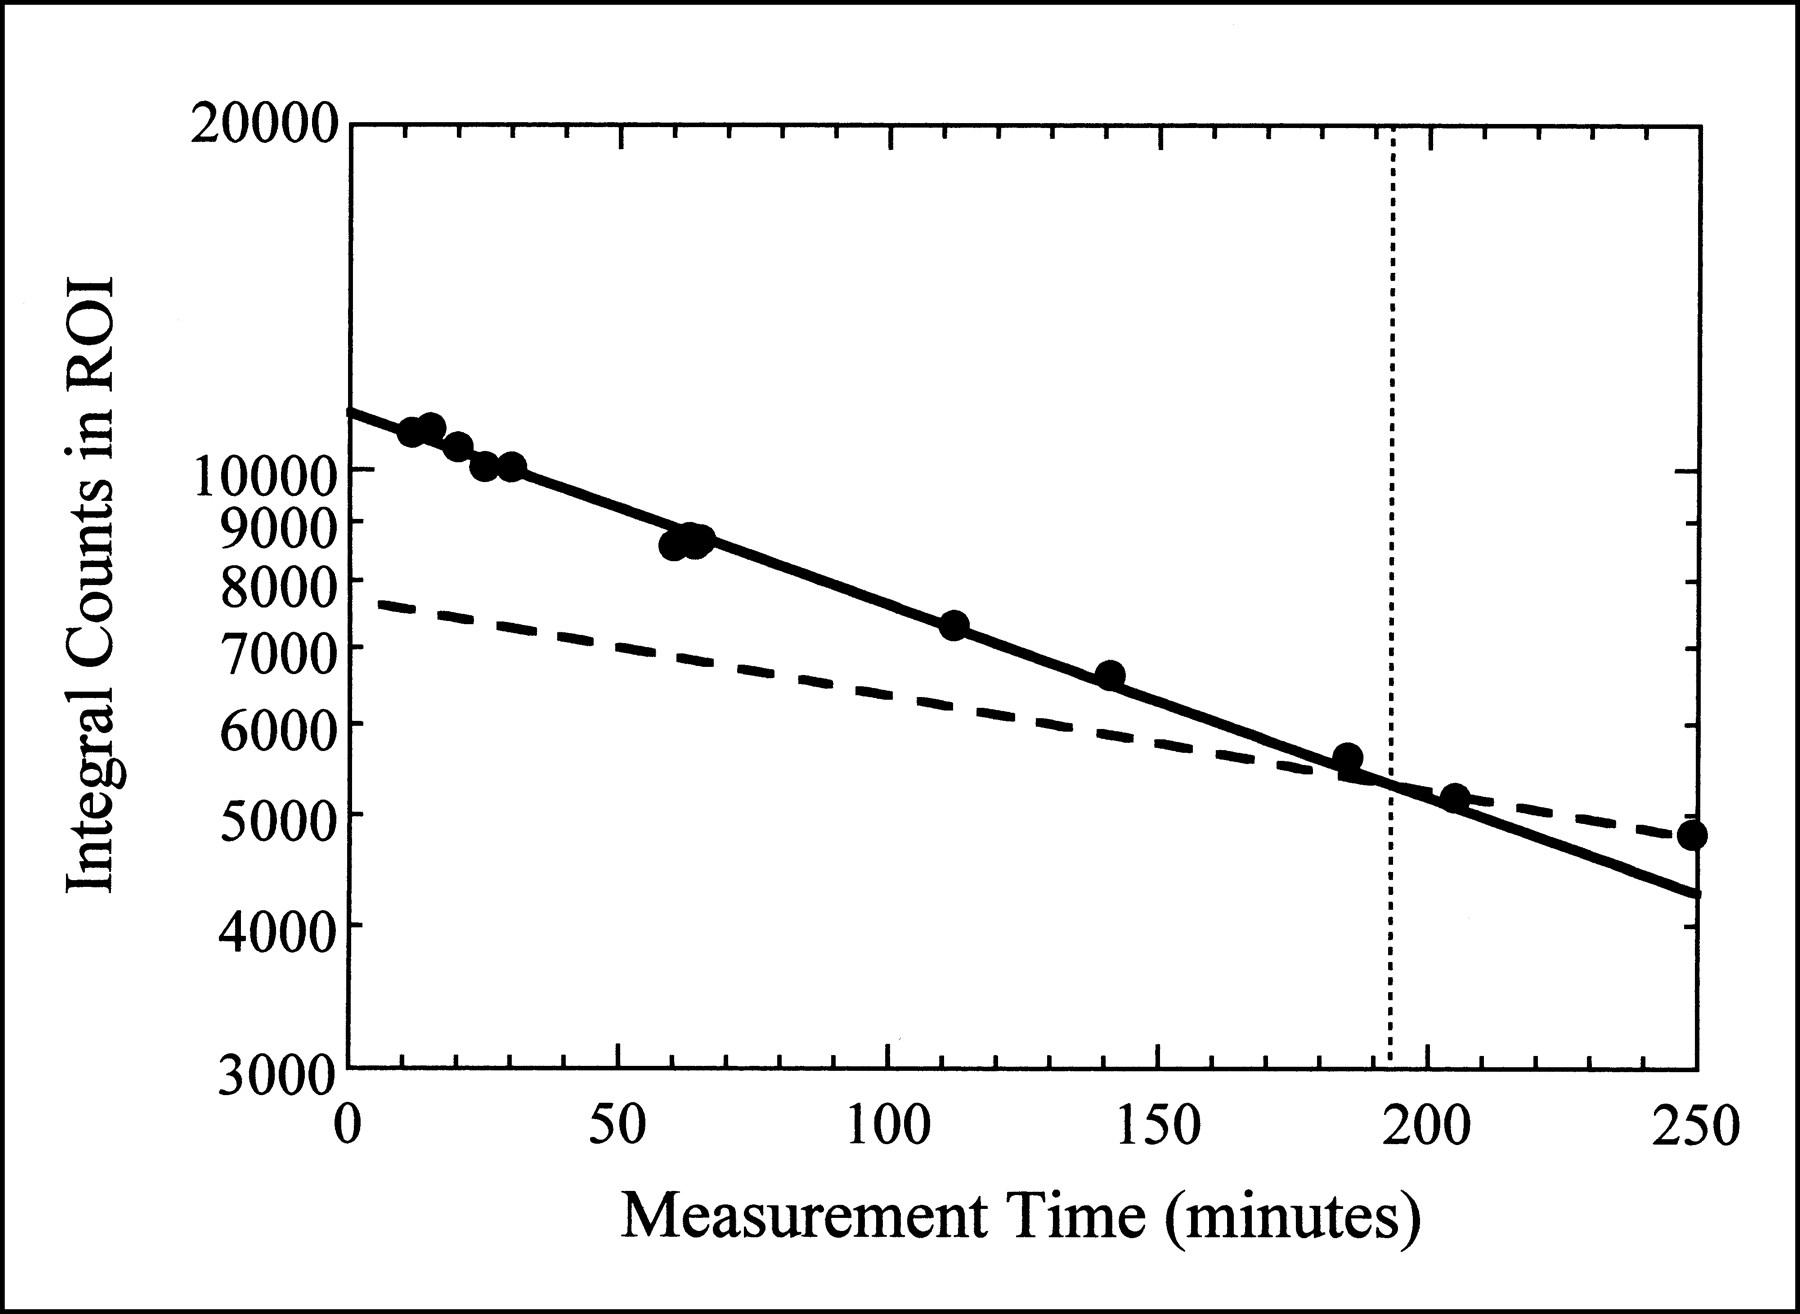
Integral counts in myocardial region of interest (ROI) from planar images obtained at various times throughout imaging study. Dotted vertical line represents time of cardiac arrest. Solid curve is fit to data obtained while animal was alive, assuming both physical decay and biologic washout (Eq. 1). Dashed curve represents physical decay only, expected after animal is dead.
Ex Vivo Quantification
For our control animals (normal myocardial blood flow), the distribution of 99mTc-sestamibi uptake was not uniform throughout the myocardium. As indicated in Figure 5, the biologic variation in the radionuclide uptake in the normal porcine myocardium is significantly larger than the statistical uncertainty of the regional ex vivo measurements.
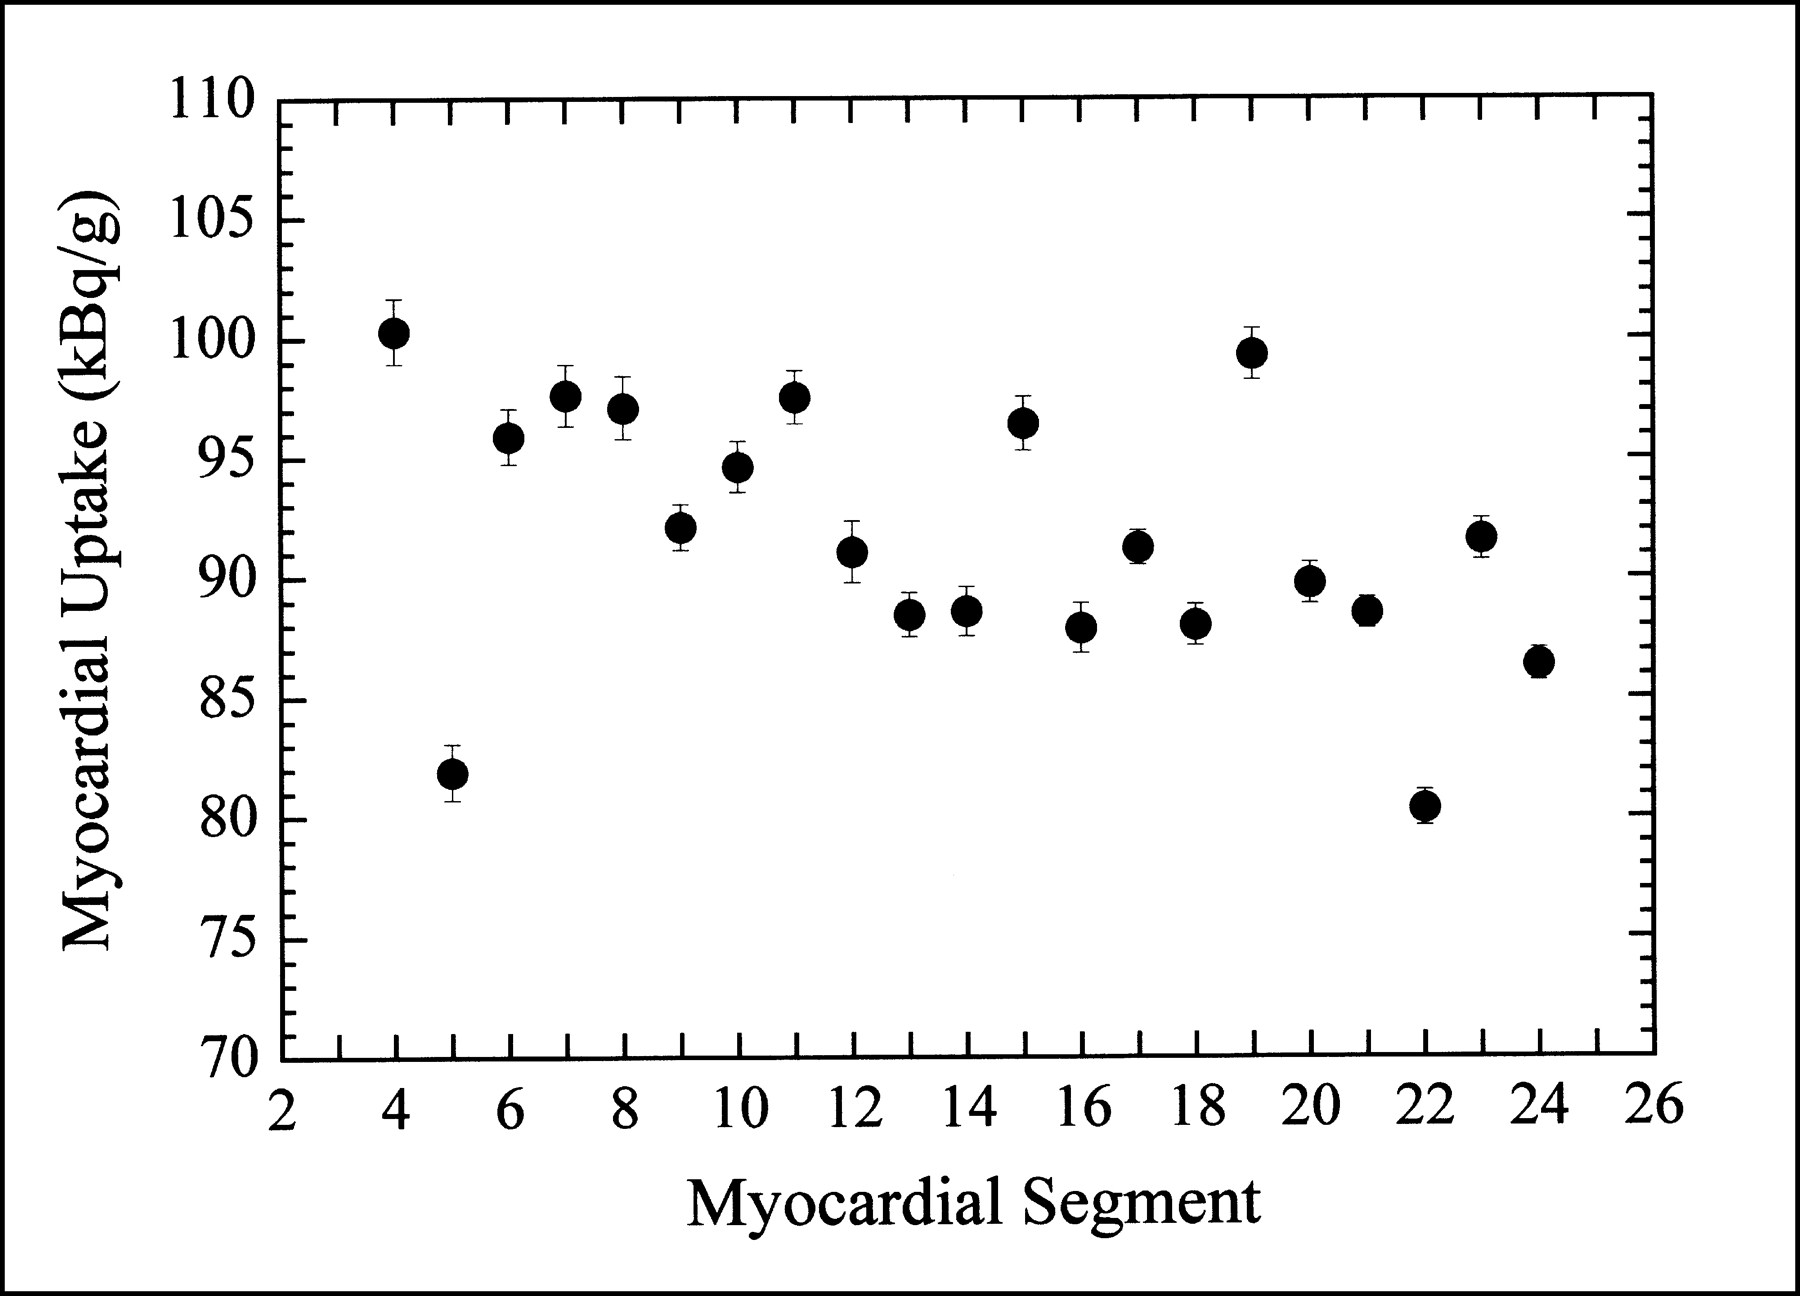
Ex vivo activity concentration measured in each myocardial segment of one control animal (normal myocardial blood flow). Refer to Figure 1 for physical location of myocardial segments.
In Vivo Quantification
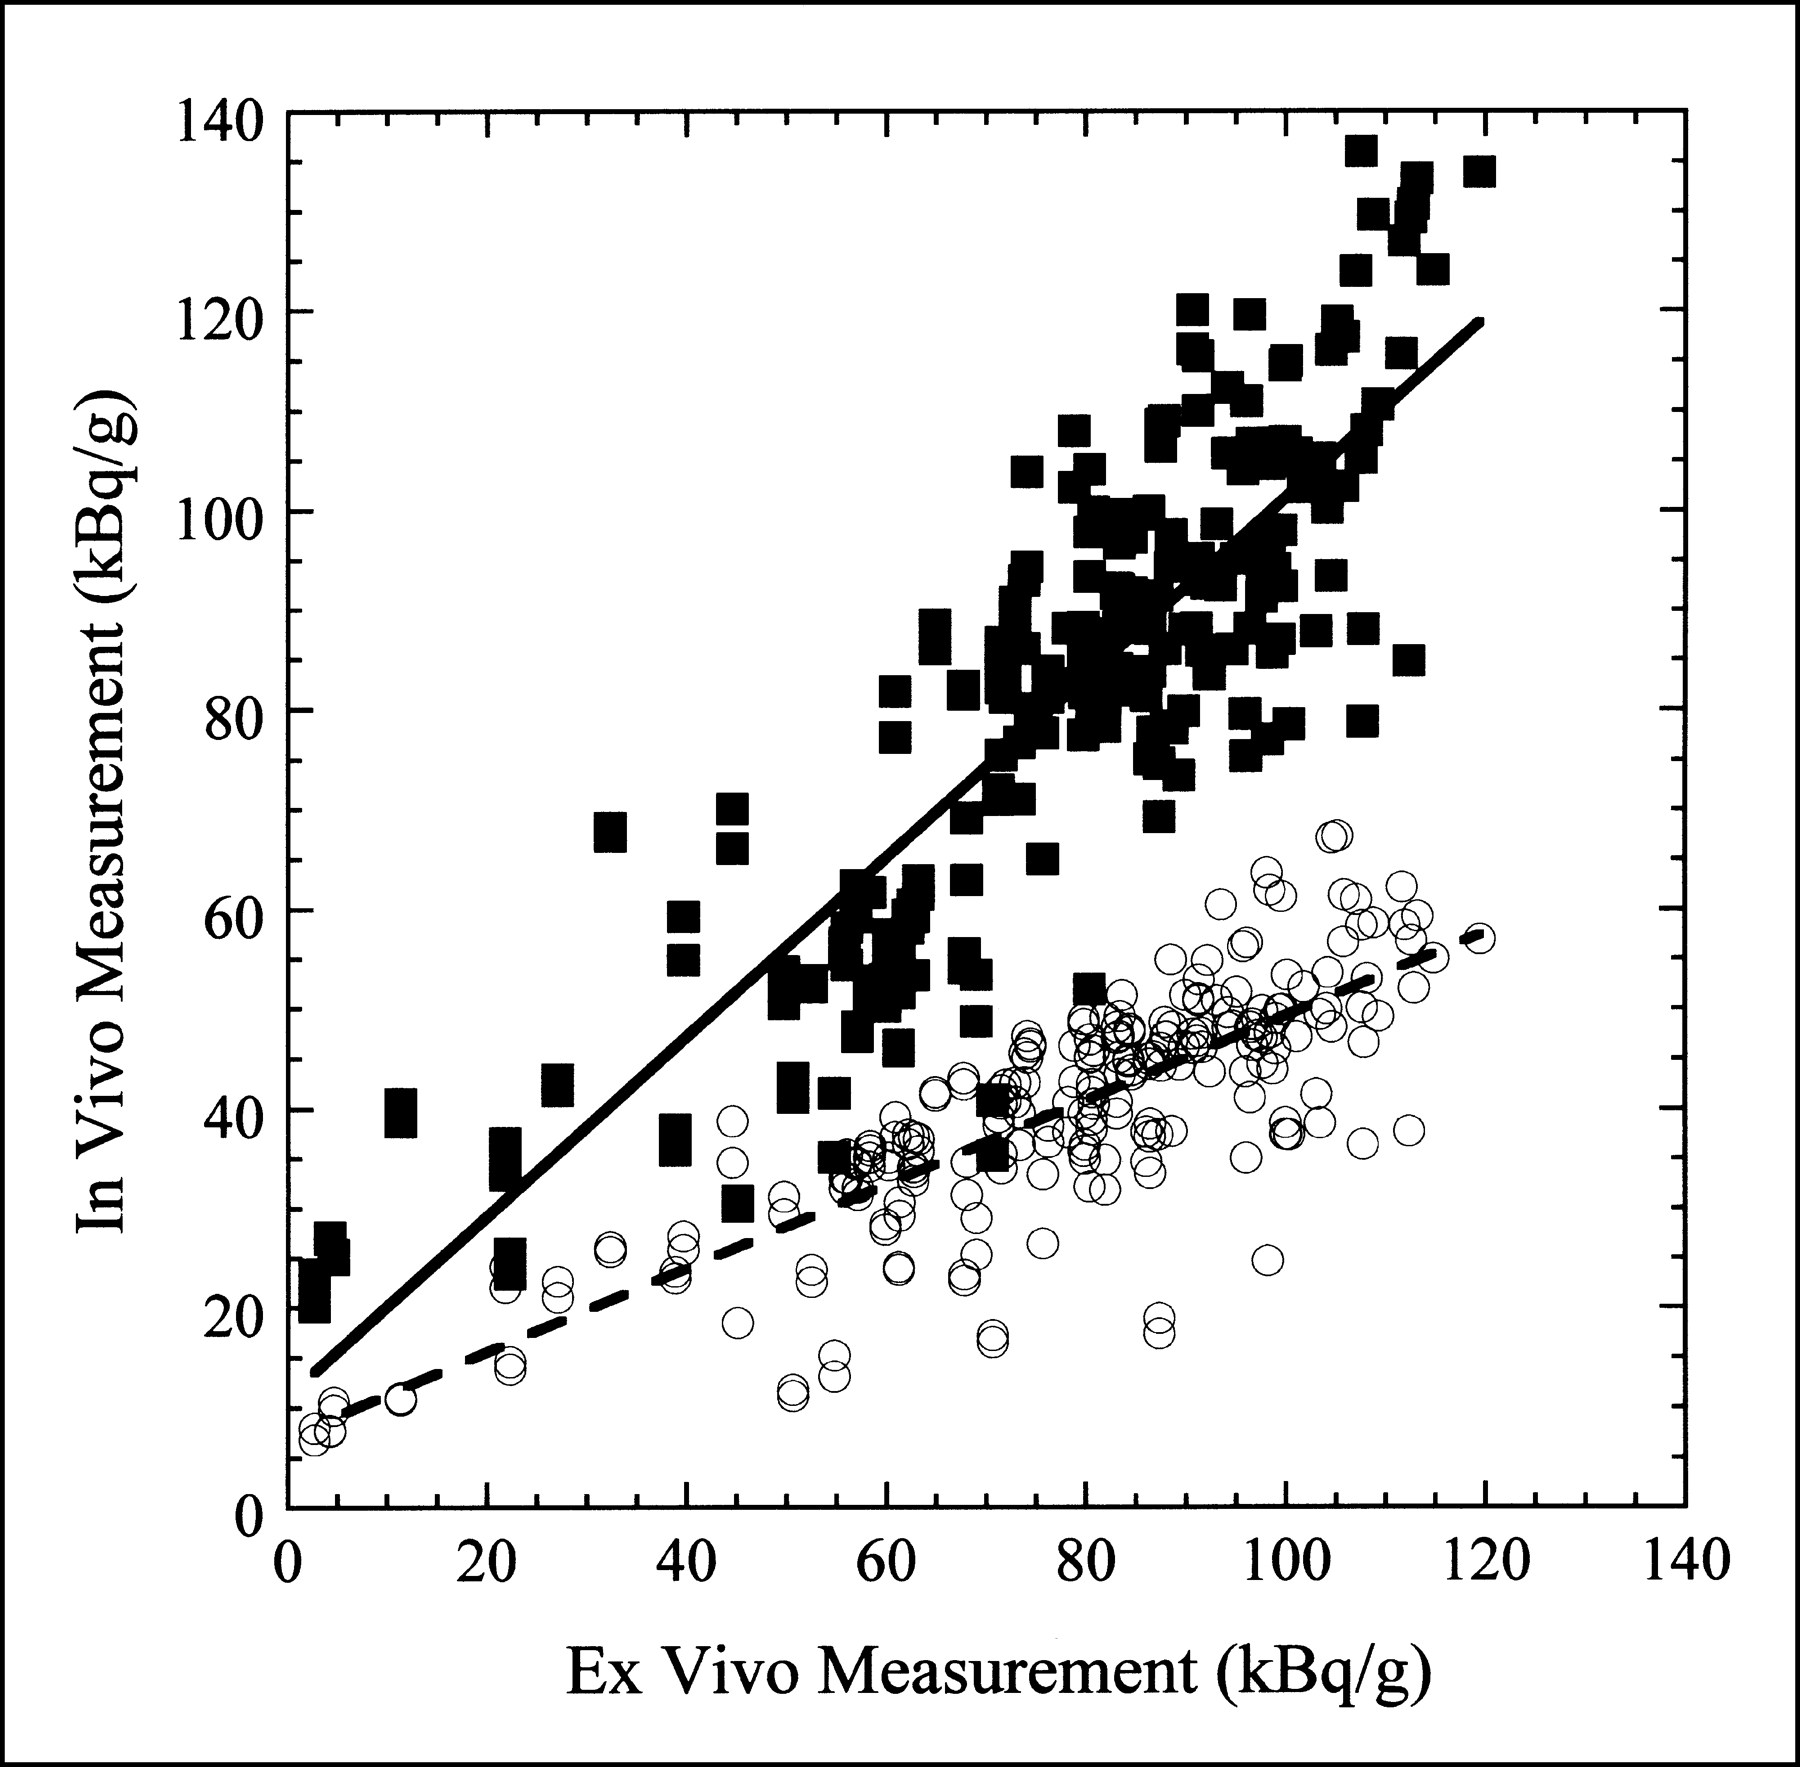
Figure 6 shows a scatter plot of the in vivo measurement obtained with attenuation correction only and with both attenuation and partial-volume corrections versus the ex vivo measurement for all pigs included in this study. Linear fits to these two datasets are also shown in Figure 6. In the ideal case, the data would fall along a line with unit slope and zero offset. For the measurement with attenuation correction only, the slope of the line fit is 0.421, indicating that the in vivo activity concentration is approximately 58% too low. However, with both the attenuation and partial-volume corrections applied, the slope of the line fit is 0.901, indicating that the in vivo activity concentration is within 10% of the true value. In both cases, the small offset in the line fit is most probably caused by scatter and background activity.

In vivo vs. ex vivo activity concentration measurement for eight pigs included in study. ○ = activity concentration measured in every myocardial segment with only attenuation correction applied. Dashed line is least-squares linear fit to data with slope of 0.421 and offset of 7.09 kBq/g (r = 0.821). ▪ = activity concentration measured in every myocardial segment with both attenuation and partial-volume corrections applied. Solid line is least-squares linear fit to data with slope of 0.901 and offset of 11.17 kBq/g (r = 0.863).
Although not shown in Figure 6, the in vivo activity concentration was also determined for some animals from images reconstructed with an iterative MLEM algorithm that included attenuation compensation and a distance-dependent blurring model (16,22) for the LEHR collimator used for the data acquisition. Using this approach, the quantitative accuracy was better than with attenuation correction alone, but the true activity concentration was still underestimated by approximately 35%.
DISCUSSION
Quantification of myocardial perfusion studies can improve reproducibility, reduce interobserver variability, and lead to more standardized, objective reports. Current quantification techniques used in myocardial perfusion studies provide only relative tracer activity within myocardial regions defined by an individual SPECT acquisition. Absolute quantification (i.e., determining the absolute tracer activity in becquerels per gram of tissue) could provide significant advantages over these relative measurements because it would allow patients to serve as their own controls. Absolute quantification provides the ability to compare two SPECT scans under different conditions (e.g., stress and rest) or at different times (response to therapy) and to quantitatively determine the change in tracer uptake. Unfortunately, achieving absolute quantification is a difficult task because of effects such as photon attenuation, partial-volume errors, and scatter radiation. Nonetheless, the technique we describe appears to overcome these difficulties.
Variations in intensity on the reconstructed template image (Fig. 2C) are caused by resolution effects. Furthermore, the reconstructed image appears to be somewhat distorted because of the interplay between the spatially variant attenuation characteristics and the distance dependence of the collimator resolution. It is clear from these images that a simple three-dimensional blurring of the original template will not reproduce the reconstructed template image. This suggests that these effects cannot be accurately corrected for with a deconvolution technique using the point-spread function measured at the isocenter. However, the template correction technique corrects for the partial-volume effects and the distortions resulting from the imaging process during the course of quantification. For comparison, other attempts were made to compensate for the limited spatial resolution of the SPECT system, including modeling the intrinsic spatial resolution and depth-dependent collimator response in the reconstruction of the radionuclide image (16,22). Although this method does improve the quantitative accuracy and image quality, it cannot fully recover the activity concentration because of resolution losses.
Slight distortions occur in the imaging and reconstruction process because of the interplay between the distance-dependent collimator blur and the spatially variant attenuation effects. Because the reconstructed template is also subject to these distortion effects, it may be more appropriate to use a thresholded version of the reconstructed template to define the volume of interest to be quantified as opposed to the original template defined by the CT image. However, quantitatively, the results obtained using the template correction technique were relatively insensitive to which template (i.e., the original CT-defined template or the reconstructed template) was used to define the regions of interest.
Finally, an iterative MLEM reconstruction algorithm was chosen simply so that we could compare the results of including attenuation correction alone directly with the results obtained by including attenuation and partial-volume corrections. Because the template correction technique models the physical effects of the image acquisition process, it is not necessary to use an iterative reconstruction algorithm. In fact, similar quantitative results were obtained using filtered backprojection to reconstruct the radionuclide and template images, which significantly reduced computation time. For this quantification technique, the particular choice of reconstruction algorithm itself is relatively unimportant, provided that the same algorithm is used to reconstruct both the radionuclide and the template images.
A potential limitation of our analysis is that we do not explicitly account for scatter radiation. However, because the calibration factor was determined from a water phantom measurement that contains scatter, some of the effects of scatter radiation are accounted for indirectly. To ensure that we were not overlooking a potential problem, we did acquire some datasets with secondary energy windows and analyzed these datasets with two of the scatter correction techniques described in the literature (27,28). The results obtained with these scatter correction methods were quantitatively comparable with the results obtained without an explicit scatter correction. This was not entirely unexpected because simulation studies performed by our group suggest that, for the pig anatomy, large regional variations caused by scatter from hepatic activity are not expected across the myocardium (29). Therefore, by including the effects of scatter only indirectly (i.e., by using the water tank calibration factor) we are still able to determine the regional myocardial activity concentration relatively accurately.
A second potential limitation of our analysis is that we do not account for cardiac and respiratory motions. Although gated acquisitions could be used in conjunction with the methodology we present to account for motion, we have tried to assess both cardiac and respiratory motion effects.
To assess cardiac motion effects, we performed one gated SPECT study; unfortunately, we are unable to do gated CT imaging with our system. In the gated SPECT study, the values obtained at diastole were approximately 15% different than those obtained at systole, with the values obtained by including data for the entire cardiac cycle falling midway in-between. Because the CT image is ungated, we do introduce a motion blur into the template process. Comparison of the CT image acquired while the animal is alive with a comparable CT image acquired after the animal has been killed, we see that the myocardial wall, as defined by CT, is generally thicker when the animal is alive because of motion blur. Effectively, the point-spread function of the system is increased because of the motion effects.
To assess respiratory motion (in the absence of cardiac motion) we also performed one imaging study in which the animal was mechanically ventilated after it had been killed. The animal was also imaged without being ventilated, and the values obtained in the two cases varied, on average, by about 10%.
Both of these studies seem to suggest that cardiac and respiratory motion effects lead to quantitative errors on the order of 10%. Nevertheless, motion effects do not appear to be the dominant source of remaining error. For the animal studies reported here, we also acquired CT and SPECT images after the animal had been killed to allow evaluation of our methods without the added complications of cardiac and respiratory motion. Even in these cases, we obtained results that were quantitatively similar to those obtained with animals that were alive: SPECT quantification of the absolute activity concentration within about 10%–15% of the true values, as shown in Figure 7. This suggests that motion effects may not be the dominant limitation of this methodology.

SPECT quantification obtained from postmortem images vs. ex vivo activity concentration for eight pigs included in study. ○ = activity concentration measured in every myocardial segment with only attenuation correction applied. Dashed line is least-squares linear fit to data with slope of 0.402 and offset of 7.53 kBq/g (r = 0.776). ▪ = activity concentration measured in every myocardial segment with both attenuation and partial-volume corrections applied. Solid line is least-squares linear fit to data with slope of 0.877 and offset of 16.72 kBq/g (r = 0.876).
We have shown that absolute regional quantification is possible in a porcine model of myocardial perfusion; further work will be necessary to indicate the clinical usefulness of such a measurement. One obvious direction is to determine how this information could be used to ascertain coronary artery flow reserve capacity.
CONCLUSION
Absolute rather than relative quantification of myocardial perfusion studies would be a significant advance (3). We describe a new technique for quantifying myocardial SPECT images that accounts for attenuation and partial-volume errors using coregistered CT images. The CT image provides both an object-specific attenuation map for SPECT reconstruction and an anatomic template to define regions of interest for quantification of the SPECT image. The effectiveness of this technique has been shown in animal experiments in which we have been able to measure the absolute regional radionuclide content in porcine myocardium in vivo.
Acknowledgments
The authors acknowledge the expertise in animal care and handling provided by Carol Stillson and the surgical skill provided by Dr. Dong Wei Gao. This work is supported in part by National Institutes of Health grant 2R01-CA50539-09, the American Heart Association, and U.S. Army Breast Cancer Research Program Postdoctoral Fellowship DAMD17-98-1-8192. The authors also acknowledge a significant equipment grant from General Electric Medical Systems.
Footnotes
Received Apr. 27, 2000; revision accepted Sep. 14, 2000.
For correspondence or reprints contact: Bruce H. Hasegawa, PhD, Physics Research Laboratory, University of California at San Francisco, 389 Oyster Point Blvd., Ste. 1, South San Francisco, CA 94080.
REFERENCES
In this issue


Jump to section
Related Articles
Cited By...
- Flow-Dependent Uptake of 123I-CMICE-013, a Novel SPECT Perfusion Agent, Compared with Standard Tracers
- Dynamic SPECT Measurement of Absolute Myocardial Blood Flow in a Porcine Model
- New Approach to Quantification of Molecularly Targeted Radiotracer Uptake from Hybrid Cardiac SPECT/CT: Methodology and Validation
- An Evidence-Based Review of Quantitative SPECT Imaging and Potential Clinical Applications
- MIRD Pamphlet No. 23: Quantitative SPECT for Patient-Specific 3-Dimensional Dosimetry in Internal Radionuclide Therapy
- Myocardial SPECT Images for Diagnosis of Pulmonary Hypertension and Right Ventricular Hypertrophy
- Quantitative Accuracy of Clinical 99mTc SPECT/CT Using Ordered-Subset Expectation Maximization with 3-Dimensional Resolution Recovery, Attenuation, and Scatter Correction
- SPECT/CT
- The Road to Quantitation of Regional Myocardial Uptake of Tracer