


Abstract
Myocardial perfusion SPECT imaging accounts for well over 90% of all myocardial perfusion imaging performed in the United States today. Although clearly superior to the traditional planar technique in terms of image contrast and consequent diagnostic and prognostic yield, the SPECT approach also involves additional acquisition and processing steps. This article concisely describes the entire technical sequence of myocardial SPECT imaging, from the acquisition of projection images to their filtration and tomographic reconstruction and concluding with reorientation of the tomographic transaxial images. A simplified explanation of the frequency, or Fourier, domain and the operation of digital filters is also presented to help the reader intuitively understand these important concepts.
The term SPECT, an acronym for single-photon emission computed tomography, in recent years has come to encompass concepts not present in its original meaning. For instance, both single-photon and positron emitters are routinely used with SPECT imaging, and both emission and transmission images may be acquired, especially for attenuation correction. The word tomography, however, remains key to understanding the foundation on which the SPECT technique is based. Tomography is a word composed of the Greek words τομεο, “to cut,” and γραφος, “to write or display”; in essence, it represents a means of displaying cuts, or sections, of the human body. The result of tomographic image reconstruction is 2-dimensional images that are perpendicular to the long axis of the human body, with each of these images corresponding to a specific and, for our purposes, 2-dimensional slice of the body. This article presents a structured and comprehensive description of the technical aspects of myocardial SPECT imaging.
IMAGE ACQUISITION AND RECONSTRUCTION
Projection Images
The projection image, the most basic building block in the SPECT world, consists of a 2-dimensional snapshot of the 3-dimensional distribution of radioactivity in an underlying patient and is obtained by positioning a scintillation detector with its plane parallel to the patient’s long axis. The scintillation detector is made of high-density material such as thallium-activated sodium iodide; when radiation penetrates the detector, energy is dissipated by conversion into light photons, which are in turn converted into electrons and amplified into an electric current by a set of photomultiplier tubes directly coupled to the scintillating crystal. The amount of energy dissipated in the detector is proportional to the energy of the incoming radiation, and the point of impact is derived by analysis of the fraction of light photons collected by different photomultiplier tubes (1).
Projection, or planar, imaging formerly represented the standard way to perform nuclear cardiac studies but today accounts for <10% of all those studies in the United States. The major reason for the decline is that projection images (which, it is useful to stress again, are generally parallel to the long axis of the patient’s body) compress an intrinsically 3-dimensional distribution of radioactivity into a 2-dimensional image. As a result, radioactivity above and below the heart contributes confounding background counts to the image and tends to reduce perfusion defect contrast, or the ability to discriminate between areas of the myocardium with normal and abnormal count levels.
Tomographic Reconstruction
SPECT imaging is based on the reconstruction of tomographic images from projection images, a concept pioneered by Bracewell and Riddle (2) for astronomic applications in 1967 and extended to medical imaging by Shepp and Logan (3) a few years later. In essence, tomographic reconstruction theory postulates that a 3-dimensional image volume can be reconstituted from a series of 2-dimensional images acquired at a sufficient number of positions around the object being imaged, generally along an arc spanning at least 180°. Let me illustrate how the concept applies to nuclear imaging. For the sake of simplicity, we can reduce our problem to the reconstruction of a 2-dimensional image from a series of 1-dimensional profiles. As Figure 1 shows, in nuclear cardiology the object of interest could be a cylindric patient whose long axis is perpendicular to the page you are reading, with projection images (also perpendicular to this page) generated by a rotating detector. The patient’s section in the plane of the page is a circle, and that of the detector, a line. Let us further assume that a point source of radioactivity is located at the center of the circle and creates spikes in the count activity profiles (scan profiles) seen by the detector as it rotates around the patient. We can use the information contained in the profiles to reconstruct a tomographic image of the patient’s section; however, the spike in each profile indicates only that there was activity underneath the detector at that particular location; the spike does not tell us at what depth within the circle the activity was located. Therefore, assumptions must be made. In standard backprojection (linear superimposition of backprojections), the counts in each profile are assumed to correspond to uniformly distributed activity perpendicular to the profile and are therefore uniformly smeared back onto the tomographic image matrix. As a result, the original point source is recreated where the backprojection rays overlap, but there is clear loss of resolution and contrast, and there is generation of the characteristic star artifact. In filtered backprojection (linear superimposition of filtered backprojections), each profile is filtered with an oscillating function (comprising positive and negative values) before backprojection so as to create bands of negative pixels that eliminate the star artifact and recover image contrast and resolution. If enough profiles are collected, the star artifact can essentially be eliminated and a faithful reconstruction of the patient’s section generated.

Tomographic reconstruction of point source (A) by linear superimposition of backprojections (LSBP) (B) and linear superimposition of filtered backprojections (LSFBP) (C and D). v = frequency. (Modified from and reprinted with permission of (27).)
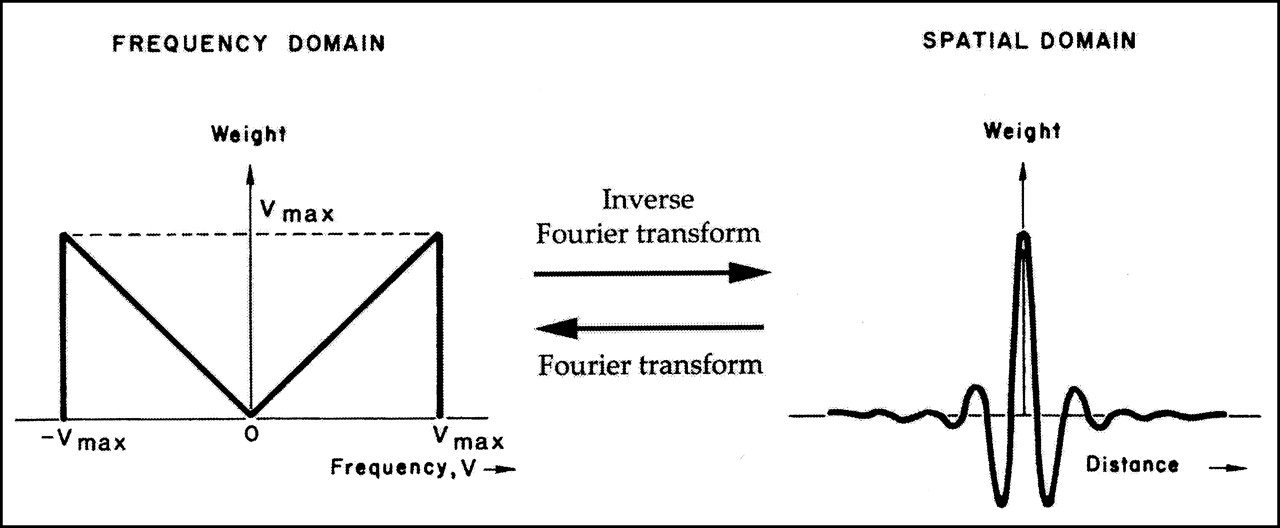
The oscillating function used in Figure 1 is also called a ramp filter because it looks like a ramp in the frequency domain (Fig. 2); as we shall see, filters are usually described in terms of their shape (also called transfer function) in the frequency domain. The reason the Fourier transform and the frequency domain are so extensively used in image processing is that filtering would require the relatively complex operation of convolution of 2 functions in the physical space, as opposed to the simple multiplication of their Fourier transforms in the frequency domain (4). As an added bonus, the graphic representation of a filter in the frequency domain is simple and intuitive.

Ramp filter in frequency domain (left) and corresponding spatial domain filter (right). Ramp filter is Fourier transform of spatial domain filter, which in turn is inverse Fourier transform of ramp filter. (Modified from and reprinted with permission of (27).)
Iterative Reconstruction
Filtered backprojection, although not the only reconstruction method in nuclear cardiology, is by far the most widely used. Algebraic reconstruction techniques also use the projection images as input but aim at finding the exact mathematic solution to the problem of activity distribution in the field of view by considering the value in each pixel of the reconstructed image as an unknown and each point in a profile as an equation. The basic concept of algebraic reconstruction techniques is shown in Figure 3, which again makes reference to a simple 2-dimensional activity distribution and 2 representative, discrete profiles. In this simplified case, it is apparent that if the sum (Σ) of the 2 lower row pixels is 0, and if all pixels have positive or 0 value (by definition, because they represent activity levels), then those 2 lower row pixels must have a value of 0. Likewise, if the sum of the 2 left-column pixels is 5 and we already know that the lower pixel is 0, the upper pixel must be 5. Although an exact mathematic solution to tomographic reconstruction is desirable and, when matrix dimensions are very small, is indeed possible, nuclear cardiology images are at least 64 × 64 pixels in size, so an approximated, iterative approach is used instead. In brief, the value of all pixels is initially guessed using filtered backprojection; then, those initial values are slightly altered several times (iterations) until they converge to a final result consistent with the available count profiles.
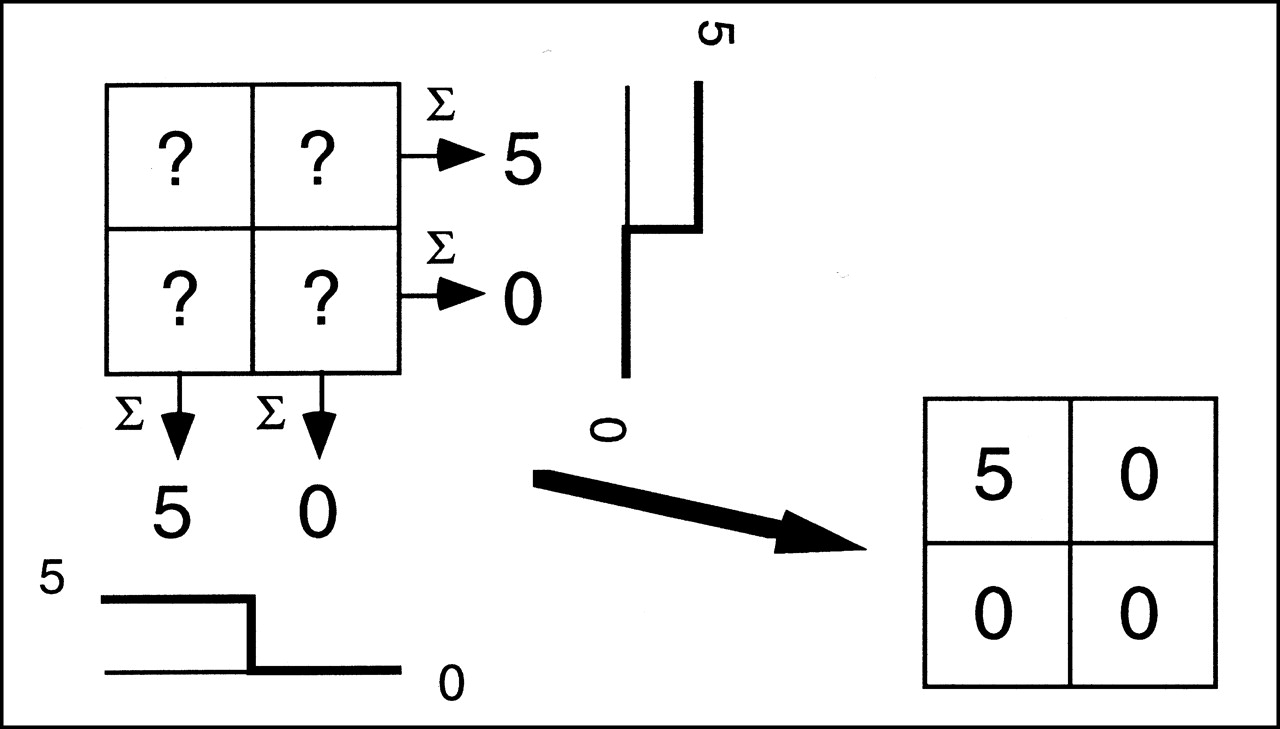
Tomographic image matrix can be mathematically “reconstructed” from discrete number of profiles.
Iterative reconstruction is intrinsically slower than filtered backprojection, and the optimal number of iterations needed remains a matter of debate. That notwithstanding, a clear advantage of the iterative reconstruction technique is the potential reduction of reconstruction artifacts caused by hepatic or other extracardiac activity (5) and the ease of incorporating attenuation correction and other compensations into the reconstruction process.
Issues in Acquisition of Projection Images
Whether filtered backprojection or iterative reconstruction is used, a large enough number of projection images must be acquired to adequately sample the field of view of the camera. In nuclear cardiology, it is generally accepted that adequate angular sampling can be achieved by collecting at least 30 uniformly spaced projection images over a 180° arc (1 projection every 6°). The rationale for acquiring only 180° worth of data (usually from 45° right anterior oblique to left posterior oblique) is that myocardial counts in the remaining projections are overwhelmingly attenuated or scattered by the patient’s body and consequently do not contribute much additional information to the images. Thus, 180° SPECT acquisition is generally preferred for both 201Tl and 99mTc protocols because of the higher contrast and resolution of the reconstructed images (6,7) and greater patient throughput, although the use of 360° acquisition has been advocated on the basis of its superior image uniformity and greater immunity to artifacts (8,9).
There is little consensus on the type of orbit around the patient that the camera detectors should describe while collecting projection images (some options include circular, elliptic, and patient-contoured orbits). Although circular orbits have historically been preferred, noncircular orbits have proliferated in conjunction with attenuation correction protocols. The rationale for the use of noncircular orbits is that, if a rotating detector follows the patient’s contour, the distance between collimator and heart is minimized and, consequently, the best possible image resolution and uniformity are obtained at each projection (10). On the other hand, some investigators have pointed out that artifacts may be caused by combining projection images with such different resolution characteristics in the reconstruction process (11), leading to the need for depth-dependent collimator response correction (12).
The number of multidetector nuclear medicine cameras has markedly increased over the past decade (Fig. 4). Specifically, double-detector cameras with the detectors arranged in a 90° configuration are today the most popular for cardiac use because they can acquire a study containing a given number of counts in half the time needed by a single-detector camera. Table 1 compares single- and multidetector cameras with respect to the duration of 180° and 360° SPECT acquisitions.
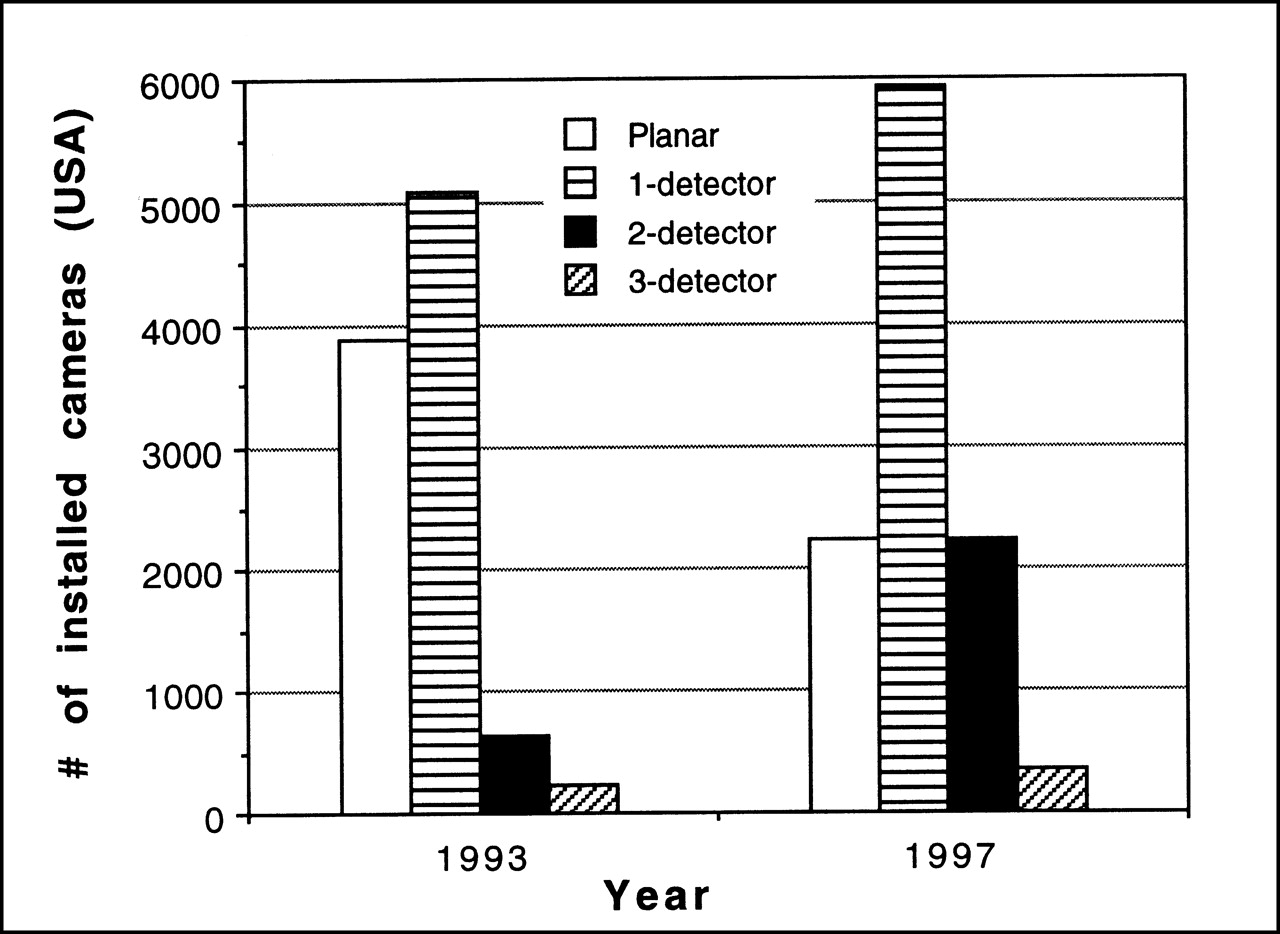
Growth of installed planar and SPECT cameras (latter category is broken down by number of detectors) in United States from 1993 to 1997.
SPECT Acquisition Duration
IMAGE FILTERING
Frequency Domain
As we have seen in Figure 2, the same filter function can look dramatically different when visualized in the standard spatial domain as opposed to the frequency domain. In a mathematic sense, however, the 2 representations are equivalent, because mathematic operators exist that allow us to go from the space to the frequency domain and vice versa. These operators are the Fourier transform and the inverse Fourier transform. As previously stated, the reason that the frequency domain is so extensively used in image processing is because filtering a function with another function requires the relatively complex operation of convolution of the 2 functions in the physical space, as opposed to the simple multiplication of their Fourier transforms in the frequency domain (4).
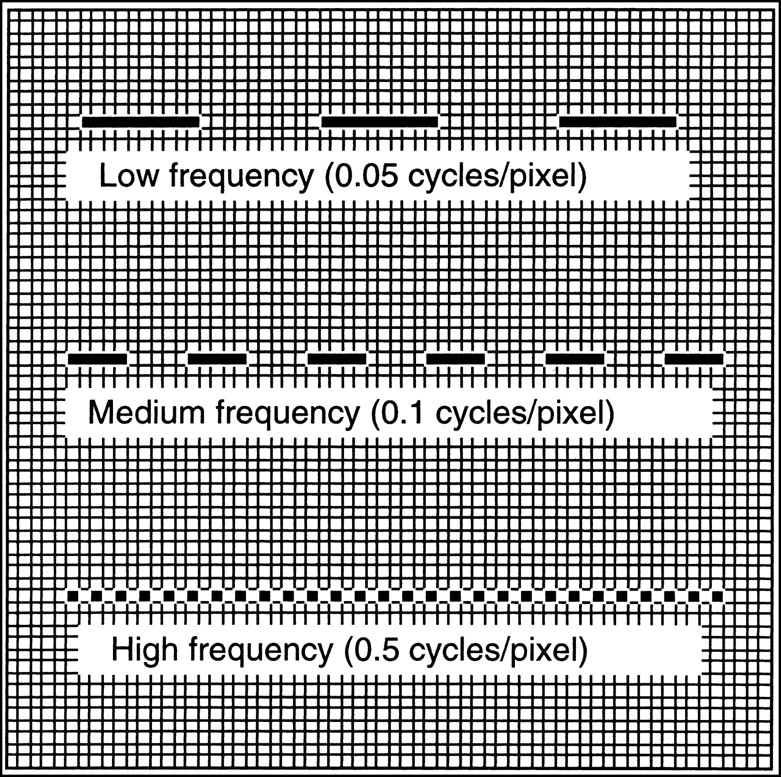
The often misunderstood concept of frequency domain is easier to appreciate if one thinks of it as a different way to express size and distance relationships between physical objects in an image. In Figure 5, 3 rectangular objects regularly repeat themselves along the horizontal direction, spaced by a distance equal to their horizontal dimension. In spatial-domain terms, one would say that the first object repeats itself every 20 pixels, the second every 10 pixels, and the third every 2 pixels. In frequency-domain terms, one could equivalently say that the frequency of occurrence of the 3 objects is 0.05 times per pixel (or, in imaging parlance, 0.05 cycles per pixel), 0.1 cycles per pixel, and 0.5 cycles per pixel, respectively. This reasoning can be extended to a 2- or 3-dimensional situation, the basic concept remaining the following: distance or size in the spatial domain correlates inversely with frequency in the frequency domain. Consequently, small structures in an image are said to have high frequency, and the resolution capability of a camera is often expressed by means of the Nyquist frequency, that is, the highest frequency that the system can “see.” The Nyquist frequency is, by definition, 0.5 cycles per pixel and obviously depends on the pixel size of the image matrix, which in turn depends on the matrix size and the acquisition or reconstruction zoom factor.

Intuitive way to visualize low, medium, and high frequencies in frequency domain. (Reprinted with permission of (4).)
Filters
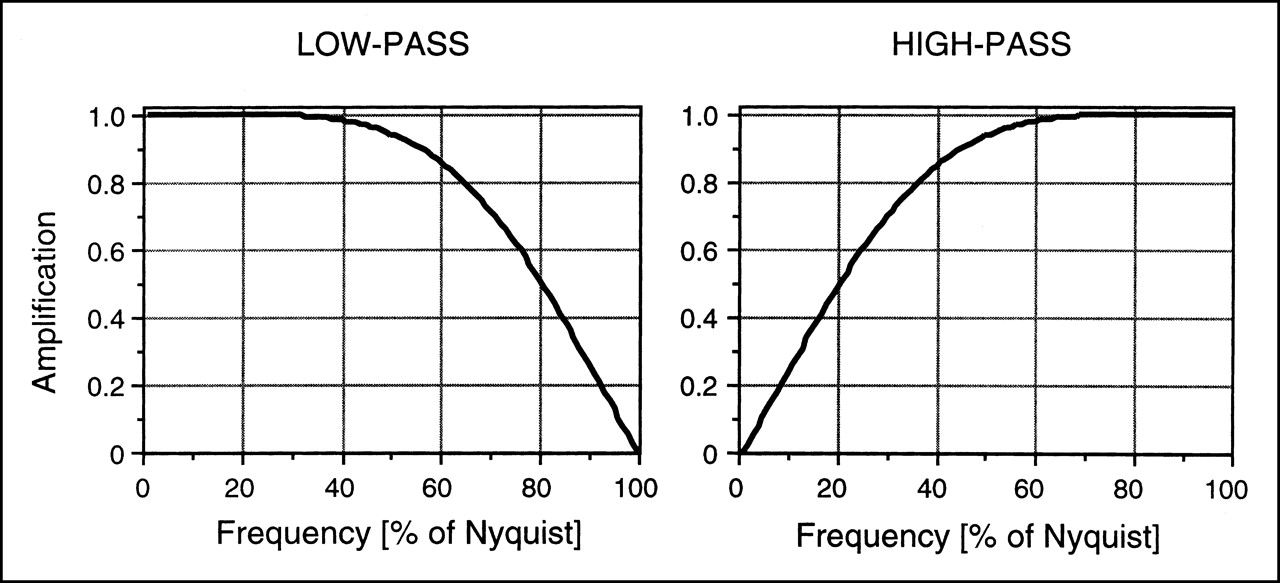
Understanding that low frequencies correspond to large, uniform objects and that high frequencies correspond to small objects or sudden variations in count levels (e.g., at the edge of an object), one realizes the desirability of developing tools that enhance or deemphasize specific characteristics of an image. Filters are such tools. The filters most used in nuclear medicine are passive filters, of which low-pass and high-pass representative examples are shown in Figure 6. By displaying filters in the frequency domain, we gain an intuitive appreciation of their operation: low-pass filters let low frequencies “pass” and progressively attenuate higher frequencies. Because image noise has a high frequency, low-pass, or smoothing, filters are applied to projection images before reconstruction to reduce statistical noise early in the processing chain (preamplifiers are used in hi-fi stereo equipment for essentially the same reason). The price to pay, of course, is a loss of contrast and edge definition in the image. High-pass filters, on the other hand, reduce the influence of large, uniform structures. Use of high-pass filters is essentially limited to the ramp filter, which is applied during filtered backprojection reconstruction to minimize the star artifact (Figs. 1 and 2). Customarily, processing of a myocardial perfusion SPECT study requires acquisition of the projection images, filtering of the projection images using a low-pass filter, reconstruction of the tomographic transaxial images from the filtered projection images using either iterative reconstruction or filtered backprojection with a ramp filter, and reorientation of the tomographic transaxial images into tomographic short-axis images. Although it is theoretically unimportant whether low-pass filtration is applied to the projection images before reconstruction or to the transaxial images after reconstruction, the former approach is generally preferred. Postreconstruction filtering may compound problems created if negative pixel values created during reconstruction are clipped to zero by the software of the camera vendor.

Curves (transfer functions) describing representative low-pass filter (left) and high-pass filter (right) in frequency domain. Low-pass filter progressively attenuates (amplification < 1) higher frequencies, whereas high-pass filter increasingly attenuates lower frequencies. In practice, commonly used low-pass filters are described by curves without discontinuities, as seen in Figure 8, to avoid image artifacts.
In addition to passive filters, active filters such as the Metz and Wiener adaptive filter (13) have gained popularity in nuclear cardiology. The appeal of these filters lies in their ability to both amplify and attenuate frequencies in selected ranges (Fig. 7) so as to, ideally, reduce noise without unduly penalizing resolution.
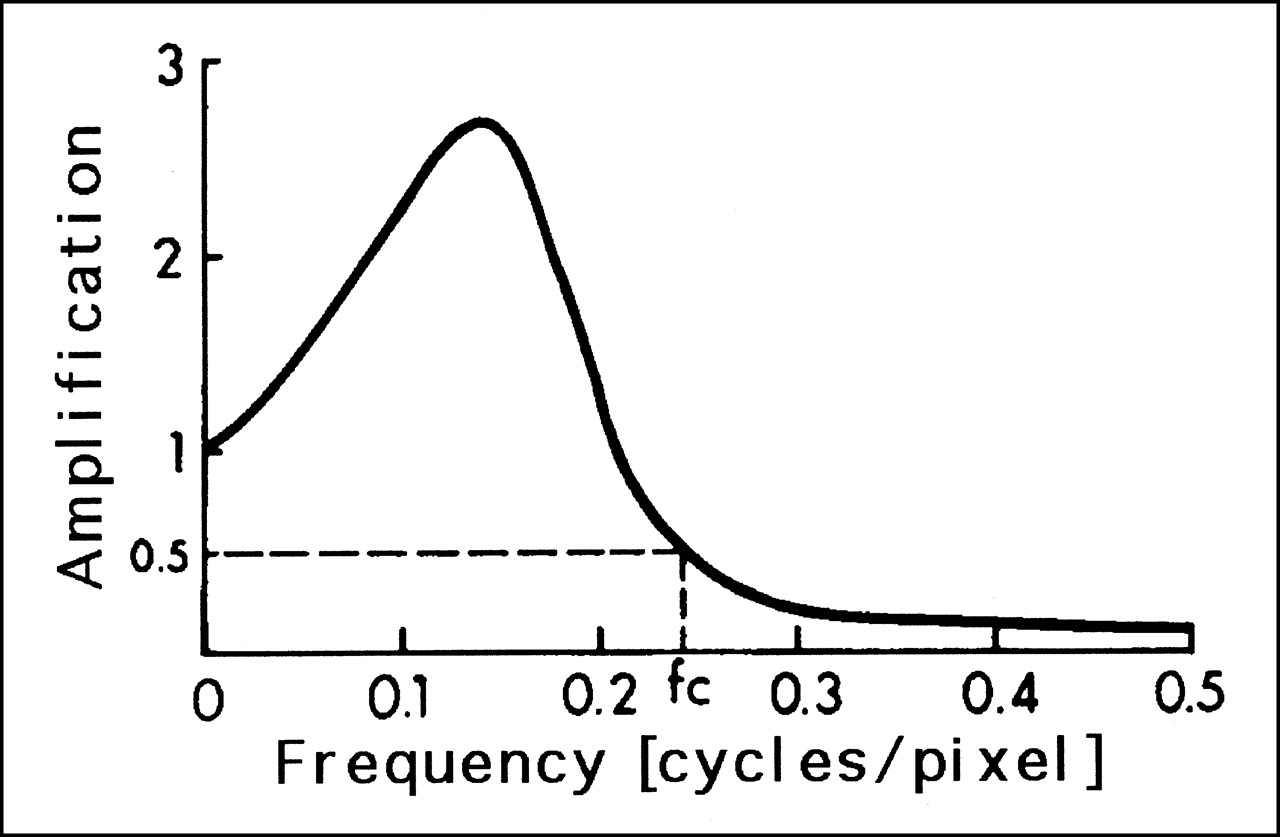
Transfer function for typical Wiener filter. This filter amplifies mid frequencies and attenuates higher ones. Top frequency value of 0.5 cycles per pixel is equivalent to value for 100% of Nyquist in Figure 6. fc = critical frequency. (Adapted from and reprinted with permission of (28).)
Butterworth Family of Filters
The most popular low-pass filters used in nuclear cardiology belong to the Hanning and the Butterworth families. Traditionally, Hanning filters were used to process 201Tl images whereas Butterworth filters were preferred for 99mTc images, but the flexibility and ease of design of Butterworth filters have made them the filters of choice in most nuclear medicine procedures today.
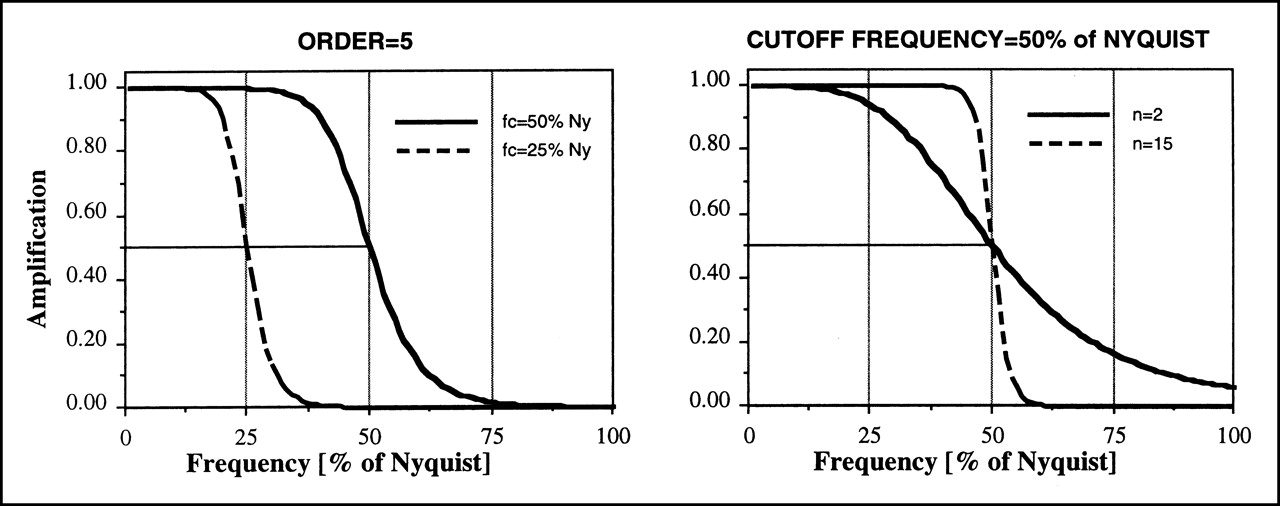
A Butterworth filter in the frequency (f) domain is shaped like a curve described by the equation:
 where fc is the critical, or cutoff, frequency and n is the order of the filter. From simple mathematic considerations, it is apparent that any Butterworth filter has amplitude 1 when f is small (low frequencies), amplitude 0 when f is large (high frequencies), and amplitude 0.5 when f equals fc. However, the mode of transition from 1 to 0 can be profoundly altered by acting on parameters n and fc of the filter. Essentially, the order of a Butterworth filter controls the slope of the transition, and the critical frequency controls the location of the middle point of the slope (Fig. 8). One should be aware that some confusion exists as to the units of measurement for the critical frequency of a Butterworth filter. Although some individuals prefer to express the critical frequency as a 0–1 numeric range, with 1 being the highest attainable frequency, or 100% of the Nyquist frequency, others point out that the Nyquist frequency is, by definition, equivalent to 0.5 cycles per pixel and adopt a 0–0.5 range instead. In other words, the same critical frequency can be reported as 0.3 or 0.6 on 2 different camera systems. In any event, whether a critical frequency is expressed in cycles per pixel or as a fraction of the Nyquist frequency, any measurement expressed in frequency terms must, clearly, always be accompanied by knowledge of the pixel size.

Butterworth filters of same order (n = 5) but different critical frequencies (50% and 25% of Nyquist) (left) and Butterworth filters with same critical frequency (50% of Nyquist) but different orders (n = 2 and n = 15) (right). These graphs show that order of Butterworth filter controls slope of its transfer function, whereas critical frequency controls location of middle point of slope. fc = critical frequency; Ny = Nyquist.
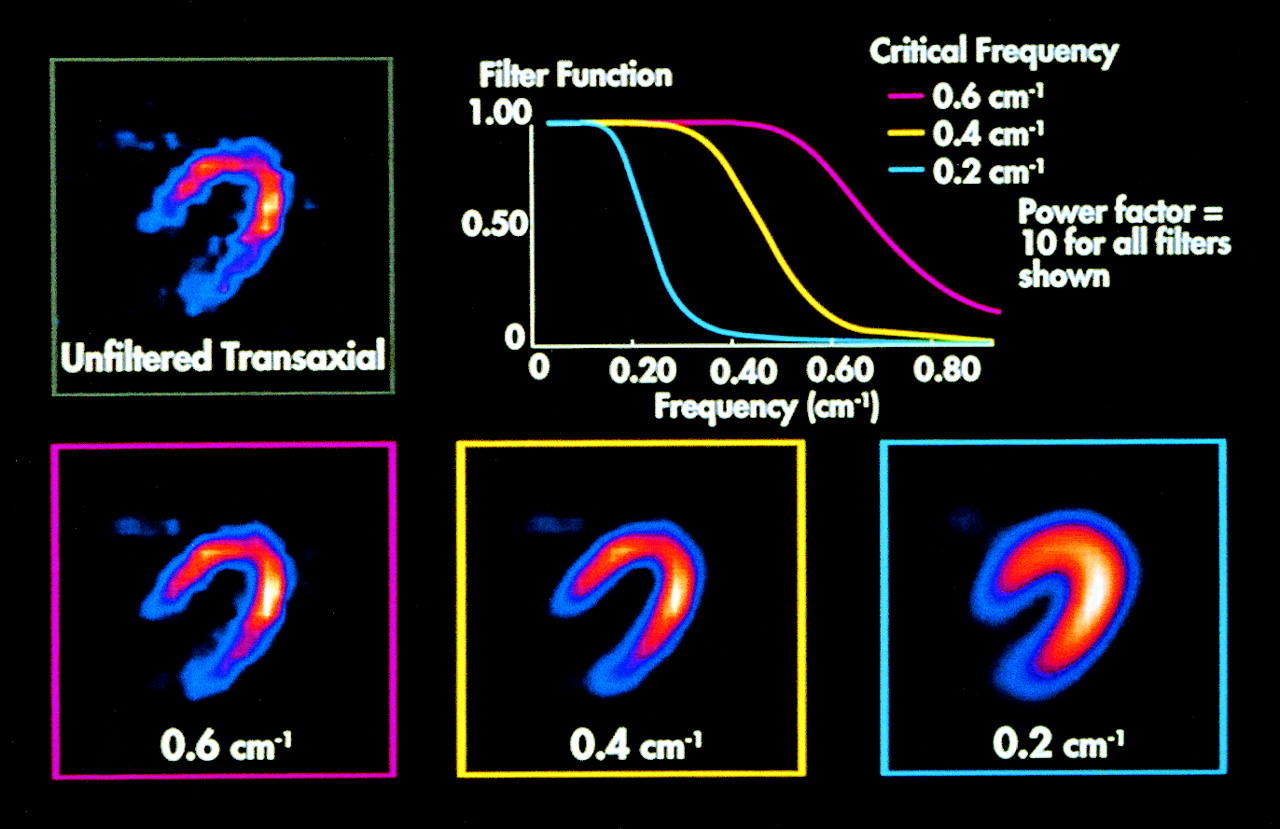
Generally speaking, the smaller the area encompassed by the response curve of a filter in the frequency domain, the fewer the spatial frequencies that are not attenuated and the smoother the resulting image. Figure 9 shows that application of Butterworth filters of increasingly low critical frequency results in reconstructed images that are increasingly smooth. Choosing the appropriate cutoff value for a Butterworth filter is a matter of trial and error and ought to be a function of the specific radioisotope and protocol used. Therefore, it is advised that one follow specific manufacturer recommendations, which are based on the published results of studies using various acquisition and processing protocols on the cameras. Varying the order of a Butterworth filter has a more subtle effect on the final image.

Effect of varying cutoff or critical frequency of Butterworth filter of order n = 5. Filtration is usually applied to projection images before reconstruction, but effect of filtration is shown on reconstructed transaxial images. Because Butterworth filters are low-pass filters, their application results in smoother images than does no application of filtering. Lower critical frequencies correspond to increased smoothing, with optimal value depending on specific radioisotope and protocol used. Power factor of a filter equals (by definition) twice its order, and all frequencies are expressed in cycles per centimeter rather than cycles per pixel. (Courtesy of DuPont Pharmaceuticals Co., Billerica, MA.)
REORIENTATION
Tomographic reconstruction of projection images produces transaxial images, that is, images perpendicular to the long axis of the patient. Because the orientation of the heart relative to the patient’s long axis varies from patient to patient, it has become common practice to reorient the transaxial images into short-axis images, which are perpendicular to the long axis of the left ventricle (LV). The advantages of reorientation include easier visual assessment of myocardial perfusion defects and the ability to more accurately quantify and display perfusion parameters (14). Reorientation of myocardial SPECT tomograms has traditionally required manual selection of a midventricular transaxial image and manual drawing of the long axis of the LV in that plane (Fig. 10). The transaxial image dataset is then resampled to generate a vertical long-axis image, on which the same operation is repeated. The position of the LV long axis in those 2 reference images defines its location in 3-dimensional space, which in turn defines the matrix necessary to reorient and display the tomographic data in the coordinate system perpendicular to the long axis of the LV. The global procedure is somewhat time consuming and subjective and may cause artifacts (especially when perfusion defects are present) if one or both of the manual drawings are incorrect (Fig. 10). The reorientation process has largely been automated in modern nuclear cardiology, and the long axis of the LV can be extracted accurately and reproducibly directly from the 3-dimensional transaxial image volume (15–17).
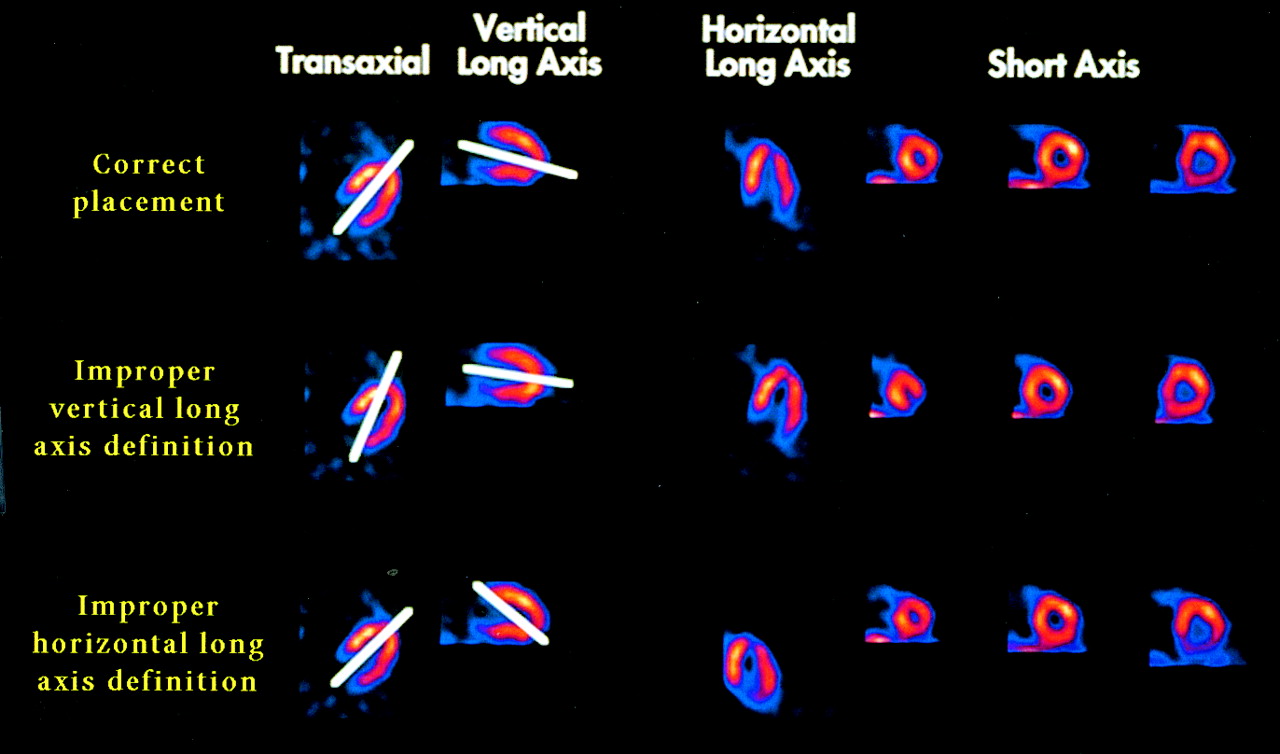
Manual drawing of long axis of LV in 2 midventricular images for purpose of reorienting transaxial images into short-axis and long-axis images. Incorrect drawing of axis may create artifacts in reoriented images. (Courtesy of DuPont Pharmaceuticals.)
CONFOUNDING FACTORS IN MYOCARDIAL SPECT IMAGING
As is often the case, the quality of the final output (reoriented SPECT images) depends on that of the original input (projection images). The quality of projection images is affected by Compton scatter, photon absorption, variable resolution, and patient motion, with the first 2 factors being particularly important in cardiac imaging because the heart is surrounded by organs of much different densities.
Compton Scattering
Compton scattering is a phenomenon whereby the energy of a photon (γ-ray) emitted from the myocardium is partially absorbed by an atomic electron, and the direction of the photon is altered according to the equation:
 where Eγ is the energy of the original photon, E′γ that of the scattered photon, and θ the angle by which the direction of the original photon is altered (Fig. 11). θ can assume any value between 0° and 180°. The loss of energy corresponding to 30° scattering is only about 5 keV for a 99mTc photon and 1.3 keV for a 201Tl photon, suggesting that many photons undergoing single-hit Compton scattering carry incorrect positional information (Fig. 12) but are hard to distinguish from primary photons by energy discrimination.
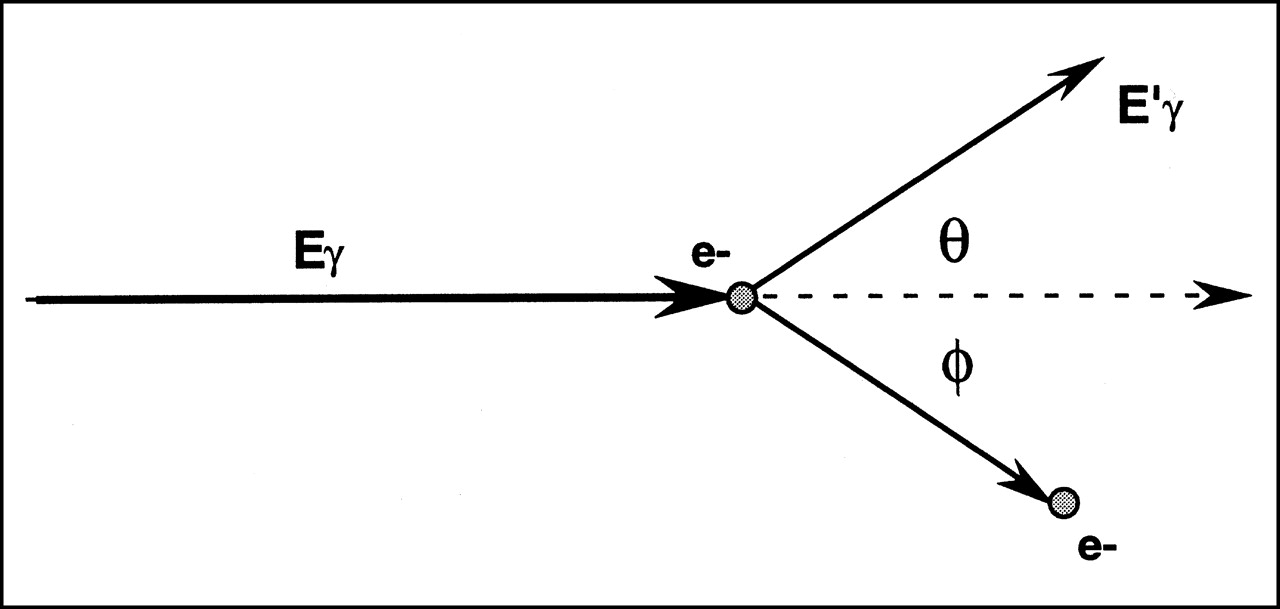
Energy and directional relationships of photon undergoing Compton scattering with atomic electron. e− = electron; φ = angle of recoil of electron.

Different categories of photons in nuclear imaging: primary photons (1), which are uncontaminated and account for photopeak in energy spectrum (top right); Compton-scattered photons (2), which have lower energy and carry incorrect positional information; and absorbed photons (3), which are not collected in forming projection image (top left).
In practical terms, Compton scatter causes loss of resolution and contrast in the projection images and, consequently, in the tomographic images. Figure 13 shows a phantom experiment in which 99mTc and 201Tl are mixed in various ratios and imaged simultaneously in a 62- to 89-keV energy window (201Tl window). As the proportion of 99mTc increases, so does the number of photons downscattered from the 99mTc photopeak into the 201Tl window.
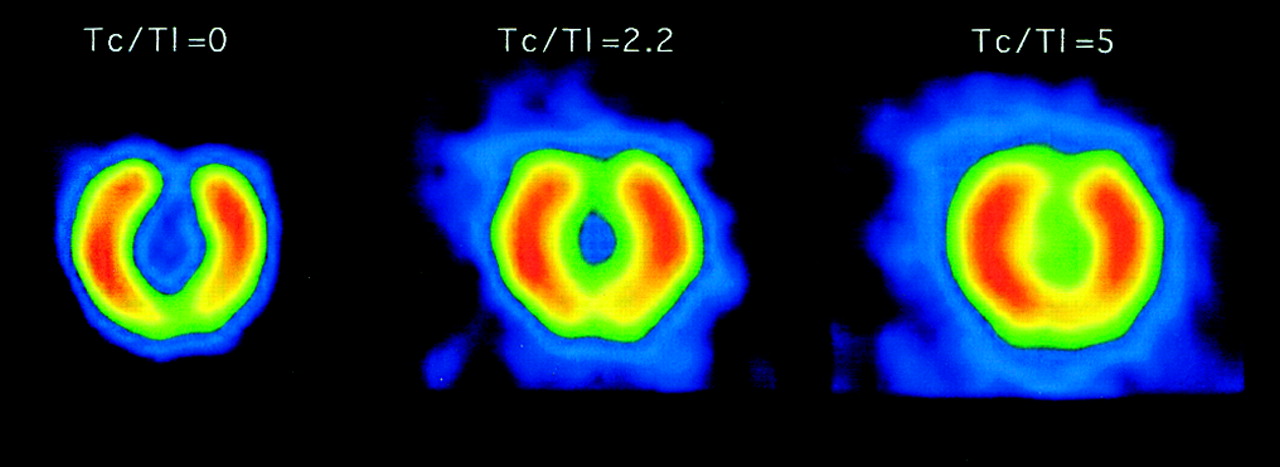
Short-axis images of phantom containing mixture of 99mTc and 201Tl in various ratios, imaged in energy window centered on main 201Tl photopeak. Compton scatter (downscatter) of 99mTc photons into 201Tl window progressively fills in inferior and anterior wall defects in phantom, while decreasing overall image resolution.
Photon Absorption
Although the definition of photon attenuation comprises both Compton scatter and photon absorption, the term is often used as a proxy for the latter. Absorbed photons do not reach the detector and therefore do not contribute to the projection image (Fig. 12). In essence, the energy of a photon emitted from the myocardium is totally absorbed by an atomic electron (photoelectric effect).
In cardiac imaging, attenuation affects different areas of the heart differently, thus preventing accurate measurement of the relative amount of radioactivity in a given myocardial region, and has long been recognized as a fundamental limitation of myocardial perfusion SPECT. The most frequent artifacts connected with photon attenuation are apparent perfusion defects in the anterior or lateral myocardial wall in large-breasted women (breast attenuation) and defects in the inferior wall secondary to diaphragmatic attenuation.
Variable Resolution
As discussed earlier, the use of noncircular orbits in which the camera detectors are always closest to the patient leads to the collection of projection images of widely different resolution. Figure 14 exemplifies this concept using a resolution test pattern imaged at different distances from the face of a parallel collimator.

Resolution test pattern imaged 0 cm (A), 10 cm (B), and 20 cm (C) from parallel-hole collimator. Resolution decreases with distance. (Modified from and reprinted with permission of (27).)
Patient Motion
Patient or organ motion is believed to affect as many as 10%–20% of all cardiac SPECT studies. Motion can be divided into 3 broad categories: upward creeping, bouncing, and returning or nonreturning shifting. Upward creeping of the heart is most often found after exercise stress (18) and reflects the gradual return of the diaphragm to its preexercise location in a patient’s chest. Returning and nonreturning shifting by the patient may occur vertically, horizontally, or in both directions. Bouncing refers to a usually vertical, or up-and-down, oscillation.
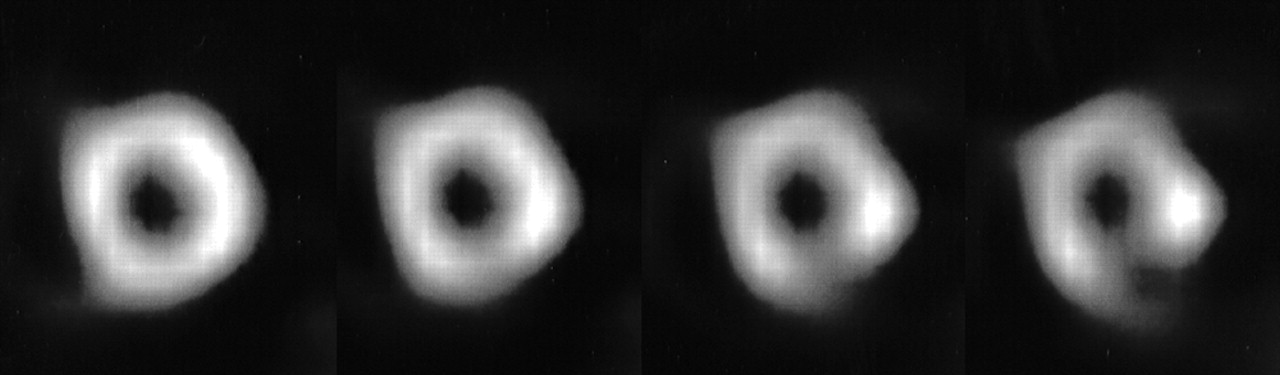
Artifactual perfusion defects created by motion can be severe (Fig. 15) and are a function of the time, degree, and type of motion as well as the number of camera detectors (19). Specifically, motion by 2 or more pixels usually results in clinically significant artifacts, and motion in the projections with greater myocardial counts appears to cause larger artifacts. Dual-detector cameras are more vulnerable to motion than are single-detector cameras, because twice the number of projections is often involved; on the other hand, single-detector acquisitions are twice as long for the same number of collected counts, and the chance that patients will move is therefore greater.

Motion artifacts created in short-axis image by (left to right) 0-, 1-, 2-, and 3-pixel vertical shifting of all projections corresponding to last 7 min of 14-min, 180° 99mTc-sestamibi SPECT acquisition. Deformation of ventricular cavity progresses as degree of motion increases, and artifactual perfusion defect in inferior myocardial wall worsens.
The best solution to patient motion is to prevent it during SPECT acquisition by, for example, using arm-holding devices or imaging patients while they are prone, the latter approach being also useful for reducing LV inferior wall attenuation (20).
CONCLUSION
Myocardial perfusion SPECT imaging involves the acquisition of planar images but also requires a series of additional image-processing steps. This article has briefly reviewed those steps, with special emphasis on image filtering and tomographic reconstruction. The issues of quality control of SPECT instrumentation and identification of SPECT artifacts are beyond the scope of this article but are important and are specifically addressed by many publications (21,22). The technical aspects of gated perfusion SPECT (23,24) and gated blood-pool SPECT (25) have also been discussed elsewhere, as has the application of quantitative algorithms to the analysis of SPECT images and the theory of attenuation and scatter correction (26).
Footnotes
Received Jan. 22, 2001; revision accepted Jun. 11, 2001.
For correspondence or reprints contact: Guido Germano, PhD, Cedars-Sinai Medical Center, 8700 Beverly Blvd. A047 N., Los Angeles, CA 90048.
*NOTE: FOR CE CREDIT, YOU CAN ACCESS THIS ACTIVITY THROUGH THE SNM WEB SITE (http://www.snm.org/education/ce_online.html) UNTIL OCTOBER 2002.
REFERENCES
In this issue


Jump to section
Related Articles
Cited By...
- Semiqualitative Visual and Quantitative Morphometric Evaluations of Reduced Scan Time and Wide-Beam Reconstruction in Rest-Gated Stress SPECT Myocardial Perfusion Imaging
- Artifacts and Pitfalls in Myocardial Perfusion Imaging
- Image Reconstruction Using Filtered Backprojection and Iterative Method: Effect on Motion Artifacts in Myocardial Perfusion SPECT
- The effect of Butterworth and Metz reconstruction filters on volume and ejection fraction calculations with 99Tcm gated myocardial SPECT
- Impact of Patient Motion on Myocardial Perfusion SPECT Diagnostic Integrity: Part 2
- Procedure guidelines for radionuclide myocardial perfusion imaging
- Analytic and Iterative Reconstruction Algorithms in SPECT