


Abstract
The objective of this study was to compare visual assessment of 3-dimensional color-modulated (to counts) surface displays with visual assessment of oblique tomographic slices of myocardial SPECT perfusion distributions in the detection and localization of coronary artery disease (CAD). Methods: Sixty-two consecutive patients (41 men, 21 women; mean age, 61 ± 11 y) who had undergone conventional dual-isotope perfusion SPECT were retrospectively chosen; 50 had undergone coronary arteriography previously, and 12 had less than a 5% likelihood of CAD. Four readers interpreted the 3-dimensional displays and slices in separate sessions while unaware of the findings of previous readings, the interpretations of others, and the angiographic results. The readers used a 5-point scoring system. Their average score was used for receiver operating characteristic (ROC) analysis. The area under the ROC curves was determined so that the ability of the 2 methods to detect and localize CAD could be compared. Results: No significant differences were found between visual interpretation of 3-dimensional displays and visual interpretation of slices. Conclusion: These preliminary results indicate that visual interpretation of 3-dimensional displays of myocardial perfusion SPECT distributions may someday replace visual assessment of conventional slices without loss of diagnostic accuracy.
Conventional methods for displaying myocardial perfusion distribution during the last 10 y have included tomographic slices and polar maps (1,2). Two-dimensional polar maps have become standard for displaying 3-dimensional myocardial perfusion distribution. These have been validated in multicenter trials and have been shown to correlate well with cardiac catheterization and expert visual interpretation of slices (3,4). Recently, 3-dimensional displays have become popular for depicting the localization and extent of myocardial hypoperfusion (5–12).
Three-dimensional displays of myocardial perfusion distributions generally fall into 1 of 3 categories: volume rendering (5), surface rendering (6), and color-modulated surface display (7–11). Three-dimensional displays have been shown to be at least as accurate as polar maps in representing the extent and location of myocardial hypoperfusion (12) and do not have the geometric distortions inherent in mapping a 3-dimensional structure onto a 2-dimensional polar map (9–12). Color-modulated surface displays have been developed and validated (8–12). This method has an advantage over other 3-dimensional representations because it uses a continuous color scale modulated according to the counts (activity) extracted from the 3-dimensional sampled myocardium (8–12). This color representation is then shaded to create the illusion of viewing a 3-dimensional object.
In a previous study, Cooke et al. (12) reported that quantitative 3-dimensional color-modulated surface display was at least as good as quantitative polar maps (CEqual programs; Emory University, Atlanta, GA, and Cedars-Sinai Medical Center, Los Angeles, CA) in localizing perfusion defects and reversibility patterns. In this article, we report on the accuracy of detecting and localizing coronary artery disease (CAD) using visual interpretation of 3-dimensional color-modulated surface displays versus visual interpretation of tomographic slices. The significance of this study is the expectation that humans can interpret 3-dimensional objects faster and more accurately than tomographic slices.
MATERIALS AND METHODS
Study Population
Sixty-two consecutive patients (41 men, 21 women; mean age, 61 ± 11 y) were chosen retrospectively from January 1996 to February 1997 from a pool of 143 patients who underwent dual-isotope myocardial perfusion SPECT (201Tl rest and 99mTc sestamibi stress) and coronary angiography. We excluded 12 patients with known nonischemic cardiomyopathy and 55 patients with prior percutaneous transluminal coronary angioplasty or with prior coronary artery bypass grafting. From the remaining 76 patients, we selected 50 with the following distributions in CAD: 15 with 1-vessel disease, 15 with 2-vessel disease, 12 with 3-vessel disease, and 8 with no angiographically significant CAD. Significant CAD was defined as 50% stenosis in at least 1 major coronary artery. Eighteen of these patients had previously experienced myocardial infarction. Twelve additional patients with a low likelihood of CAD were included. These patients had less than a 5% likelihood of CAD based on sequential Bayesian analysis of age, sex, symptom classification, and the results of exercise electrocardiography.
SPECT Acquisition Protocol
All patients underwent rest 201Tl–stress 99mTc sestamibi separate-acquisition dual-isotope myocardial perfusion SPECT, as previously described (13). 201Tl (111–148 MBq) was injected intravenously at rest, with dose variation for chest size (>118 cm [44 in.], 148 MBq). Rest 201Tl imaging was begun 15 min after injection. After acquisition, 38 (61%) patients performed a symptom-limited exercise test on a treadmill. The standard Bruce protocol was used. In 24 (39%) patients, 0.142 mg/kg/min dipyridamole was administered intravenously during 4 min. At near-maximal exercise or 5 min after dipyridamole infusion, 99mTc-sestamibi (814–1110 MBq) was injected intravenously, with dose variation for weight (weight [kg] × 0.318). SPECT was begun 15 min after injection.
The acquisition and reconstruction were standard and as previously described (13). The images were acquired at 30 s per projection for the rest study and 20 s per projection for the stress study, with a low-energy, high-resolution parallel-hole collimator, using a 64 × 64 matrix, and 64 projections through 180°. For evaluation of myocardial perfusion, the rest and stress planar projections were prefiltered with Butterworth filters (rest: critical frequency = 0.4 cycles/cm, power factor = 10; stress: critical frequency = 0.52 cycles/cm, power factor = 5), followed by reconstruction with a ramp filter and reorientation into long- and short-axis slices.
Creation of 3-Dimensional Display
Three-dimensional displays were generated using a previously described technique of modeling the myocardial surface with small, triangular plates (9–12). The maximum count in each sampled segment was used to color-code the displayed surface, in which the apical portion of the myocardium was sampled in spherical coordinates and the remaining myocardium was sampled in cylindric coordinates. The coordinates of each sampled point were saved for generating the 3-dimensional surface models. The models were built by filtering the sample coordinates and connecting the sample point into triangles. Thus, the left ventricle was modeled as a polygonal surface composed of triangles, and each triangle was assigned a color corresponding to the counts extracted from the myocardium at the sample point or from arrays that were generated during a quantification process (9–12). The count value from the triangles was interpolated to create a continuum of colors. For this study, the artificial lighting for the 3-dimensional shading was modified to reduce reflection of light from the bright walls into the eyes of the readers, because the increase in brightness might have caused a defect to appear normal or less severe. This modification did make the objects appear flatter or less 3-dimensional.
Creation of the Slice-by-Slice Display
The slice-by-slice display was optimized in the following manner. Multislice display was performed after automatic processing and quantification using the Emory Cardiac Toolbox (Emory University, Atlanta, GA) program. This program automatically finds the apex and base of the left ventricle and aligns and displays side by side the rest and stress sequence of oblique slices accordingly. Because the 3-dimensional sampling is performed first to generate polar maps, the algorithm isolates the region of the 3-dimensional left ventricle. The 3-dimensional sampling yields the maximum counts in the myocardial distribution at rest and at stress. These are used to set the computer display such that the most intense gray level or color corresponds to the maximum counts from the corresponding stress and rest myocardial distribution and not to another hot periventricular region.
Expert Reading
The Emory Cardiac Toolbox program was used for displaying all images. Four expert readers visually assessed the presence, size, and location of the perfusion defects and corresponding reversibility seen in the tomographic slices and 3-dimensional color-modulated surface displays. The readers also assigned each defect to the corresponding vascular territory. They were unaware of each other's findings. The sessions for interpreting the slices and the 3-dimensional maps were at least 15 d apart so that each reader was unaware of his or her own previous results. Readers used score sheets dividing the myocardium into the Cedars-Sinai 20-segment model (14). This model uses 6 segments in a basal short-axis slice, 6 segments in a midventricular short-axis slice, 6 segments in an apical short-axis slice, and 2 segments in a vertical long-axis slice to define the apex. The same 5-point scale was used to score the reading of both the slices and the 3-dimensional color-modulated surface display: 0 = normal, 1 = probably normal, 2 = equivocal, 3 = probably abnormal, and 4 = abnormal.
Disease was assigned to 1 or more vascular territory combinations: left anterior descending (LAD) coronary artery, left circumflex (LCX) coronary artery, right coronary artery (RCA), LAD and/or LCX, LAD and/or RCA, and LCX and/or RCA. Once a region was determined to be hypoperfused, it was assigned to the territory in which the majority of the region fell. If a defect or reversibility region fell between 2 territories, it was assigned to the “and/or” combination of the 2 territories, as in previous studies (12). The average score of the 4 readers was used for receiver operating characteristic (ROC) curve analysis. Angiography was used as the gold standard for detecting and localizing CAD.
The readers used the display of the rotating planar projections to assess technical quality, attenuation, patient movement, and lung uptake. These displays were available for interpretation in combination with either the slice-by-slice display or the 3-dimensional display. Examples of the slice-by-slice and 3-dimensional displays in a patient with CAD are shown in Figure 1.
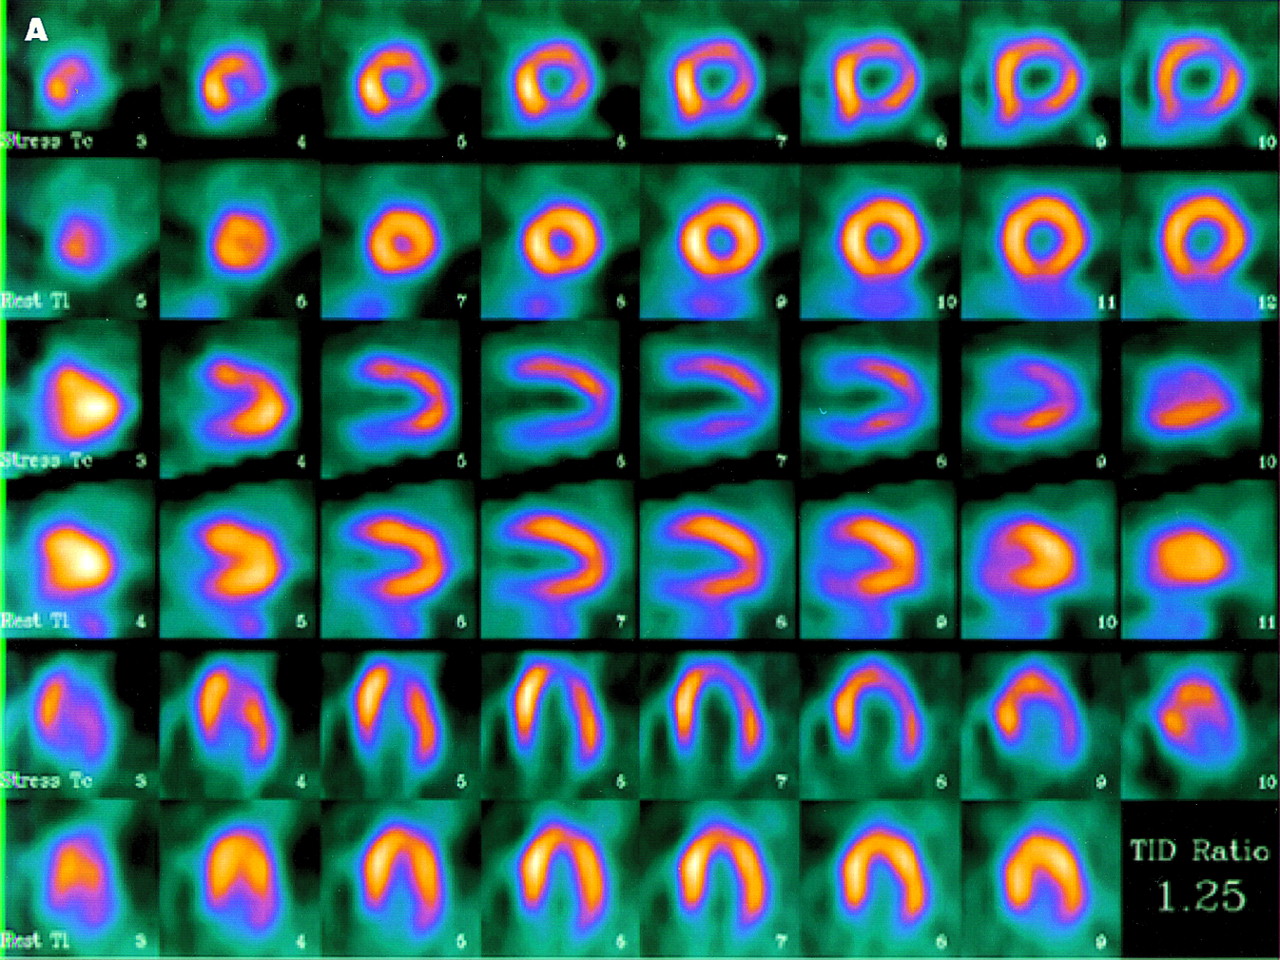
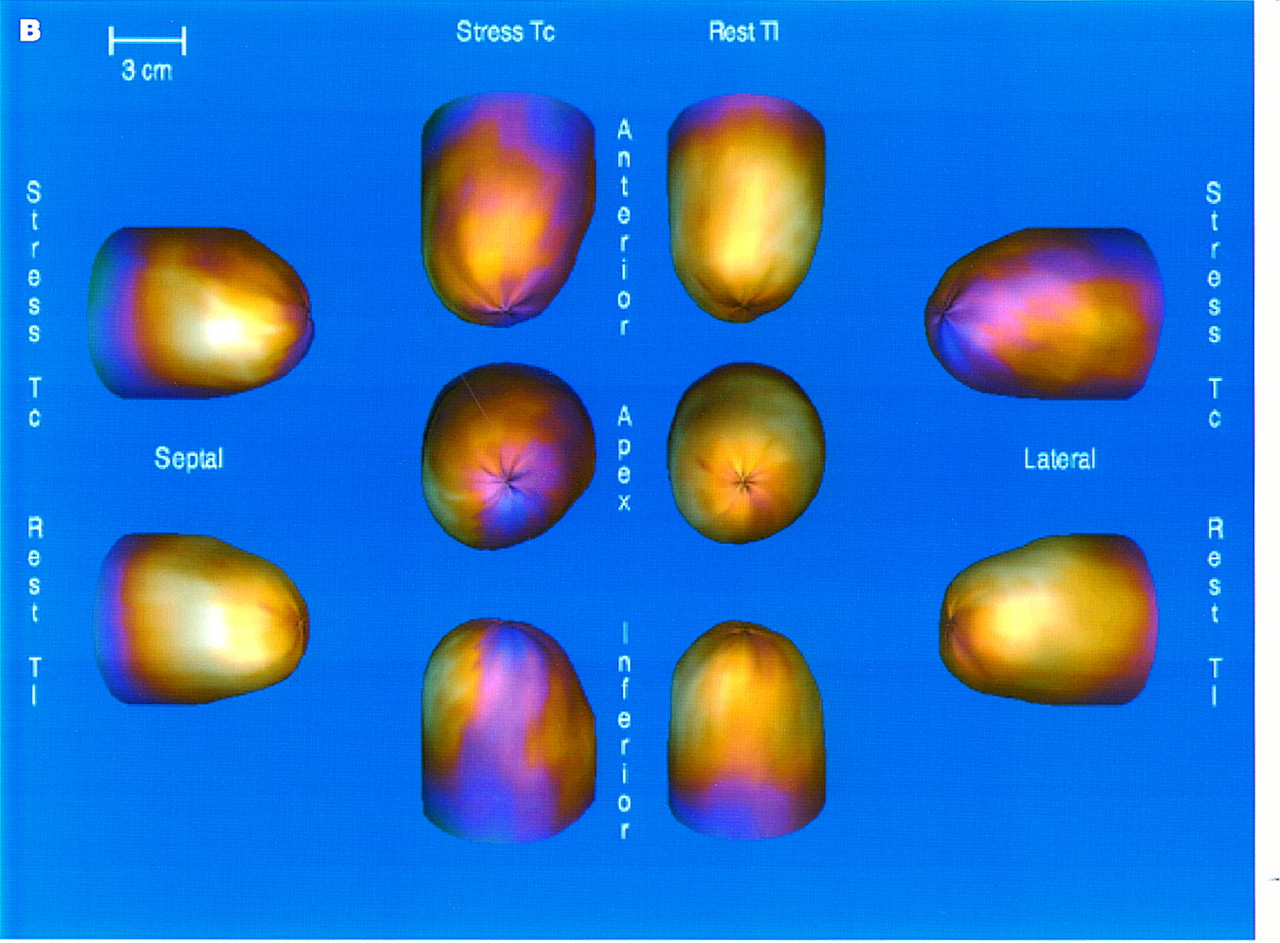
Dual-isotope (sestamibi and thallium) SPECT study of 51-y-old man with class 4 angina pectoris and hyperlipidemia. Coronary angiography showed 70% lesion in LAD, 80% lesion in first marginal area in LCX territory, 60% lesion in second marginal area in LCX territory, and 60% lesion in RCA and posterior descending artery. Patient exercised on treadmill for 8 min and had 1-mm ST-T depression. He reached 93% of predicted heart rate. Three months after myocardial perfusion imaging and cardiac catheterization, patient underwent coronary bypass surgery. Findings of tomograms (A) and 2-dimensional color modulated images (B) were interpreted as abnormal, with hypoperfused anterior, lateral, and inferior walls.
Statistical Analysis
The Rockit 0.9 0.1B program (University of Chicago, Chicago, IL) (15) was used to compare the ROC results between techniques. Area analysis and SD were used. A univariate z score test of the difference between the areas of 2 ROC curves was used to calculate statistical significance between techniques. The P < 0.05 level was used to determine significance.
RESULTS
In the 12 low-likelihood patients, the calculated normalcy rate was 83% (10/12) using either technique. The 2 patients with potentially false-positive findings showed the same findings using either the slices or the 3-dimensional images. Whether the slices were used or the 3-dimensional images were used, the same 2 patients were interpreted as equivocal, which for this study was considered abnormal. If we had considered equivocal as normal, the normalcy rate would have been 92% (11/12) for both techniques.
ROC analysis comparing visual assessment of the slice-by-slice display with visual assessment of the color-modulated 3-dimensional display in the detection of CAD found insignificant differences between the techniques (Fig. 2). The area under the ROC curve for slices was 0.80 ± 0.06, and that for the 3-dimensional display was 0.76 ± 0.07, resulting in a probability value of 0.19.

Comparison of ROC for visual interpretation of slices versus 3-dimensional (3D) color-modulated displays showing no statistically significant differences between techniques. Points plotted represent input to Rockit program (University of Chicago) (15) that generated corresponding ROC curves and related statistics. Bars represent uncertainty of measurements in terms of 1 SD.
ROC analysis comparing visual assessment of slice-by-slice display with visual assessment of the color-modulated 3-dimensional display in the localization of CAD to a vascular territory also found insignificant differences between the techniques (Fig. 3). This was true whether the analysis was performed with all vessels combined or whether the analysis was performed by vascular territory. For all vessels combined, the area under the ROC curve for slices was 0.77 ± 0.03 and that for the 3-dimensional display was 0.78 ± 0.03, resulting in a probability value of 0.42. Similar insignificant differences were found when the areas under the ROC curves were compared for the LAD artery vascular territory (0.61 ± 0.09 for slices versus = 0.60 ± 0.08 for 3-dimensional display, P = 0.43), the LCX artery vascular territory (0.72 ± 0.08 for slices versus 0.79 ± 0.08 for 3-dimensional display, P = 0.18), and the RCA vascular territory (0.81 ± 0.06 for slices versus 0.77 ± 0.06 for 3-dimensional display, P = 0.20).
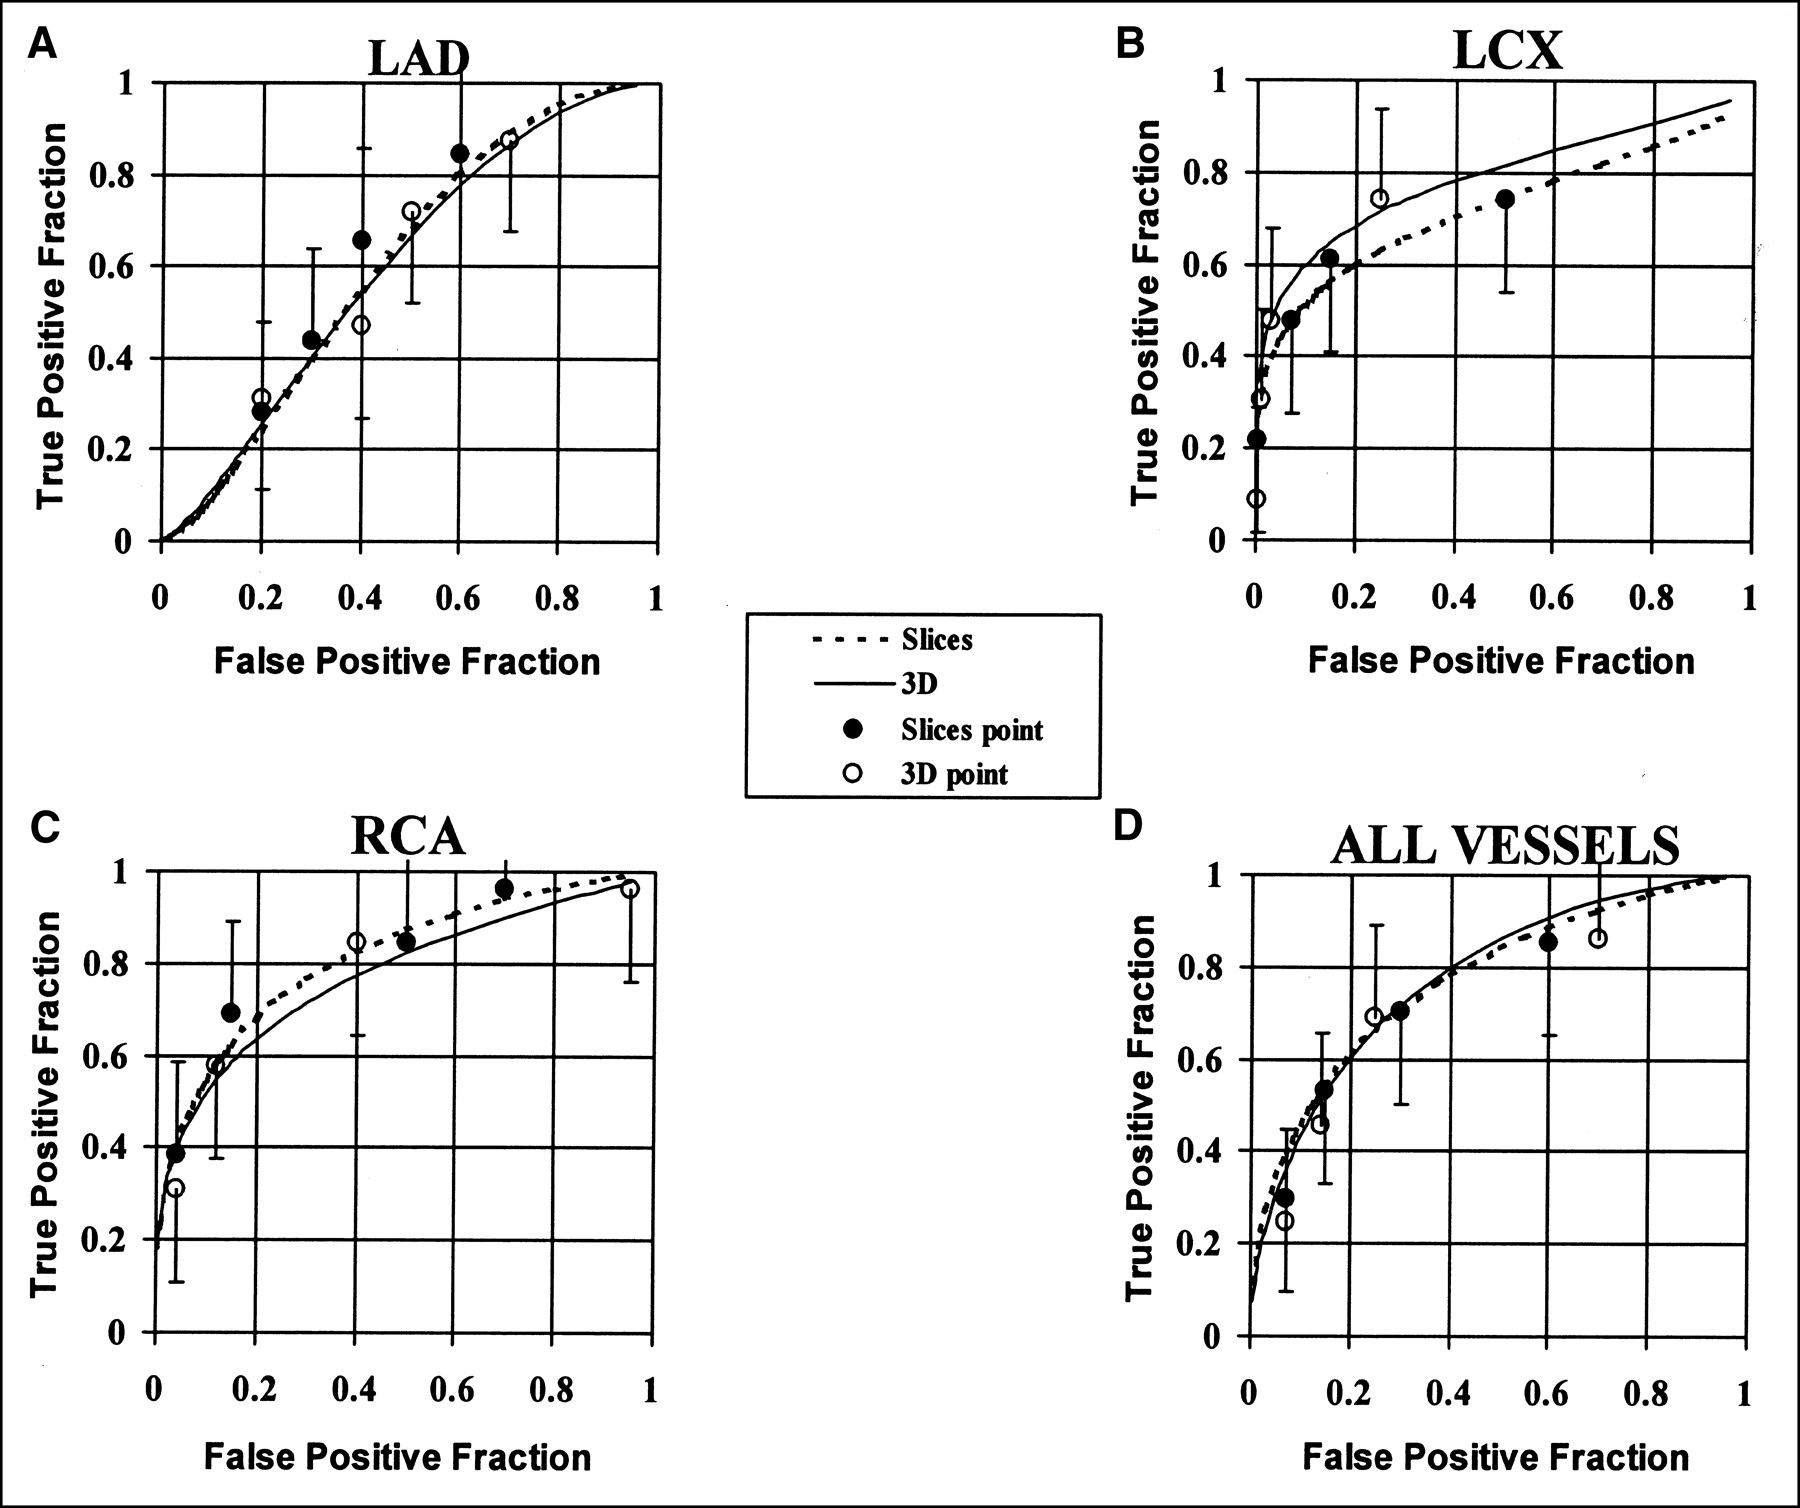
Comparison of ROC results obtained from visual interpretation by experts of tomographic slices versus 3-dimensional (3D) color-modulated surface displays. These results are reported for overall localization to all 3 vascular territories (all vessels) and for LAD, LCX, and RCA vascular territories. No statistically significant differences were detected.
DISCUSSION
This study was designed to test the feasibility of using visual assessment of 3-dimensional color-modulated displays alone to detect and localize CAD. Faber et al. (11) showed that, compared with MRI, 3-dimensional display depicts the anatomic shape of the myocardium accurately. Cooke et al. (10) showed that 3-dimensional display accurately represents the extent and location of myocardial hypoperfusion. In a more recent study, Cooke et al. (12) reported a 97% agreement between 3-dimensional display (with quantitative criteria applied) and the quantitative polar map in detection of perfusion defects and a 97% agreement in the detection of reversible segments. In the same study, agreement for localizing perfusion defects to vascular territories was reported to be 87% for the LAD artery territory, 97% for the LCX artery territory, and 97% for the RCA territory. The conclusion was that 3-dimensional color-modulated surface displays were comparable with quantitative polar maps in detecting and localizing perfusion defects.
Two other studies have reported on the efficacy of using 3-dimensional displays for assessment of myocardial perfusion. Quaife et al. (16), using similar 3-dimensional color-modulated surface displays, reported that their 3-dimensional displays were statistically more sensitive than multislice analysis for the localization of perfusion abnormalities to individual coronary territories (80% versus 64%, P < 0.001). Quaife et al. also reported no significant difference in the detection of CAD and no significant difference in specificity for localizing CAD.
Demangeat et al. (17), in an angiographic study of 201 patients, compared 3-dimensional surface rendering with slices and polar maps using different threshold levels of the surface rendering. These authors reported different results depending on the threshold used. A 60% threshold showed the best concordance with multislice and polar map displays. They reported an accuracy of approximately 81% for the 3 modes, with no statistical difference found between the respective sensitivities and specificities.
Surface rendering is often fast and easy to implement and, with the proper segmentation, can give useful results. However, most cardiac SPECT studies contain both physiologic and anatomic information, and segmentation into a binary dataset often ignores some of the important physiologic information, which can be visualized only as a gradation of gray levels or color. Moreover, improper segmentation from incorrect tracings or thresholds can give erroneous results.
The 3-dimensional color-modulated surface display differs from the surface rendering display in that primitive graphics (10) (such as triangles, plates, and patches), instead of raw voxels, are used to model the surface of the myocardium. In our model (9–12) for 3-dimensional display of perfusion, each triangle can be assigned a color corresponding to the counts extracted from the myocardium during a quantification process.
In this study, we compared visual assessment of tomographic slices of myocardial perfusion scans with visual assessment of 3-dimensional color-modulated surface displays. ROC analysis found no statistically significant differences between the ability of the 2 techniques to detect and localize CAD. If a much larger population had been used, a statistically significant difference might have been found, indicating, however, that the magnitude of the differences would be expected to be small. Anecdotally, the experts assessed the 3-dimensional displays in approximately half the time they needed to assess the tomographic slices. This finding is remarkable considering that these experts had more than 40 y of combined experience in interpreting tomographic slices and limited experience in interpreting 3-dimensional color-modulated surface displays.
CONCLUSION
Visual interpretation of 3-dimensional color-modulated surface displays of myocardial perfusion SPECT distributions may someday replace visual assessment of conventional tomographic slices without loss of diagnostic accuracy.
Acknowledgments
This study was supported in part by National Institutes of Health grant RO1HL42052 and National Library of Medicine grant RO1LM06726. Drs. Garcia, Folks, Cooke, and Faber receive royalties from the sale of the Emory Cardiac Toolbox related to the research described in this article. The terms of this arrangement have been reviewed and approved by Emory University in accordance with its conflict-of-interest practice.
Footnotes
Received Nov. 22, 1999; revision accepted May 5, 2000.
For correspondence or reprints contact: Ernest V. Garcia, PhD, Radiology Department, Rm. E163, Emory University Hospital, 1364 Clifton Rd., NE, Atlanta, GA 30322.


