


Abstract
There is rising interest in recruitment of brown adipocytes into white adipose tissue (WAT) as a means to augment energy expenditure for weight reduction. We thus investigated the potential of 18F-FDG uptake as an imaging biomarker that can monitor the process of WAT browning. Methods: C57BL/6 mice were treated daily with the β3 agonist CL316,243 (5-[(2R)-2-[[(2R)-2-(3-chlorophenyl)-2-hydroxyethyl]amino]propyl]-1,3-benzodioxole-2,2-dicarboxylic acid disodium salt), whereas controls received saline. 18F-FDG small-animal PET/CT was serially performed at 1 h after CL316,243 injection. After sacrifice, interscapular brown adipose tissue (BAT) and WAT depots were extracted, weighed, and measured for 18F-FDG uptake. Tissues underwent immunostaining, and UCP1 content was quantified by Western blotting. Results: PET/CT showed low 18F-FDG uptake in both BAT and inguinal WAT at baseline. BAT uptake was substantially increased by a single stimulation with CL316,243. Uptake in inguinal WAT was only modestly elevated by the first stimulation uptake but gradually increased to BAT level by prolonged stimulation. Ex vivo measurements recapitulated the PET findings, and measured 18F-FDG uptake in other WAT depots was similar to inguinal WAT. WAT browning by prolonged stimulation was confirmed by a substantial increase in uncoupling protein 1 (UCP1), cytochrome-c oxidase 4 (COX4), and PR domain containing 16 (PRDM16) staining as markers of brown adipocytes. UCP1 content, which served as a measure for extent of browning, was low in baseline inguinal WAT but linearly increased over 10 d of CL316,243 injection. Finally, image-based and ex vivo–measured 18F-FDG uptake in inguinal WAT correlated well with UCP1 content. Conclusion: 18F-FDG PET/CT has the capacity to monitor brown adipocyte recruitment into WAT depots in vivo and may thus be useful for screening the efficacy of strategies to promote WAT browning.
Subcutaneous and visceral white adipose tissue (WAT) contributes to obesity by storing excess energy as intracellular lipid (1,2). By contrast, brown adipose tissue (BAT) can have a negative influence on weight gain by dissipating energy as heat (3,4). This thermoregulatory response is mediated through norepinephrine-activated β3 adrenergic receptor (β3AR) signaling. The exciting recent revelation that functional BAT is present not only in animals and young children but also in human adults (5,6) has fueled attempts to exploit its energy-consuming property to counter obesity (7,8). Unfortunately, however, obese patients have insufficient amounts of BAT, limiting the value of constitutive BAT for weight reduction (9).
On the other hand, obese subjects have abundant amounts WAT. It has recently become known that WAT can recruit clusters of adipocytes with a brownlike phenotype. This process, called WAT browning, can be seen in mice stimulated by prolonged cold exposure or by β3AR agonists as a mimetic of cold stress (10,11). Brownlike cells recruited by WAT browning are referred to as beige (pale brown) adipocytes (12–14). On the basis of these findings, there is rising interest in modulating the metabolic characteristics of WAT through beige cell recruitment to treat obesity. A particular attraction of this strategy is that it proposes to convert a fat-storing tissue into one that burns calories.
However, several questions need to be answered before targeting of WAT browning for weight reduction can be realized. For example, it is not known to what extent WAT can convert to beige cells or how various depots differ in this capacity. Furthermore, a method to evaluate the thermogenic impact of new drug candidates and allow a better understanding of the factors involved in optimal WAT browning is required. The current standard method for assessing WAT browning in animal models is based on invasive tissue sampling for histologic or immunologic detection of brown adipocyte–specific biomarkers, and the contribution of WAT browning on thermogenesis and systemic metabolism has relied on indirect inference from tissue characteristics.
As such, the ability to directly image energy consumption of WAT in living subjects may allow a better understanding of the mechanism of beige adipocyte recruitment and help facilitate the development of new candidate drugs. Visualization of heat radiation using infrared cameras is not a good measure of WAT thermogenesis because of dependence on thermal conductance, insulation, and blood flow. PET/CT with 18F-FDG can readily image acutely activated brown adipocytes that have heightened glucose utilization for thermogenesis (5,6). However, such studies to date have been limited mostly to acute BAT activation. Although β3AR stimulation has recently been shown to increase 18F-FDG uptake in WAT of rodents (15,16), whether the level of 18F-FDG uptake has sufficient accuracy to faithfully represent the magnitude of WAT browning has not been properly investigated. If 18F-FDG can be shown to be a reliable biomarker, PET/CT imaging may help foster the in vivo translation of recent molecular discoveries related to WAT browning and may provide insight on how obesity can be treated by modifying WAT metabolism. In this study, we thus investigated the ability of 18F-FDG PET/CT to monitor and quantify recruitment of beige cells into WAT depots of living mice by prolonged simulation with the selective β3AR agonist CL316,243 (5-[(2R)-2-[[(2R)-2-(3-chlorophenyl)-2-hydroxyethyl]amino]propyl]-1,3-benzodioxole-2,2-dicarboxylic acid disodium salt).
MATERIALS AND METHODS
Reagents and Cells
The β3 adrenoceptor agonist CL316,243 was from Sigma-Aldrich. Normal goat serum, 3,3′-diaminobenzidine, chromogen solution, and citrate buffer were from Dako. The enhanced chemiluminescence kit was from Pierce. Rabbit polyclonal antibodies against glucose transporter 4 (GLUT4), uncoupling protein 1 (UCP1), and cytochrome c oxidase 4 (COX4) were from Abcam. Rabbit polyclonal antibody against PR domain containing 16 (PRDM16) was from Santa Cruz Biotech, rabbit monoclonal antibody against hexokinase-II was from Cell Signaling Technology, and horseradish peroxidase–labeled polymer conjugated antibody against rabbit IgG was from Dako. Wild-type male C57BL/6 mice (8 wk old; 21 g) were from Orient Bio.
Animal Preparation and CL316,243 Treatment
All animal experiments were in accordance with the National Institutes of Health Guide for the Care and Use of Laboratory Animals and approved by the Institutional Animal Care and Use Committee. The mice were housed at a constant room temperature of 23°C with food and water given ad libitum and were fed a standard diet that contained 62.1% carbohydrate, 24.7% protein, and 13.2% fat. Each morning, the animals were intraperitoneally injected with a 1 mg/kg dose of CL316,243 (n = 16) or saline (controls; n = 8). PET/CT imaging was serially performed at baseline (day −1) and on days 1, 4, 7, and 10 of treatment.
18F-FDG Small-Animal PET/CT Acquisition and Image Analysis
The mice were kept fasting for 5 h before PET/CT studies. At 1 h after injection with CL316,243 or saline, 11.1 MBq of 18F-FDG were injected into the tail vein. Imaging was performed 1 h later under isoflurane anesthesia, using a small-animal PET/CT scanner (Inveon; Siemens) without respiratory gating. Acquisition of nonenhanced CT images was followed by emission PET imaging. Attenuation correction was not applied. Care was taken to maintain an environment of 23°C–25°C for the mice.
Polygonal regions of interest were drawn on sagittal PET/CT slices for interscapular BAT and on coronal slices for inguinal WAT. Circular regions of interest were placed in the left lung as background activity. From each region of interest, mean standardized uptake values and target-to-background ratios were measured as indices of 18F-FDG uptake.
Ex Vivo Quantification of 18F-FDG Uptake in BAT and WAT Depots
Subsets of animals were sacrificed on day 1, 4, 7, or 10 (n = 4 each), immediately after PET/CT imaging. Interscapular BAT and WAT depots were extracted. Retroperitoneal and mesenteric WAT were from the abdominal cavity delimited by serous membranes divided into retroperitoneal and intraperitoneal areas. Epididymal WAT was from the abdominopelvic depot. Tissues were weighed and measured for 18F-FDG activity on a high-energy γ counter (Parkin Elmer). Uptake levels were expressed as percentage of injected dose per gram of tissue (%ID/g). Tissues were fast-frozen until use for immunostaining and Western blots.
Immunostaining for Brown Adipocyte Markers
Tissues fixed in 4% paraformaldehyde were embedded in paraffin and microsectioned at a thickness of 5 μm. The sections were then deparaffinized in xylene and rehydrated in phosphate-buffered saline (pH 7.4). After heat-induced epitope retrieval with citrate buffer (pH 6.0) for 3 min at 121°C, endogenous peroxidase was blocked with 3% hydrogen peroxide in phosphate-buffered saline for 10 min at room temperature. Sections treated with blocking solution for 20 min at room temperature to block nonspecific binding were incubated with antibodies against UCP1 (1:100), PRDM16 (1:200), COX4 (1:200), GLUT4 (1:400), or hexokinase-II (1:50) for 60 min at room temperature. Sections washed in phosphate-buffered saline sections were incubated for 30 min at room temperature with horseradish peroxidase–conjugated antibodies against rabbit IgG. The color reaction was developed using 3,3′-diaminobenzidine substrate–chromogen solution, and the sections were lightly counterstained with Mayer hematoxylin before dehydration and mounting.
Quantitation of Brown Adipocytes by Mitochondrial UCP1 Content
Tissues minced in cold buffer containing 0.25 M sucrose and 5.0 mM N-Tris (hydroxymethyl)methyl-2-amino ethanesulfonic acid buffer (pH 7.2) were homogenized in a Dounce homogenizer. After tissue debris removal, the supernatant was centrifuged at 10,000g for 10 min at 4°C. The mitochondrial pellet was resuspended in buffer containing 20 mM Tris (pH 8.0), 1 mM ethylenediaminetetraacetic acid, 100 mM NaCl, 0.9% sodium cholate, and 1% Triton X-100 (Dow Chemical Co.).
Mitochondria were lysed by incubation for 30 min on ice followed by freeze-thawing. Mitochondrial protein was separated by 12% sodium dodecyl sulfate polyacrylamide gel electrophoresis and transferred to a polyvinylidene difluoride membrane. After blocking, the membranes were incubated overnight at 4°C with anti-UCP1 (1:1,000) or anti-COX4 antibody (1:1,000) in Tris-buffered saline (50 mM Tris, pH 7.5, 150 mM NaCl) with 0.05% polysorbate-20 containing 5% skim milk. After washing 3 times for 10 min with Tris-buffered saline Tween, the membrane was incubated with secondary antibodies for 1 h at room temperature. Immune reactive protein was detected with an enhanced chemiluminescence kit and measured for band densities.
Statistical Analysis
All data are shown as mean ± SD. Values were compared between multiple groups by ANOVA with Tukey–Kramer post hoc tests. Correlation was determined by linear regression analysis. P values of less than 0.05 were considered significant.
RESULTS
Acute Stimulation of Interscapular BAT 18F-FDG Uptake
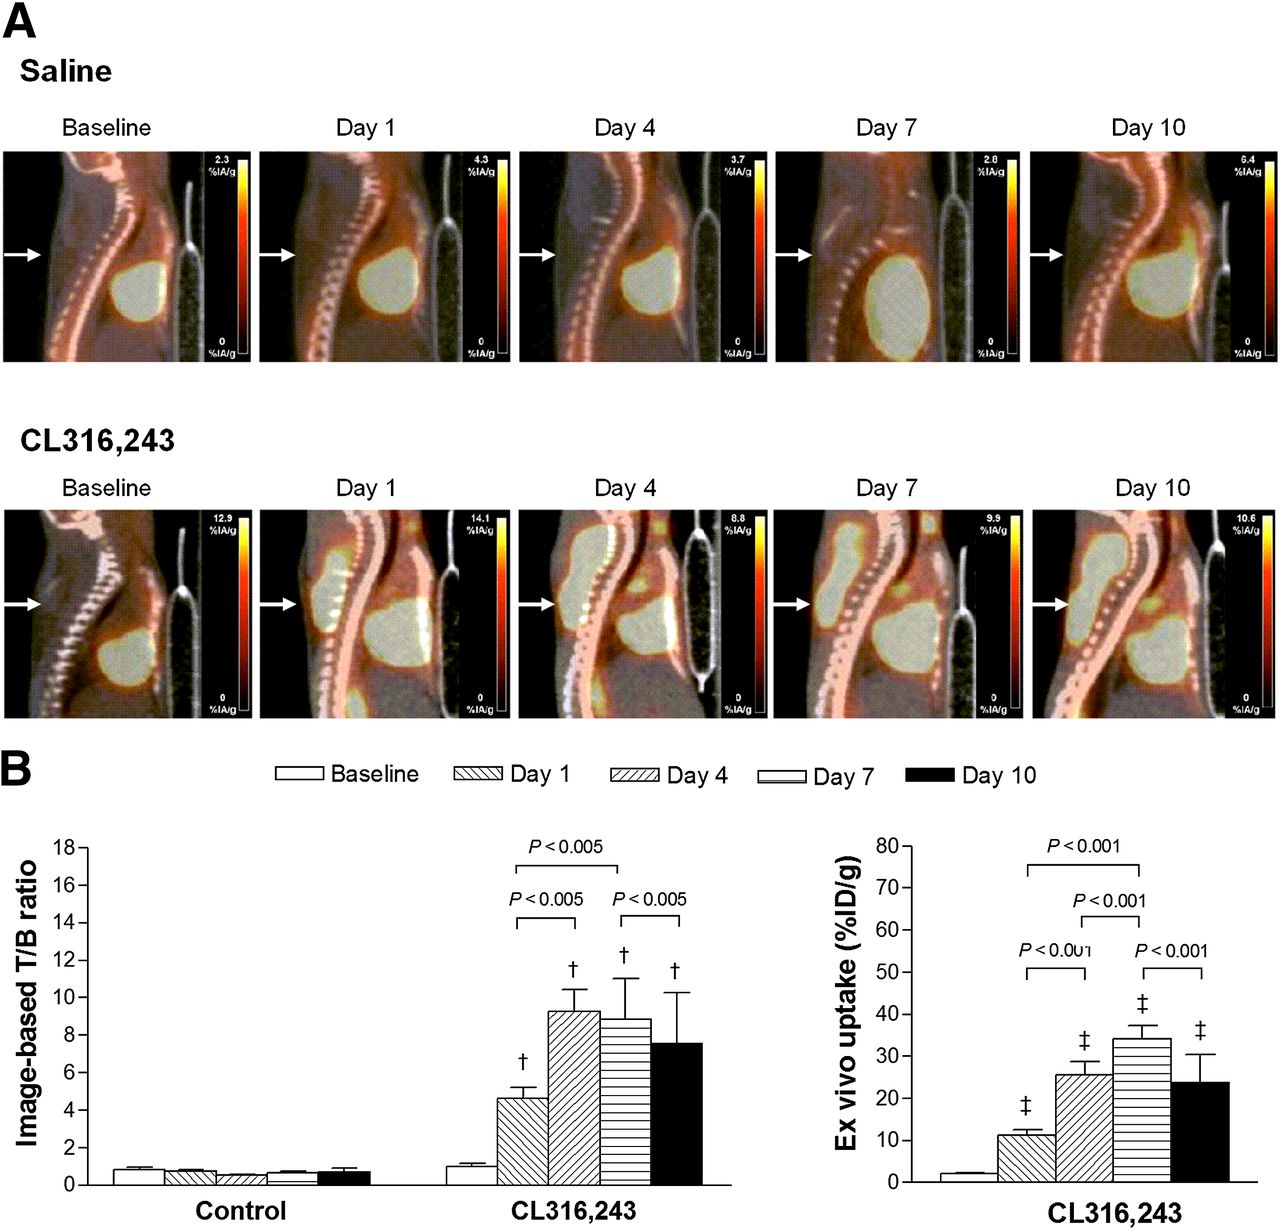
PET/CT images of interscapular fat showed no visible 18F-FDG uptake at baseline, but a single dose of CL316,243 stimulated an acute and prominent enhancement of 18F-FDG uptake and this finding recurred after each dose of CL316,243 for 10 d (Fig. 1A). Image analysis showed that the target-to-background ratio of interscapular BAT was less than 1 at baseline but was markedly increased to 4.6 ± 1.2 only 1 h after the first CL316,243 dose (Fig. 1B). Interestingly, the ratio further increased on day 4 of CL316,243 injection. Image analysis using mean standardized uptake value showed nearly identical results, with an increase from 0.7 ± 0.2 at baseline to 4.0 ± 1.3 at day 1, 5.6 ± 1.2 at day 4, 5.6 ± 1.8 at day 7, and 5.1 ± 3.0 at day 10. Ex vivo measurement of extracted tissue largely recapitulated the PET findings. Hence, ex vivo 18F-FDG uptake was markedly increased from 2.1 ± 0.7 %ID/g at baseline to 11.3 ± 2.5 %ID/g by the first CL316,243 dose and further increased to 25.6 ± 6.2 %ID/g and 34.1 ± 5.7 %ID/g on days 4 and 7, respectively. Uptake on day 10 (23.8 ± 11.5 %ID/g) returned to a level comparable to that on day 7 (Fig. 1B).

Interscapular BAT 18F-FDG uptake by β3 adrenergic stimulation. (A) Sagittal 18F-FDG PET/CT images of interscapular BAT (arrows) at baseline and during repeated saline or CL316,243 (1 mg/kg) injection. (B) Image-based target (T; interscapular BAT)-to-background (B; lung) count ratios from polygonal regions of interest (left), and ex vivo measured interscapular BAT uptake in %ID/g (right). Bars are mean ± SD of values obtained from 3 or 4 animals per group. †P < 0.005 compared with baseline CL316,243 group. ‡P < 0.001 compared with baseline CL316,243 group.
Prolonged Stimulation Increases WAT 18F-FDG Uptake
PET/CT images of inguinal WAT also showed no visible 18F-FDG uptake at baseline or after saline injections (Fig. 2A). Unexpectedly, this tissue also demonstrated increased 18F-FDG uptake by a single CL316,243 dose, although the magnitude was only modest compared with that of BAT. Stimulated uptake gradually became stronger with repeated CL316,243 doses (Fig. 2A). On image analysis, the target-to-background ratio of inguinal WAT gradually increased from 0.4 ± 0.0 at baseline to 1.2 ± 0.2 at day 1, 2.3 ± 0.2 at day 4, and 2.6 ± 0.5 at day 7 (Fig. 2B). The ratio at day 10 (2.2 ± 0.4) was similar to that at day 4. Again, mean standardized uptake value levels showed nearly identical results, with an increase from 0.3 ± 0.0 at baseline to 1.1 ± 0.3 at day 1, 1.4 ± 0.3 at day 4, 1.7 ± 0.1 at day 7, and 1.5 ± 0.3 at day 10. Ex vivo measurements largely mirrored the PET image findings (Fig. 2B).

Inguinal WAT 18F-FDG uptake by β3 adrenergic stimulation. (A) Coronal 18F-FDG PET/CT images of inguinal WAT (arrowheads) at baseline and during repeated saline or CL316,243 (1 mg/kg) injection. (B) Image-based target (T; inguinal WAT)-to-background (B; lung) count ratios (left), and ex vivo measured inguinal WAT uptake in %ID/g (right). Bars are mean ± SD of values obtained from 3 or 4 animals per group. ‡P < 0.001 compared with baseline CL316,243 group.
Epididymal and visceral WAT were evaluated by ex vivo measurements for 18F-FDG uptake and displayed temporal patterns of gradually increased uptake by prolonged stimulation similar to inguinal WAT (Supplemental Fig. 1A, available at http://jnm.snmjournals.org). Uptake was greatest for mesenteric WAT, followed by retroperitoneal WAT, and was lowest for epididymal WAT (15.3 ± 2.4, 12.3 ± 0.7, and 0.7 ± 0.3 %ID/g, respectively, at day 7). 18F-FDG uptake of BAT and WAT are compared side by side in supplemental Figure 1B.
GLUT4 and Hexokinase-II Expression in Inguinal WAT
In identifying the mediators for increased 18F-FDG uptake by β3AR stimulation, BAT displayed high expression of both GLUT4 and hexokinase-II regardless of treatment (Fig. 3). On the other hand, inguinal WAT showed low expression of both proteins at baseline. However, hexokinase-II expression was substantially increased after 10 d of stimulation, whereas GLUT4 expression was unaffected (Fig. 3).
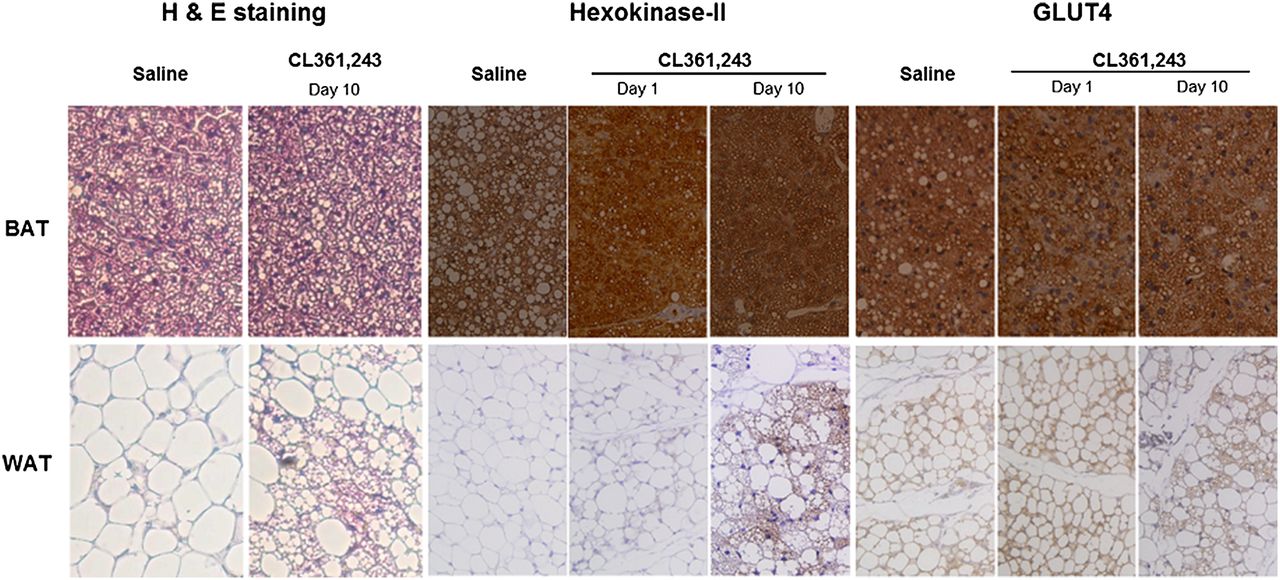
Hematoxylin and eosin staining and immunostaining of hexokinase-II and GLUT4 expression. Interscapular BAT and inguinal WAT extracted at day 1 or 10 were paraffin-embedded, microsectioned, and immunostained (hematoxylin and eosin staining, ×200; hexokinase-II and GLUT4 immunostaining, ×100).
Evidence for Brown Adipocyte Recruitment in Inguinal WAT
Inspection of hematoxylin- and eosin-stained tissue sections under a light microscope showed that interscapular BAT was filled with small brown adipocytes containing multiple small lipid droplets. In contrast, baseline inguinal WAT consisted of large, round white adipocytes with a single massive lipid droplet. After 10 d of CL316,243 injection, however, there was a substantially increased number of cells with brown adipocytelike features (Fig. 3).
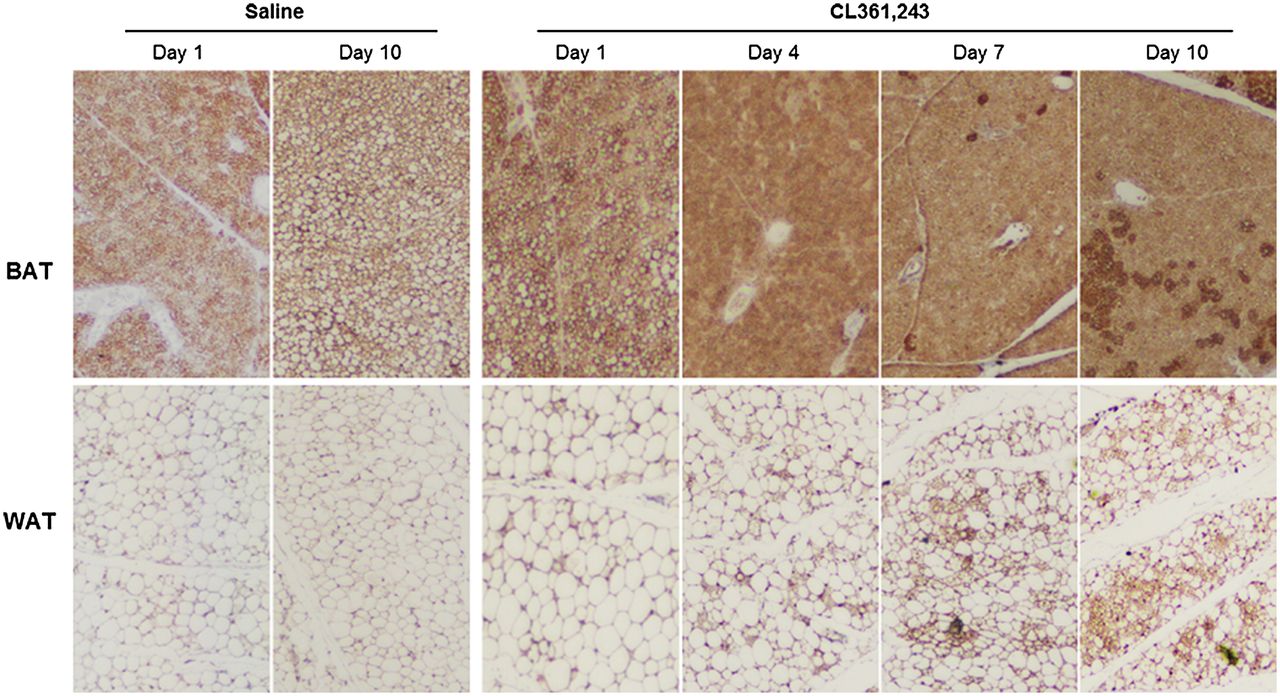
More compelling evidence of WAT browning was obtained by staining for UCP1, a thermogenic protein present exclusively in brown adipocytes. BAT showed intense UCP1 staining on abundant brown adipocytes regardless of treatment (Fig. 4). Inguinal WAT showed few UCP1-positive cells at baseline, but the number substantially increased after prolonged stimulation (Fig. 4). WAT browning was further evidenced by COX4 and PRDM16 staining. Again, inguinal WAT showed few positive cells at baseline, whereas the number of COX4- and PRDM16-stained cells significantly increased after prolonged stimulation (Fig. 5).

Immunostaining of UCP1 expression in interscapular BAT and inguinal WAT extracted at the indicated time points (×100).
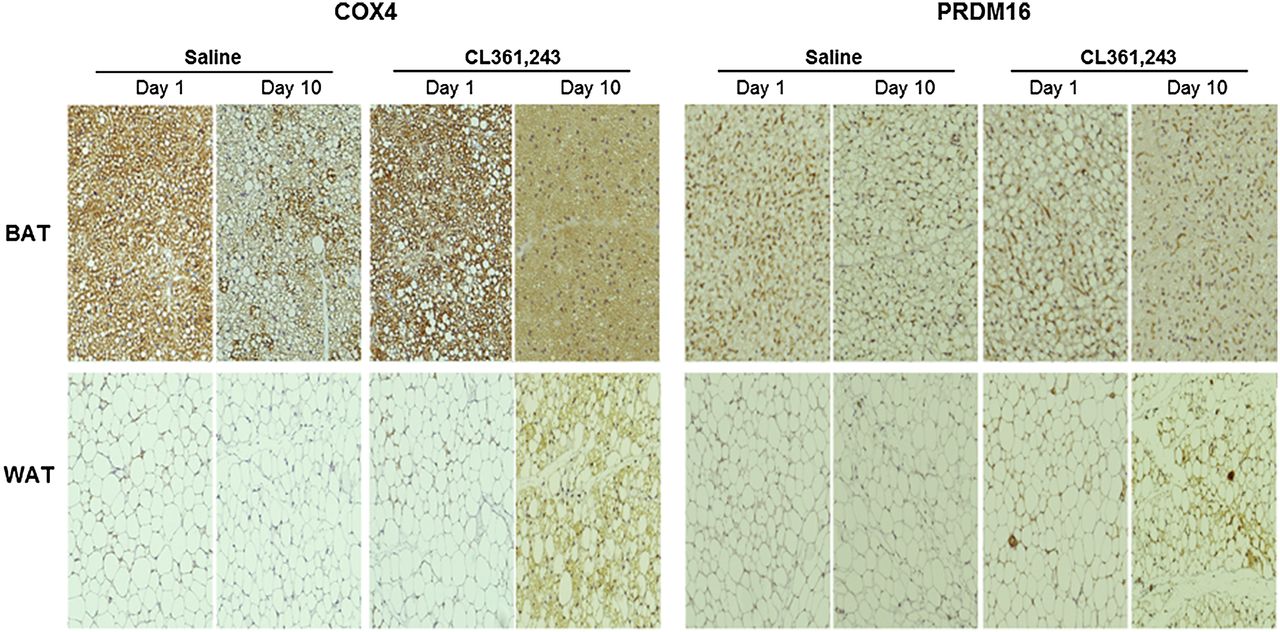
Immunostaining of COX4 and PRDM16 expression in interscapular BAT and inguinal WAT extracted at the indicated time points (×100).
18F-FDG Uptake in Stimulated WAT Correlates with UCP1 Expression
Quantitative analysis by Western blotting of mitochondrial protein confirmed a high UCP1 expression level in BAT regardless of treatment, although there were further increases with repeated CL316,243 injection (Fig. 6). Inguinal WAT showed undetectable levels of UCP1 level at baseline, but the expression level steadily and significantly increased over 10 d of repeated stimulation (Fig. 6). At day 10, the UCP1 band intensity of WAT appeared similar to that of BAT, indicating that equivalent amounts of mitochondrial protein, rather than equivalent amounts of fat tissue, have similar UCP1 content.

Quantitative measurement of UCP1 expression. At top are UCP1 Western blots of mitochondrial protein from interscapular BAT and inguinal WAT; at bottom, quantified band densities. COX4 expression was used as loading control (not shown). Bars are mean ± SD of band density relative to that of COX4 obtained from 3 or 4 animals per group. ‡P < 0.001 compared with CL316,243 group at day 1.
Finally, we evaluated whether 18F-FDG uptake could serve as a surrogate marker of WAT browning as determined by UCP1 expression. Regression analysis revealed a good correlation of WAT UCP1 expression level to PET image–based 18F-FDG uptake (Fig. 7A) and to ex vivo–measured uptake level (Fig. 7B). In vivo and ex vivo measurements of 18F-FDG uptake also showed a close correlation (Fig. 7C).

Correlation between 18F-FDG uptake and UCP1 expression. (A and B) Linear regression analysis between inguinal WAT UCP1 level and image-based (A) and ex vivo–measured (B) 18F-FDG uptake. (C) Correlation between image-based and ex vivo–measured 18F-FDG uptake. Data points are from mice treated with CL316,243 for 1 (n = 4), 4 (n = 3), 7 (n = 3), or 10 d (n = 3).
DISCUSSION
The results of this study show that 18F-FDG uptake of interscapular BAT is prominently increased by a single challenge with CL316,243, which is consistent with acute metabolic responses previously observed in mice (17,18) and humans (5,6). Interscapular BAT thus served as a positive control in our study to investigate the ability of 18F-FDG imaging to monitor beige cell recruitment into WAT.
Inguinal WAT displayed a relatively modest increase of 18F-FDG uptake by the first CL316,243 dose, but uptake was gradually enhanced by repeated stimulation to finally reach a level comparable to that of the first-dose BAT response. Mirbolooki et al. reported that WAT of rats shows an increase in 18F-FDG uptake by a single dose of CL316,243 (15). In addition, Quarta et al. treated mice with CL316,243 for 4 wk and observed an increase in inguinal WAT 18F-FDG uptake along with elevations of UCP1 protein and peroxisome proliferator-activated receptor-γ coactivator 1 mRNA expression (16). This finding suggests a link between enhanced 18F-FDG uptake and WAT browning as a result of prolonged β3 stimulation. Our study sought to further expand on these findings by a more detailed investigation to validate the potential of 18F-FDG uptake as an imaging biomarker of WAT browning.
If 18F-FDG uptake level reflects brown adipocyte recruitment, we would expect to observe a gradual increase in uptake over repeated stimulation. Therefore, we first longitudinally explored the time course of how WAT 18F-FDG uptake is enhanced during daily injections of CL316,243, a method previously shown to induce WAT browning over 10 d (14). Inguinal fat was selected for image analysis because it is better delineated by PET/CT, constitutes the biggest and physiologically most important WAT depot in mice, and is known to recruit beige adipocytes by adrenergic stimulation (14,19). On prolonged stimulation, inguinal WAT displayed only a modest increase in 18F-FDG uptake by the first dose, but the magnitude of stimulated 18F-FDG uptake gradually increased with repeated doses. By day 7, stimulated uptake became comparable to the first-dose BAT response. Of the major determinants of glucose uptake, prolonged CL316,243 stimulation significantly increased inguinal WAT expression of hexokinase-II but not GLUT4.
Because different WAT depots in mice are known to have unique biologic characteristics, including adipocyte size, protein content, and metabolic enzyme level (20), they may respond differently to browning stimulations. The beneficial effect of a drug would be limited if it induces browning only of inguinal WAT. We therefore evaluated whether the metabolic response of inguinal WAT monitored by 18F-FDG uptake was representative of other major WAT depots. Although retroperitoneal, mesenteric, and epididymal WAT showed minor differences in 18F-FDG uptake levels, all demonstrated a time course of stimulated 18F-FDG uptake that largely paralleled that of inguinal WAT. This result suggests that WAT deposits from different sites may have similar roles in thermogenesis in response to prolonged β3 stimulation.
To qualify as a useful imaging biomarker, it is crucial that quantitative image results demonstrate a close correlation to the actual biologic effect of interest. We investigated this by comparing 18F-FDG uptake levels with serial immunohistochemistry of brown adipocyte–specific markers and to UCP1 band intensities from Western blots. That the metabolic response of inguinal WAT to prolonged stimulation was indeed related to browning was verified not only by the morphologic changes observed but also by the increased staining for UCP1, the most widely used brown adipocyte–specific marker. UCP1, a mitochondrial transmembrane protein that mediates ATP production-uncoupled transfer of protons from intermembrane space to mitochondrial matrix, is present exclusively in brown adipocytes (3,4). We further confirmed WAT browning by increased expression of two other major brown adipocyte markers, COX4 and RDM16. COX4 is a mitochondrial cytochrome-c oxidase abundantly present in brown adipocytes and is a marker for oxidative phosphorylation-related gene expression (21). PRDM16 is a transcriptional complex that controls brown adipocyte formation (22) and whose overexpression has been linked to beige cell induction and increased energy expenditure (23), supporting its critical role in WAT browning.
As a measure of the magnitude of WAT browning, we used UCP1 protein band intensities obtained from Western blots. These data showed high baseline UCP1 expression in interscapular BAT, as expected. Daily CL316,243 injections further increased UCP1 levels, indicating an upregulation of UCP1 density per mitochondrion, which would account for our observed enhancement of stimulated 18F-FDG uptake in interscapular BAT by repeated stimulation. Inguinal WAT showed undetectable levels of UCP1 at baseline, raising the question of how 18F-FDG uptake in this tissue was acutely increased, albeit modestly, by a single CL316,243 injection. Although white adipocytes do not express UCP1, they do express β3ARs. In mice knocked out of these receptors, agonist-induced thermogenesis is fully restored if the receptors are reinstalled in both BAT and WAT, but not BAT alone (24). Furthermore, mice lacking UCP1 were shown to retain a significant thermogenic response to β3AR stimulation (25). These findings suggest the possibility that white fat may elicit an acute metabolic response to β3AR stimulation in a manner independent of UCP1, although the precise mechanism remains to be revealed. With repeated CL316,243 doses, UCP1 protein began to appear in inguinal WAT by day 4, followed by a continued linear increase, and finally reaching expression levels (per mitochondrial protein weight) comparable to that of BAT by day 10.
Finally, we found that UCP1 content closely correlated with image-based and ex vivo–measured 18F-FDG level before and during repeated β3AR stimulation. This indicates that 18F-FDG PET/CT can detect the thermogenic response of recruited beige adipocytes and may be able to estimate the extent of WAT browning by therapeutic agents. There was a relative decrease in WAT 18F-FDG uptake at day 10 compared with day 7 that was divergent from the stronger UCP1 protein band intensity. Possible explanations may include a reduced sensitivity of UCP1 to repeated activation by CL316,2434 or a partial shift of stimulated energy expenditure from glucose to fatty acid as substrate. However, the precise cause for this finding is not clear and will require further investigation.
Although the relevance of beige cells in humans remains to be established, recent studies show that human fat tissue previously thought to be BAT actually contain islands of brownlike adipocytes mixed within WAT, pointing to the presence of beige cells (12,26). Furthermore, in patients with retroperitoneal pheochromocytoma, abdominal visceral fat exposed to high noradrenaline concentrations for prolonged durations has shown intense 18F-FDG uptake (27). These findings suggest that beige adipocytes may be of potential significance in human subjects, as they are in mice.
CONCLUSION
Our results demonstrate that 18F-FDG PET/CT has the capacity to monitor brown adipocyte recruitment into WAT depots in vivo. Imaging 18F-FDG uptake may thus be useful for screening the efficacy of strategies to promote WAT browning and for delineating its impact on energy expenditure by glucose utilization.
DISCLOSURE
The costs of publication of this article were defrayed in part by the payment of page charges. Therefore, and solely to indicate this fact, this article is hereby marked “advertisement” in accordance with 18 USC section 1734. This work was supported by grant SMX1131891 from the Samsung Biomedical Research Institute. No other potential conflict of interest relevant to this article was reported.
Footnotes
Published online Dec. 18, 2014.
- © 2015 by the Society of Nuclear Medicine and Molecular Imaging, Inc.
REFERENCES
- Received for publication August 22, 2014.
- Accepted for publication November 24, 2014.


Jump to section
Related Articles
Cited By...
- Manipulating mitochondrial dynamics in the NTS prevents diet-induced deficits in brown fat morphology and activity
- SUMO-specific protease 2 (SENP2) suppresses browning of white adipose tissue through C/EBP{beta} modulation
- Role of Brown Fat in Lipoprotein Metabolism and Atherosclerosis
- Brown adipose tissue: a potential target in the fight against obesity and the metabolic syndrome