


Visual Abstract

Abstract
The poly(adenosine diphosphate–ribose) polymerase inhibitors (PARPi) have demonstrated efficacy in ovarian, breast, and prostate cancers, but current biomarkers do not consistently predict clinical benefit. 18F-fluorthanatrace (18F-FTT) is an analog to rucaparib, a clinically approved PARPi, and is a candidate biomarker for PARPi response. This study intends to characterize 18F-FTT pharmacokinetics in breast cancer and optimize image timing for clinical trials. A secondary aim is to determine whether 18F-FTT uptake in breast cancer correlates with matched frozen surgical specimens as a reference standard for PARP-1 protein. Methods: Thirty prospectively enrolled women with a new diagnosis of breast cancer were injected with 18F-FTT and imaged dynamically 0–60 min after injection over the chest, with an optional static scan over multiple bed positions starting around 70 min. Kinetic analysis of lesion uptake was performed using blood-pool activity with population radiometabolite corrections. Normal breast and normal muscle reference tissue models were compared with PARP-1 protein expression in 10 patients with available tissue. Plasma radiometabolite concentrations and uptake in tumor and normal muscle were investigated in mouse xenografts. Results: Pharmacokinetics of 18F-FTT were well fit by Logan plot reference region models of reversible binding. However, fits of 2-tissue compartment models assuming negligible metabolite uptake were unstable. Rapid metabolism of 18F-FTT was demonstrated in mice, and similar uptake of radiometabolites was found in tumor xenografts and normal muscle. Tumor 18F-FTT distribution volume ratios relative to normal muscle reference tissue correlated with tissue PARP-1 expression (P < 0.02, n = 10). The tumor–to–normal muscle ratio from a 5-min frame between 50 and 60 min after injection, a potential static scan protocol, closely corresponded to the distribution volume ratio relative to normal muscle and correlated to PARP-1 expression (P < 0.02, n = 10). Conclusion: This study of PARPi analog 18F-FTT showed that uptake kinetics in vivo corresponded to expression of PARP-1 and that 18F-FTT quantitation is influenced by radiometabolites that are increasingly present late after injection. Radiometabolites can be controlled by using optimal image acquisition timing or normal muscle reference tissue modeling in dynamic imaging or a tumor–to–normal muscle ratio. Optimal image timing for tumor–to–normal muscle quantification in humans appears to be between 50 and 60 min after injection. Therefore, a clinically practical static imaging protocol commencing 45–55 min after injection may sufficiently balance 18F-FTT uptake with background clearance and radiometabolite interference for quantitative interpretation of PARP-1 expression in vivo.
The poly(adenosine diphosphate–ribose) polymerase (PARP) family of enzymes has many functions, with PARP-1 as a major enzyme involved in single-stranded DNA break repair (1). In cancer, PARP-1 can protect against intrinsic DNA damage and DNA-damaging treatments designed to target rapidly proliferating cells. Therefore, any PARP inhibitor (PARPi) intended to remove this protection can leverage dependence on PARP-1 for DNA repair to inhibit tumor growth. These inhibitors have become widely integrated into clinical paradigms in ovarian, breast, pancreatic, and prostate cancers.
Response to PARPi remains variable, even when used in the setting of germline pathogenic mutations such as BRCA, which is thought to predispose tumors to drugs targeting DNA repair pathways (2,3). Homologous recombination deficiency scores used to predict PARPi sensitivity in breast cancer (4,5) and other cancers (6) also have limited accuracy. As such, biomarkers for tumor response to PARPi are needed clinically.
18F-fluorthanatrace (18F-FTT) is a radiolabeled PARPi (rucaparib) analog used for PET imaging (7). In vivo studies in ovarian cancer demonstrated 18F-FTT uptake correlated with in vitro PARP-1 expression (8). In vitro data demonstrated that PARP-1 expression, quantified by radioligand binding, correlated positively with PARPi cytotoxicity (9) and that PARP-1 expression is required for PARPi efficacy (8–12). In breast cancer, 18F-FTT uptake varies across subtypes (estrogen receptor–positive, triple-negative, and human epidermal growth factor receptor 2–positive) independent of pathogenic germline mutations, demonstrating varying levels of drug targeting, including in the populations thought to be most susceptible to this therapeutic drug (13). In addition, 18F-FTT uptake is suppressed shortly after administration of PARPi, suggesting that 18F-FTT can visualize drug–target engagement (14). A pilot study in ovarian cancer suggests that 18F-FTT may also predict clinical response to PARPi (15).
Quantitative assessment of 18F-FTT PET images with the goal of predicting PARPi response requires an understanding of tracer kinetics and metabolism to guide image analysis and development of clinically practical imaging protocols. Prior analysis in ovarian cancer found reversible binding kinetics in tumor and that the total volume of distribution (VT) from a 2-tissue compartment model, using a metabolite-corrected blood input function, and the distribution volume ratio relative to normal muscle (DVRM) from a reference tissue model (16) both correlated with PARP-1 expression in tumor samples (17). DVRM was especially promising: It does not require invasive blood sampling and appeared more robust than the 2-tissue compartment model, which appeared to be influenced by nonspecific binding and uptake of radiometabolites, which were most apparent more than 100 min after injection. Static uptake measures from single 5-min frames 55 and 110 min after injection also correlated with PARP-1 expression and presented an option for clinical imaging.
Although a PARPi can have variable efficacy in different tumor types, it is unknown whether its pharmacokinetics or pharmacodynamics vary by tumor type. Therefore, we sought to investigate the binding kinetics of 18F-FTT to PARP-1 in breast cancer, both to inform ongoing clinical trials and as a comparator to kinetics in ovarian cancer. Unlike ovarian tumors, which have proximity to major blood vessels and 18F-FTT excretory organs in bowels, where activity can spill over to tumor, primary breast cancers occur away from major vessels and tracer excretion pathways. Reference regions used to normalize tumor uptake ideally have low levels of specific binding, have nonspecific binding similar to tumor, and quickly reach a stable distribution volume (16). Skeletal muscle and normal breast are 2 potential reference regions for primary breast cancers, because both have low to moderate natural PARP-1 expression with relatively low variability in humans (18).
Herein, we examine radiotracer kinetics in 30 primary breast cancer patients across a range of breast cancer phenotypes, initially described in McDonald et al. (13), and correlate uptake with assays of PARP-1 expression on surgical tumor samples obtained in a subset of 10 patients. We also investigate 18F-FTT metabolite uptake into tumor and normal muscle using mouse xenograft models for breast cancer, comparing the uptake of parent with that of radiometabolites. These results provide support for 18F-FTT as a noninvasive, quantitative biomarker for PARP-1 suitable for cancer imaging within standard clinical workflows.
MATERIALS AND METHODS
Clinical Trial
Patients were recruited and consented to this study, 18F-FTT PET/CT in Breast Cancer (NCT03083288), between May 2017 and October 2018 (13). Inclusion criteria included a new diagnosis of breast cancer with a primary tumor single diameter measuring at least 1 cm on conventional imaging and no prior treatment. Subjects had to be at least 18 y old, not pregnant, and willing to undergo 18F-FTT PET/CT. Surgical specimen collection of untreated tissue was planned for patients undergoing primary surgery before treatment, and the specimens were stained as previously described (14). The study’s primary aim was prospectively designed to test the association of 18F-FTT uptake in primary tumors with in vitro PARP-1 expression in untreated surgical tissue. Approval was granted by the University of Pennsylvania Institutional Review Board and Cancer Center Clinical Trials Scientific Review and Monitoring Committee. Informed consent was obtained for all patients.
18F-FTT PET/CT Imaging
18F-FTT was synthesized at the University of Pennsylvania Cyclotron Facility as previously described (19), with a specific activity of 192.5 ± 105.0 MBq/µmol and radiochemical purity of 99.7% ± 0.7%. Studies were performed on an Ingenuity TF PET/CT system (Philips Healthcare). Dynamic PET image acquisition centering over the breasts began just before the injection of 351–434 MBq (9.5–11.7 mCi) of 18F-FTT and continued for 1 h in a single bed position. An optional static PET/CT scan was acquired afterward, at start times varying between 65 and 90 min after injection, from skull base to as low as mid-thighs across 4–10 bed positions at 3 min per bed position, with tumors imaged 76 ± 6 min (range, 70–95 min) after injection. Images were reconstructed using the manufacturer’s software with time-of-flight information and physical data corrections (e.g., scatter and attenuation) via an iterative maximum-likelihood expectation maximization algorithm (20). A 4 mm3 voxel was used, with 3 iterations and 33 subsets, without applying a point-spread function or smoothing after reconstruction. Dynamic images were reconstructed into 50 frames (24 × 5 s, 6 × 10 s, 3 × 20 s, 2 × 30 s, 5 × 60 s, and 10 × 300 s).
Image Analysis
Quantitative analysis of PET radiotracer uptake was performed in PMOD version 3.7 (PMOD Technologies Ltd.). The 1 cm3 sphere SUVpeak was calculated on each image frame within a spheric volume of interest placed over tumor, referencing CT and prior breast imaging (21). Tumor volumes of interest were expanded to contain minor patient motion when necessary. Nonspecific binding or background was estimated from the mean radiotracer concentration in normal breast, measured in a 25-mm-diameter spheric volume of interest placed in contralateral breast or in a smaller noncancerous region of ipsilateral breast for 1 patient with contralateral mastectomy. Normal muscle activity was calculated in a 20-mm-diameter left latissimus dorsi volume of interest, the largest consistently available muscle within the dynamic field of view. Blood-pool activity was estimated with a dynamic 1 cm3 SUVpeak within a 20-mm-diameter left ventricle search window. Tumor dimensions were measured using cross-sectional imaging (CT or MRI) for partial-volume correction. Partial-volume correction was performed on tumor uptake values using normal breast background and recovery coefficient curves for spheres (22). Tumor–to–normal tissue activity ratios were calculated by dividing tumor SUV by background SUV.
Kinetic Analysis
On the basis of prior kinetic studies indicating reversible binding to PARP-1 (17), we estimated 18F-FTT binding to tumor PARP-1 with VT and DVR. Two-tissue compartment and Logan plot graphical models with blood inputs (23) were used to estimate VT. Individuals’ image-derived blood curves were fitted with a triexponential function and corrected using published population values for plasma partitioning (plasma to whole blood activity ratio = 1.26) and metabolism (sigmoid function ([1 − t3/(t3 + 106.504)]0.053 + 10−8)/(1 + 10−8), with time after injection t in seconds), assuming no uptake of metabolites (17). For Logan plot graphical analysis, kinetics in tumor and normal tissues were recalculated without metabolite correction. A fixed blood volume fraction of 4% was used for breast tumors (24). Blood volume fractions of 2% were used for normal breast and normal muscle, based on values for adult women derived from International Commission on Radiological Protection publication 89 (25). Fitting parameters are available in Supplemental Table 1 (supplemental materials are available at http://jnm.snmjournals.org). Fitting was performed with the Levenberg–Marquardt algorithm, using Poisson weighting and corrections for frame duration and mid-time. Compartmental and graphical modeling was repeated with truncated tissue data to evaluate robustness.
Kinetic analysis using the Logan reference tissue model provided an estimate of DVR using a reference tissue time–activity curve and population average k2′ (16). Individual k2′ values were calculated on dynamic scans using the multilinear reference tissue model by Ichise et al. (26), with t* of 20 min, and averaged to reduce noise, excluding physiologically meaningless negative k2′ values.
Static Analysis
Static uptake measures obtained from 5-min dynamic imaging frames were used to approximate scans that may be obtained in routine clinical care. Tumor kinetic parameters were compared with SUV and tumor–to–normal tissue ratios to select an ideal approximation of 18F-FTT pharmacokinetics.
Radiometabolite Uptake in Mouse Tissue
Mice with implanted breast cancer, derived from triple-negative HCC-1806 or estrogen-receptor–positive MCF-7 cell lines or patient-derived xenograft tissue, were used to investigate tissue uptake of 18F-FTT radiometabolites under University of Pennsylvania Institutional Animal Care and Use Committee protocol 806483. Both HCC-1806 and MCF-7 cells have significant PARP-1 expression and sensitivity to PARPi (27,28). Mice with patient-derived xenografts were censored from tumor metabolite comparisons because of the heterogeneity of their tumor samples but were retained for blood and muscle analysis. Mice were injected with 6–13 MBq of 18F-FTT, optionally imaged, and killed to retrieve blood, tumor, and normal muscle samples for metabolite analysis. Tumor samples were confirmed with hematoxylin and eosin staining. Full methods are provided in the supplemental materials.
Statistical Analyses
Kinetic and static 18F-FTT PET uptake measurement correlations with ex vivo PARP-1 measurements are reported for nonparametric Spearman rank correlation given the limited sample size; however, results were similar using Pearson correlations. Statistical analyses used SPSS version 28 (IBM), with significance assessment based on a 2-sided α of 0.05, without corrections for multiple comparisons.
RESULTS
Study Participant Characteristics
Thirty-two patients with newly diagnosed breast cancer consented, and 30 completed 18F-FTT PET/CT without reported adverse events. Two subjects were excluded, 1 who declined imaging and 1 who had an unexpected positive pregnancy test. Participant and tumor characteristics for the 30 patients who underwent 18F-FTT PET/CT are summarized in Table 1. Tissue was procured for ex vivo analysis in 10 of 12 patients undergoing surgery before treatment. The mean tumor diameter range was 11–72 mm (median, 24 mm). Eight patients were identified as having pathogenic germline mutations.
Study Participant and Tumor Characteristics
Measurements of 18F-FTT Uptake
A range of 18F-FTT uptake was observed. Representative images of elevated 18F-FTT uptake 55–60 min after injection are shown in Figure 1. Tumor dynamic time–activity curves are in Figure 2 for patients with tissue sampling and in Supplemental Figure 1 for those without tissue sampling. Median SUVpeak at 55–60 min was 3.9 g/mL (range, 2.0–9.2 g/mL). SUVpeak and characteristics of primary breast malignancies are provided in Supplemental Tables 2 and 3. Additional characteristics, including SUVmax, receptor subtype, and germline mutations, have been reported (13). Similar but somewhat noisier findings were observed in this study when using SUVmax.

CT, PET, and fused images of 18F-FTT uptake in ER+ breast cancer in patient 6. Arrows indicate tumor on CT image (left) and corresponding PET and fused images (center and right). PET and fused images are scaled 0–5 g/mL, and CT image is scaled from −160 to +240 Hounsfield units.

Individual tumor SUVpeak time–activity curves for 10 patients with surgical specimens.
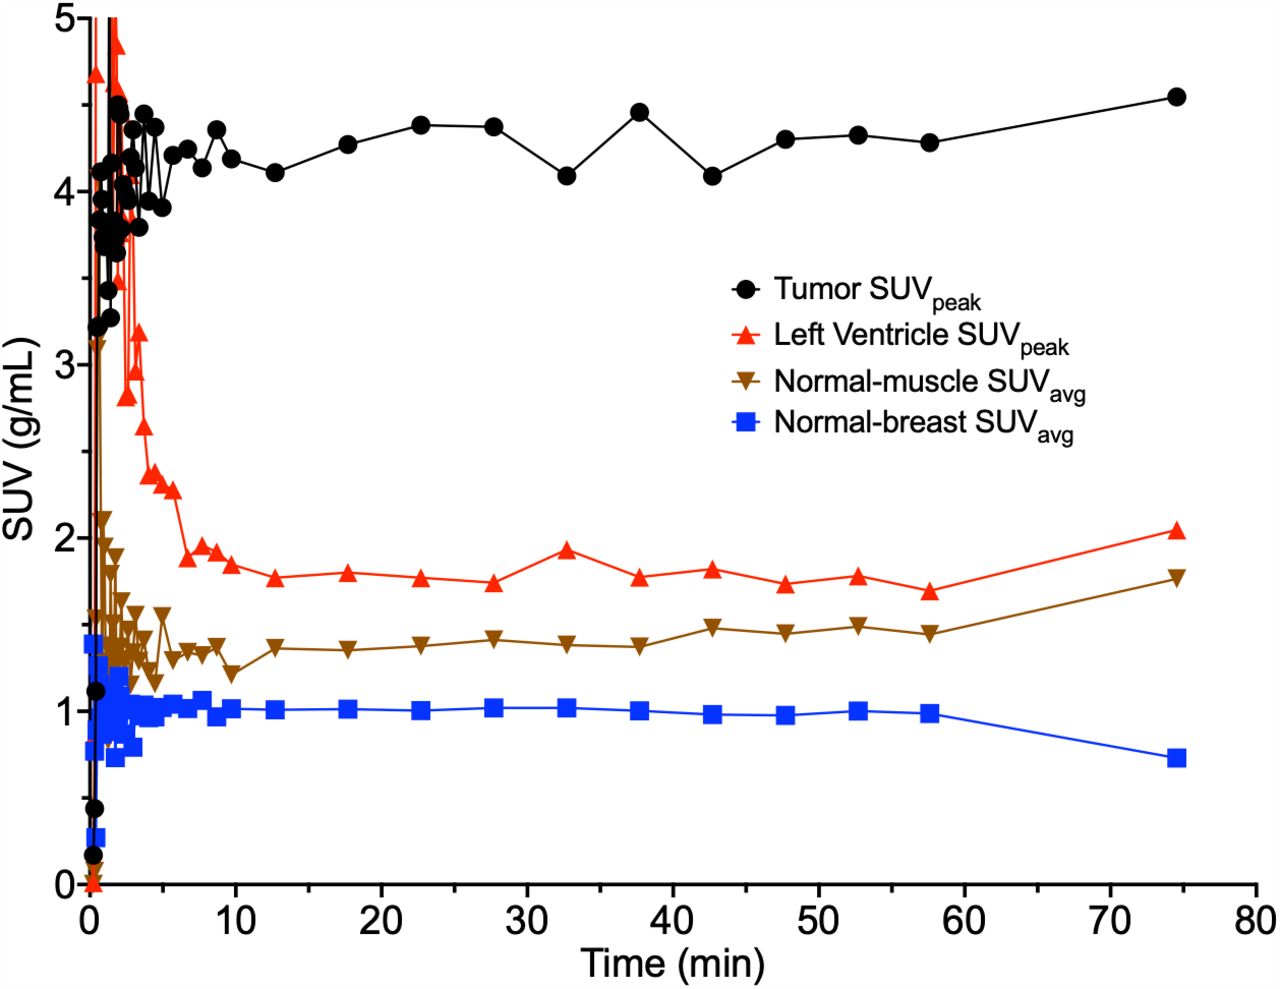
Background uptake time–activity curves in muscle and normal breast reached a stable plateau within 10 min of injection and converged by 30 min to near-blood-pool activity for muscle and approximately 0.5-times-blood-pool activity for normal breast (Fig. 3; Supplemental Figs. 2 and 3). Population coefficients of variation were lowest for normal muscle, at 0.16, from 55 to 60 min after injection, followed by blood pool at 0.21 and normal breast at 0.38.

Tumor, blood-pool, and reference tissue time–activity curves for example patient (patient 9) with moderate 18F-FTT tumor uptake.
Several tumor uptake measurements had an unexpectedly large increase in several cases or a decrease in a few cases from the end of the dynamic scan to the static scan (Fig. 2; Supplemental Fig. 1). Patient motion during repositioning between the dynamic and the static scans may account for this, and we found increases in the late muscle and blood curves in some patients (Supplemental Figs. 2 and 4).
Kinetic Analysis Fitting
Tumor time–activity curves (Fig. 2) were inconsistently fit by a reversible 2-tissue compartment model (r2 = 0.65 ± 0.24), especially when late time points were included (Supplemental Fig. 4). Time–activity curves were better fit by graphical methods with the 60-min dynamic data, including a reference tissue model to calculate DVR (Supplemental Fig. 5), with fewer instances of parameter values outside the expected physiologic range than for the compartment model (Supplemental Table 5). Logan plot graphical analysis with blood inputs was linear after a t* of 20 min. Goodness of fit measured by a χ2 test worsened after metabolite correction for both tumor and normal tissues (Supplemental Table 6), potentially suggesting radiometabolite uptake. Logan reference tissue modeling used multilinear reference tissue model estimates of population normal breast (k2′ = 0.14 ± 0.14 min−1, n = 24) or normal muscle (k2′ = 0.08 ± 0.09 min−1, n = 29) and was linear at t* equal to 20 min. Consistent with examination of the raw uptake curves, Logan plot graphical analysis demonstrated more consistent fits, less variability, and lower error for muscle than for normal breast tissue (Supplemental Tables 6 and 7). Modeling using truncated data showed greater stability for time–activity curves that included data from 0 to 40-plus min but excluded data from the static scan (Supplemental Figs. 6 and 7).
Correlation of In Vivo 18F-FTT Uptake with PARP-1 Expression
In patients with primary surgical tissue (n = 10), uptake measures were compared with PARP-1 immunofluorescence (Table 2; Supplemental Fig. 8). Both DVR measures correlated well with tissue PARP-1 expression (DVR relative to normal breast, ρ = 0.73, P = 0.02; DVRM, ρ = 0.72, P = 0.02, without corrections for multiple comparisons). To develop a clinically feasible imaging protocol, static uptake measures of tumor SUVpeak and SUVpeak normalized to muscle and breast were correlated with tissue data, with similar results. Comparisons of correlation robustness between uptake parameters and PARP-1 expression at alternate static and dynamic imaging time points are in Supplemental Fig. 9.
Correlations Between Tumor 18F-FTT Uptake and PARP-1 Immunofluorescence
Radiometabolite Uptake in Mouse Xenografts
Eleven mice were injected with 18F-FTT: 5 with patient-derived xenografts, 4 with HCC-1806 xenografts (excluding 1 because of injection technique), and 2 with MCF-7 xenografts. Mouse metabolism of 18F-FTT was rapid (Fig. 4; Supplemental Fig. 10), reaching up to 43% radiometabolites in plasma by 10 min after injection and up to 91% radiometabolites by 60 min. Tumor models demonstrated preferential uptake of 18F-FTT parent, with only 7% radiometabolites 17 min after injection, increasing to 42% of activity by 60 min. Mouse tumor had high levels of PARP-1 expression, as seen by immunohistochemistry (Supplemental Fig. 11).

Comparative imaging, staining, and radio–high-performance liquid chromatography (radioHPLC) analysis for HCC-1806 xenograft mouse. (A) 18F-fluorthanatrace PET/CT imaging. (B) Hematoxylin and eosin staining and immunohistochemical staining for PARP-1. (C) Tumor radioHPLC. (D) Parent fractions in sampled tissues and blood. Mouse was imaged 43–53 min after injection and killed for tissue sampling and radiometabolite analysis at 60 min. PET image is scaled 0–1 MBq/cm3, and CT image is scaled from −1,000 to +1,000 Hounsfield units. Tumor (arrow) had central necrosis, so periphery with elevated 18F-FTT uptake was used for radioHPLC.
Normal muscle radiometabolite uptake fraction was closer to that of tumor but with slightly reduced preferential uptake of parent. In 3 HCC-1806 and 2 MCF-7 xenograft mice with both tumor and muscle samples, the parent percentage in the tumor was 1–1.2 times the parent percentage in muscle.
To compare absolute concentrations of parent and radiometabolites, in 1 mouse with an HCC-1806 xenograft and high PARP-1 expression (Fig. 4), activity concentrations were calculated in muscle and active tumor and multiplied by parent or metabolite fractions from tissue collected at death. The activity concentration of radiometabolites in active tumor was 1.3 percentage injected dose per cubic centimeter, compared with 1.0 percentage injected dose per cubic centimeter in muscle, for a ratio of 1.3. In comparison, the absolute parent concentration was 2 times higher in tumor than in muscle, 1.8 and 0.9 percentage injected dose per cubic centimeter, respectively, signaling specific uptake of parent compared with radiometabolites in tumor.
DISCUSSION
To inform clinical trials of 18F-FTT in breast cancer, we studied PET 18F-FTT uptake and examined assumptions with regard to its metabolism to inform imaging protocols and analyses. We noted reversible binding fit by reference region graphical methods, and the data suggest that a static imaging protocol beginning 45–55 min after injection may provide a clinically accessible protocol (akin to that of 18F-FDG) that maximizes background clearance with acceptable quantitative interpretation, with tissue correlation studies in support of these measures. On the basis of these results, an ongoing multicenter trial imaging 18F-FTT in breast cancer (NCT05226663) has transitioned to static imaging starting around 45–50 min to capture tumor uptake within the 50- to 60-min window.
This supports 18F-FTT as a noninvasive marker of PARP-1 expression in breast cancer, the primary drug target of PARPi. The binding properties of PARPi are unclear and potentially work by different mechanisms (17,29). Rucaparib is thought to allosterically bind to active PARP-1 in contact with DNA, creating complexes that accelerate DNA damage (11); however, the stability of such complexes is poorly understood. Reversible binding of 18F-FTT is consistent with rucaparib, its PARPi analog, which has less potent trapping than a PARPi such as talazoparib or niraparib (12,29).
Variable late uptake of 18F-FTT confounded parameter estimates of VT, suggesting a need to control for radiometabolites that have been identified in our prior human studies (17). Radiometabolites are a common influence on radiotracer studies targeting somatic tissue, where, unlike in brain imaging with an intact blood–brain barrier, there may not be barriers to metabolite uptake. We confirmed significant radiometabolite uptake in tumor in mouse xenograft models, potentially artificially biasing compartmental kinetic estimates toward irreversibility (k4→0) because of late radiometabolites mistaken as retention of parent. Potential radiometabolite uptake in humans was also observed in the worsened blood input model fitting for tumor and normal tissues after metabolite correction based on the assumption of negligible metabolite uptake, and this may bias our reported VT measurements for the 18F-FTT parent compound. Although our mouse models showed more rapid metabolism of 18F-FTT than did humans (∼80% metabolites in mice vs. 40% metabolites in humans at 60 min), the mouse data imply a nonnegligible contribution of radiometabolites to tumor activity after 60 min. Accounting for the effect of these metabolites in tissue is therefore important in obtaining reliable quantitative estimates of PARPi binding to tumor using 18F-FTT PET. These analyses may also inform use of tumor–to–normal muscle ratios in mouse imaging, which have been useful in studying PARPi pharmacology (15).
Our data suggest that normal muscle is a suitable reference tissue for tumor, with rapid equilibrium with plasma activity and late convergence to blood-pool activity. This is consistent with our xenograft study, which suggests that radiometabolite uptake is similar in tumor and normal muscle. Tumor DVRs based on normal muscle as a reference region were more stable and more robust than VT estimates from compartmental analysis and maintained high correlations with ex vivo PARP-1 expression across imaging time points, including after 60 min.
A late torso scan performed after dynamic imaging led to inconsistent and variable tumor uptake data, predominantly seen as an unexpected increase in measured tumor uptake from the end of the dynamic scan to the late static acquisition. This is potentially due to several factors, including statistical noise, motion artifacts, or repositioning of the patient. However, we also noted a late increase in muscle activity in most patients and blood activity concentration in some patients. This could potentially reflect radiometabolite uptake or recirculating parent compound coming from enterohepatic circulation that has been seen with steroid imaging agents (30), and it provides further impetus for imaging earlier after injection.
The t* for the reference tissue model of 20 min suggests that the tumors and normal tissues have reached pseudoequilibrium with parent 18F-FTT. Examination of the normal muscle time–activity curves suggests pseudoequilibrium by this same time, confirmed by Logan plots of the muscle uptake and non–metabolite-corrected blood clearance curves. In contrast, inter- and intrapatient variability in breast tissue density and high uptake in fibroglandular versus fatty tissue made normal breast tissue untenable as a reference standard. Therefore, in the interest of repeatability and translation to other cancers, our recommendation is to use DVRM for dynamic studies in breast cancer.
Although our mouse and human data support the use of normal muscle as a reference tissue to correct for labeled metabolites, especially for later scans, the nature of the radiometabolites and the extent to which they may be trapped in tissue are unknown. Clarifying the properties of these radiometabolites may be helpful for interpreting 18F-FTT and would require dynamic studies with tissue and blood sampling and metabolite analysis to compare metabolite concentrations over time. We tested alternative compartment models with separate tissue compartments and blood inputs for the parent compound and metabolites but with inconsistent results and negligible improvements in fitting. Future work in describing 18F-FTT pharmacokinetics may find that characterization of these radiometabolites is necessary for cancers located in tissues without a suitable reference region. In addition, our model used a low fixed blood volume fraction, because breast tumors are generally not highly vascularized; however, the presence of some tumor time–activity curves with rapid perfusion and early washout suggests that models incorporating a variable blood volume fraction may better describe some tumors.
Our studies inform the optimal timing of static imaging, a more clinically feasible approach to 18F-FTT imaging, to provide a quantitative estimate of PARPi binding and PARP-1 expression in tumors. Our findings suggest that times after 45 min provide suitably low blood-pool activity for tumor uptake visualization and are well after the establishment of pseudoequilibrium of tumor uptake and blood clearance. Our data also suggest an increasing fraction of radiometabolites in tumor tissue over time. Taken together, these finding suggest an optimal uptake time of 50–60 min for static 18F-FTT PET imaging in breast cancer. This is achievable for breast cancer imaging by beginning a static scan 45–55 min after injection, allowing time for scanner travel from the skull to the chest. Both tumor SUV and tumor–to–normal muscle activity ratios correlate with PARP-1 expression. The surprising result that SUV alone has similar performance may reflect the consistency of blood clearance and tracer metabolism across patients. However, normalization may be especially useful for static imaging of patients on therapeutic PARPi or other drugs that might alter 18F-FTT clearance and metabolism. SUV ratio metrics also depend less on scanner calibration, a potential benefit for multicenter trials.
CONCLUSION
18F-FTT uptake in breast cancer correlated with PARP-1 expression and was well described by reference region models and static measurements. Variable late radiotracer uptake, partly because of labeled metabolites, confounds kinetic parameter estimation, supporting earlier imaging. Normalization to muscle can be used to control for potential variability in 18F-FTT metabolism and blood clearance between patients or over time in the same patient. Overall, these studies suggest an optimal tumor imaging time beginning 45–55 min after injection that maximizes blood clearance but avoids a large influence of metabolites. These results complement our prior findings in ovarian cancer, suggesting that these imaging protocols suitable for clinical use may be applicable to multiple solid tumor types.
DISCLOSURE
Financial support for design and conduct of this study was provided by the Department of Defense (BC190315, R37CA277541, 1-R01-CA-258717-01, and R01-CA259037) and a Cooper Scholar Award from the Abramson Cancer Center. Michael Farwell reports receiving grants from Merck and Bristol Myers Squibb. Robert Mach reports receiving personal fees from Five Eleven Pharma; having a patent pending for 211At-targeted radiotherapy based on PARP-1; being a cofounder of and having a U.S. patent license for Trevarx Biomedical, Inc., a company with a license to the patent for the PET imaging agent used in this study; being a cofounder of Accuronix Therapeutics and Vellum Biosciences; and serving on the scientific advisory board of Cognition Therapeutics. David Mankoff reports that his spouse is the chief executive officer of Trevarx. Erin Schubert, spouse of Robert Doot, has been a paid consultant for Trevarx. No other potential conflict of interest relevant to this article was reported.
KEY POINTS
QUESTION: Does 18F-FTT uptake describe PARP-1 expression in breast cancer, and what is the PET imaging protocol that maximizes its potential use as a biomarker in clinical trials?
PERTINENT FINDINGS: 18F-FTT can serve as a biomarker for PARP-1 expression in breast cancer. Tumors can show increasing 18F-FTT radiometabolite uptake over time, and normalization to muscle can reduce radiometabolite impact on quantitation.
IMPLICATIONS FOR PATIENT CARE: Ongoing clinical trials of PARPi could benefit from standardized PET imaging of 18F-FTT beginning 45–55 min after injection.
ACKNOWLEDGMENTS
We thank the patients in this study for their participation and Meryl Weinreb, a Komen Patient Advocate in Science, for helpful discussions and study review. We are grateful to the University of Pennsylvania Cyclotron Facility for radiotracer production and Kuiying Xu for chemical synthesis of the tracer precursor. We appreciate Eric Blankemeyer and the University of Pennsylvania Small Animal Imaging Facility for help with mouse imaging. We thank Theresa E. Berger and Aladdin Riad for help with data collection. We also thank Sean Preston and Mary Leonard for assistance with graphic design.
Footnotes
Published online Oct. 30, 2024.
- © 2024 by the Society of Nuclear Medicine and Molecular Imaging.
REFERENCES
- Received for publication June 17, 2024.
- Accepted for publication September 11, 2024.
In this issue


Jump to section
Related Articles
Cited By...
- No citing articles found.