


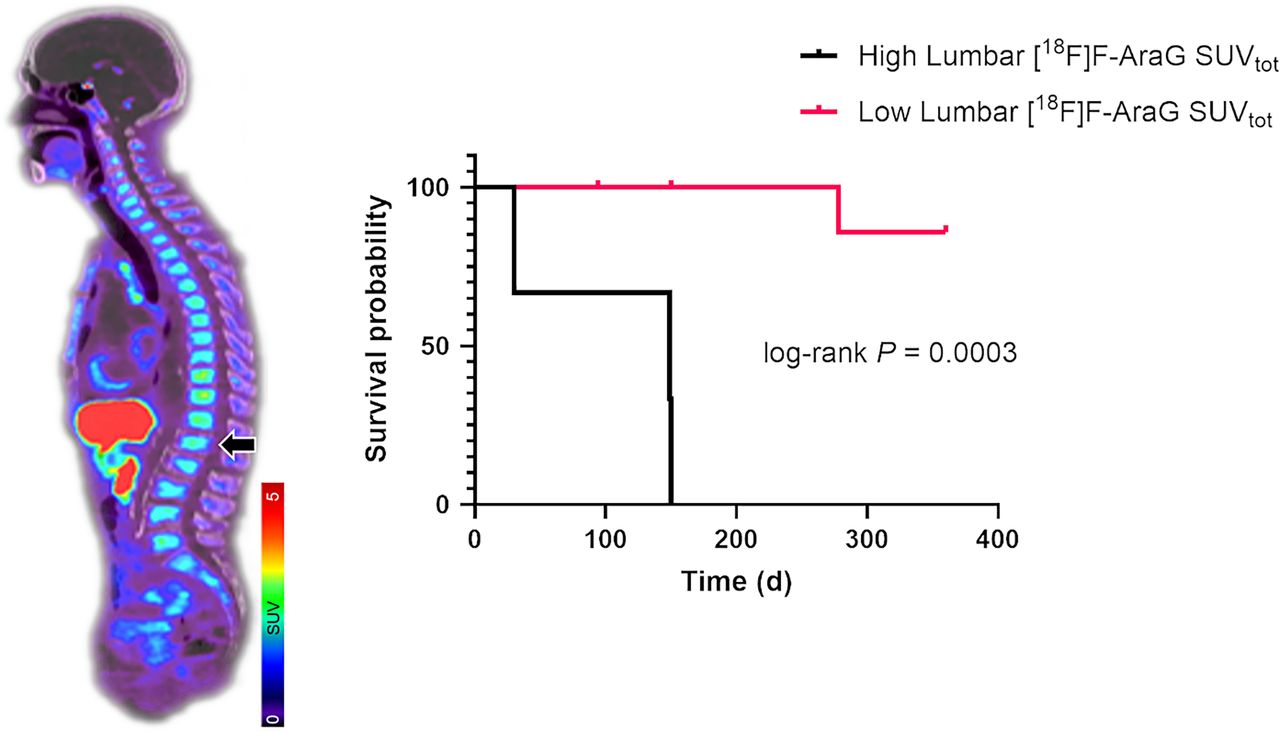
Visual Abstract

Abstract
Despite the systemic impact of both cancer and the associated immune response, immuno-PET is predominantly centered on assessment of the immune milieu within the tumor microenvironment. The aim of this study was to assess the value of [18F]F-AraG PET imaging as a noninvasive method for evaluation of system-wide immune status of patients with non–small cell lung cancer before starting immunotherapy. Methods: Eleven patients with advanced non–small cell lung cancer were imaged with [18F]F-AraG before starting immunotherapy. Diagnostic [18F]FDG PET/CT scans were analyzed to assess differences in the extent of disease among patients. SUVmax, SUVmean, and total SUV (SUVtotal) from all tumor lesions, active lymph nodes, spleen, vertebral bone marrow, liver, thyroid, heart, and bowel were extracted from the baseline [18F]F-AraG scans, and discriminant and Kaplan–Meier analyses were performed to test their ability to predict patient response and overall survival. Results: The extent of the disease was variable in the patient cohort, but none of the [18F]FDG biomarkers associated with tumor burden (SUVmax, total metabolic tumor volume, and total lesion glycolysis) was predictive of patient survival. The differences in the [18F]F-AraG and [18F]FDG distribution were observed both within and between lesions, confirming that they capture distinct aspects of the tumor microenvironment. Of the 3 SUV parameters studied, [18F]F-AraG SUVtotal provided a dynamic range suitable for stratifying tumors or patients according to their immune activity. [18F]F-AraG SUVtotal measured in the lumbar and sacral vertebrae differentiated between patients who progressed on therapy and those who did not with 90.9% and 81.8% accuracy, respectively. The Kaplan–Meier analysis revealed that patients with high [18F]F-AraG SUVtotal in the lumbar bone marrow had significantly lower probability of survival than those with a low signal (P = 0.0003). Conclusion: This study highlights the significance of assessing systemic immunity and indicates the potential of the [18F]F-AraG bone marrow signal as a predictive imaging biomarker for patient stratification and treatment guidance.
Lung cancer is the leading cause of cancer-related mortality in both women and men worldwide. Approximately 85% of lung cancers are classified as non–small cell lung cancer (NSCLC), a heterogeneous group of diseases with diverse molecular features and pathology (1). Immunotherapy has emerged as a breakthrough treatment for patients without driver mutations, becoming a fundamental element in the treatment of advanced disease. Immune checkpoint inhibitors, monoclonal antibodies directed at immune checkpoints, such as programmed death-1 (PD-1), or its ligand PD-L1, disrupt immune tolerance to cancer and enable effective and durable antitumor responses that lead to improved overall survival (2,3). Unfortunately, many patients do not benefit from the treatment, and identifying patients who will most likely respond to checkpoint inhibitors remains a difficult clinical challenge. The most extensively studied biomarkers of response rely on invasive biopsies and are confined to assessment only within the tumor microenvironment; they include PD-L1 expression, tumor mutational burden, and tumor-infiltrating lymphocytes. However, because of the inherent limitations of biopsy, those biomarkers cannot adequately capture heterogeneity of the immune contexture, both within a tumor lesion and between different lesions in patients with extensive disease (4). Furthermore, historical knowledge (5) and recent discoveries (6,7) underscore the significance of the global immune context and urge a shift away from exclusive focus on the tumor microenvironment and local immune aspects.
The capacity of PET to noninvasively monitor processes on a whole-body level makes it a particularly well-suited method for assessing system-wide immune status. Several PET tracers, differing in size and what they assess, are currently being investigated as biomarkers for immune profiling and assessment of immunotherapy response (8,9). Radiotracers that target immune activation, such as those assessing activation pathways (10) or markers such as CD69 (11) and OX40 (12), offer the ability to evaluate not only the presence but also the functional state of key players in adaptive antitumoral immune response. Small-molecule metabolic radiotracers are particularly appealing in this context, as their size facilitates effective penetration through biologic barriers and assessment of target distribution throughout the body (13). [18F]F-AraG is a small-molecule mitochondrial metabolic tracer that tracks activated T cells by assessing metabolic reprogramming associated with their function (14). Preclinically, [18F]F-AraG has shown utility in the evaluation of immunotherapy response (15) and also in immune profiling before initiating therapy (16). Characterization of pretreatment immune status and its correlation with response to therapy and clinical outcome are of critical importance in understanding the value of [18F]F-AraG PET in patient selection. In this study, we examine the systemic immune status of patients with NSCLC using pretreatment [18F]F-AraG scans and demonstrate that [18F]F-AraG uptake in vertebral bone marrow can predict clinical outcome.
MATERIALS AND METHODS
Study Participants and Clinical Trials
This study included patients enrolled in a clinical trial aimed at imaging T cell activation in patients with advanced NSCLC (NCT04726215). Participants were enrolled at 2 institutions: Palo Alto Veterans Affairs (5 patients) and Sutter Medical Center in Sacramento (6 patients). The studies were approved by the Stanford University panel on human subjects in medical research and the Sutter Health Institutional review board, and all participants signed a written informed consent form. Standard of care, diagnostic, [18F]FDG scans were also collected. The response to therapy was defined according to RECIST criteria (for patients at Sutter Medical Center) and based on the treating oncologist’s discretion (for patients at Palo Alto Veterans Affairs).
[18F]F-AraG PET/CT Imaging
[18F]F-AraG PET/CT imaging was performed at the institution where participants were enrolled following the same imaging protocol. Patients received a bolus venous injection of 185 MBq (±10%) of [18F]F-AraG, followed by whole-body imaging at approximately 60 min after injection. The GE Discovery MI and GE Discovery STE scanners were used at Palo Alto Veterans Affairs, whereas a Siemens Biograph 40 mCT was used at Sutter Medical Center. Images were reconstructed using iterative algorithms and using CT for attenuation correction. The following image reconstruction parameters were used: 3-dimensional (3D) infrared (3D ordered-subset expectation maximization) with time of flight on, 8 subsets, 3 iterations, and a 6.0-mm filter cutoff; no z-axis filter (GE Discovery MI); 3D infrared (3D ordered-subset expectation maximization) with no time of flight, 20 subsets, 2 iterations, and a 6.0-mm filter cutoff; no z-axis filter (GE Discovery STE) and TrueX with time of flight (ultra–high-definition PET) reconstruction, 2 iterations, 21 subsets, gaussian filter with a full width at half maximum of 2.0 mm (Siemens Biograph).
Image Analysis
All individual [18F]FDG and [18F]F-AraG PET/CT scans were analyzed using TRAQinform IQ (AIQ Solutions), a software-only medical device intended for use by trained medical professionals. A nuclear medicine physician manually identified regions of interest (ROI), which included lesions on [18F]FDG PET/CT images, and hot spots, with PET uptake elevated from the background, on [18F]F-AraG PET/CT images. [18F]F-AraG hot-spot contours were generated independently of [18F]FDG contours by referencing both CT and PET images. If the local SUV was significantly higher than that of the surrounding tissue or similar parts of the normal image, the ROI was included. Additionally, the ROIs were included if there was an abnormal presentation on the CT images. Automated organ contours were manually reviewed and corrected for motion and spillover. The TRAQinform IQ software performed automated matching of ROI across the [18F]FDG and [18F]F-AraG images (17–20) and performed quantitative analysis of ROI on the PET/CT images. Moreover, the software also performed automatic organ segmentation, trained using the method outlined in Weisman et al., to provide quantification and locations of lesion ROI (21).
From every PET/CT image, TRAQinform IQ software extracted single time-point image features from the scans in each individual ROI: SUVmax (the highest SUV within the ROI), SUVmean (the average SUV in the ROI), volume (the total volume of the ROI, which for [18F]FDG is equivalent to metabolic tumor volume [MTV]), and SUVtotal (the total SUV in the ROI, which for [18F]FDG is equivalent to total lesion glycolysis [TLG]). SUVmax, SUVmean, SUVtotal, and SUV volume were extracted for the liver, spleen, thyroid, bowel, heart, and spine.
Statistical Analysis
Means, medians, and SD of each quantitative variable and percentages for qualitative variables were computed. Kolmogorov–Smirnov tests were computed to assess normal distribution assumptions. The ability of the [18F]FDG and [18F]F-AraG measures for various patient organ and skeletal elements to distinguish between progressive disease and nonprogressive disease was investigated by a stepwise multivariate discriminant analysis. The aim of this analysis was to obtain measures that would yield the largest total correct classification percentage. The cutoff point for this discriminant analysis was then used by the univariate survival analysis using Kaplan–Meier plots and Mantel–Cox tests. All these analyses were performed using IBM SPSS Statistics for Windows, version 28.0. As a further validation of the cut point, a classification and regression tree analysis was performed using Minitab version 21.4.1 (Minitab LLC).
RESULTS
Patient Demographics
Eleven patients with advanced NSCLC were enrolled and imaged at 2 institutions: Palo Alto Veterans Affairs (5 patients) and Sutter Medical Center in Sacramento (6 patients) (Table 1). The cohort included 8 men and 3 women; all patients had stage IV disease. Two patients had liver metastasis, and no patient had brain metastasis. One patient received atezolizumab (a PD-L1 inhibitor), and 10 patients were treated with pembrolizumab (a PD-1 inhibitor). PD-L1 status was known for 5 patients (46%). The patients were followed for 12 mo, during which time 3 patients (27%) died. Four patients (36%) developed progressive disease, 5 patients (46%) had a partial response, 1 patient (9%) had stable disease, and 1 patient (9%) had a complete response.
Patient Characteristics
[18F]FDG Biomarkers Were Not Predictive of Survival in Patients with Metastatic NSCLC
As tumor burden affects patients’ responses to therapy (22), we analyzed baseline diagnostic [18F]FDG PET/CT scans to assess the differences in the extent of disease among patients. Diagnostic [18F]FDG PET/CT scans were available for all patients and were acquired 16–56 d (median, 36 d) before the [18F]F-AraG scan. We analyzed the SUVs most commonly associated with tumor burden: SUVmax, total metabolic tumor volume (tMTV), and TLG. The extent of the disease differed between patients (Fig. 1A). In the patient cohort, SUVmax ranged from 5.2 to 44.5, tMTV spanned from 27.8 to 790.5 cm3, and TLG ranged from 70.8 to 3,531.4. The Kaplan–Meier analysis did not show significant differences in the probability of survival between patients with different TLG (cutoff, 1,654.3; P = 0.40) or tMTV (cutoff, 362.6 cm3; P = 0.11) (Figs. 1B and 1C). Moreover, no significant differences in SUVmax were noted between patients who progressed on therapy and those who did not (Supplemental Fig. 1; supplemental material is available at http://jnm.snmjournals.org).

Tumor burden and overall survival. (A) Diagnostic [18F]FDG scan was used to assess extent of disease. Tumor burden differed greatly between patients. (B) Kaplan–Meier analysis did not show statistically significant difference in probability of survival between patients with different TLG (cutoff, 1,654.3). (C) Kaplan–Meier analysis did not show statistically significant difference in probability of survival between patients with different tMTV (cutoff, 362.6 cm3). Pt. = patient.
[18F]FDG and [18F]F-AraG Have Different Inter- and Intralesional Uptake Distribution
Our preclinical studies have shown that [18F]F-AraG, unlike [18F]FDG, selectively accumulates in activated T lymphocytes over tumor cells, providing information on immune contexture within the tumor microenvironment (15). In this patient cohort, differences between [18F]FDG and [18F]F-AraG uptake (Supplemental Table 1) were noted across various lesions within the same patient (Fig. 2A), as well as within the same lesion (Fig. 2B), capturing distinct aspects of the tumor microenvironment. Similar to what was observed in the preclinical studies (16), [18F]F-AraG’s intralesional distribution patterns resembled discrete cancer-immune phenotypes: inflamed, immune excluded, and immune desert (Fig. 2B). The observed differences between [18F]FDG and [18F]F-AraG, as well as [18F]F-AraG’s pattern of lesional uptake, indicate that within tumors [18F]F-AraG does not accumulate in cancer cells (15,23).

Inter- and intralesional differences between [18F]FDG and [18F]F-AraG. (A) Representative [18F]FDG and [18F]F-AraG patient images. [18F]F-AraG uptake differed between [18F]FDG-avid lesions. [18F]F-AraG accumulated in some (red arrowheads) but not all (white arrowheads) lesions. (B) Representative [18F]FDG and [18F]F-AraG transaxial slices showing lung lesion (arrowhead) in 3 patients. Intralesional signal distribution differed between [18F]FDG and [18F]F-AraG. [18F]F-AraG signal distribution resembles distribution of immune infiltrates in common cancer-immune phenotypes: immune excluded (immune cells on tumor margins, top row), immune desert (very few immune cells, middle row), and inflamed (immune cells in tumor core, bottom row).
[18F]F-AraG SUVtotal Offers a Dynamic Range Needed for Stratification of Immune Activity
SUVs are commonly used for quantitative assessment of [18F]FDG uptake. To understand the use of SUV measurements in the context of [18F]F-AraG and assessment of immune status, we extracted different parameters, SUVmax, SUVmean, and SUVtotal, and determined the extent of their variation within the patient cohort. The median maximum value for all 3 SUV parameters was considerably lower for [18F]F-AraG than for [18F]FDG (Table 2; Supplemental Table 2). The range of values for these parameters was also notably narrower for [18F]F-AraG than for [18F]FDG. Expectedly, the narrowest range was observed for SUVmean, whereas SUVtotal displayed the widest range. Although [18F]F-AraG SUVtotal provides a dynamic range essential for stratifying tumors or patients according to their immune activity, it is important to acknowledge that the variability in SUVtotal stems primarily from differences in lesion volume. Given its dependence on lesion size, [18F]F-AraG SUVtotal is most reliable for comparisons within lesions of similar sizes or among patients with comparable tumor burdens.
SUVs Detected for [18F]FDG and [18F]F-AraG in Lesions
[18F]F-AraG Uptake in the Vertebral Bone Marrow Identifies Patients with Progressive Disease
As cancer, a metastatic disease in particular, represents a complex systemic condition that affects immunity as well as distant organs (24), we assessed [18F]F-AraG accumulation in the spleen, vertebral bone marrow, liver, thyroid, heart, and bowel. [18F]F-AraG uptake in those organs differed greatly between patients (Fig. 3A; Supplemental Table 3). To comprehensively evaluate systemic immunity, we performed discriminant analysis using SUVs extracted from these organs along with those from all tumor lesions and active lymph nodes (Supplemental Table 4). [18F]F-AraG SUVtotal measured in the lumbar (Fig. 3B) and sacral vertebrae (Supplemental Fig. 2) differentiated between patients who progressed on therapy from those who did not with 90.9% and 81.8% accuracy, respectively. That stands in contrast to [18F]FDG SUVtotal measured in the vertebral bone marrow, which showed no significant distinctions (P = 0.44) between these 2 groups (Fig. 3C). [18F]F-AraG SUVtotal measured in the cervical and thoracic bone marrow did not differ significantly between patients who had progressive disease and those who did not (Supplemental Fig. 2). The volume of vertebral ROIs was not different between patients with progressive and those with nonprogressive disease, indicating that the findings for lumbar and sacral [18F]F-AraG SUVtotal were independent of volume effects (Supplemental Table 5).

[18F]F-AraG accumulation in lymphoid organs. (A) Accumulation in lymphoid and nonlymphoid organs differed between patients; white arrowheads point to bone marrow in lumbar vertebrae and iliac bone. (B) [18F]F-AraG SUVtotal in lumbar bone marrow differed significantly between patients with progressive disease and those without (*P = 0.046). (C) [18F]FDG SUVtotal in lumbar bone marrow did not differ significantly between patients who had progressive disease and those who did not (P = 0.44). L = liver; S = spleen; BM = bone marrow; PD = progressive disease; ns = not significant.
[18F]F-AraG SUVtotal in Lumbar Bone Marrow Predicts Overall Survival
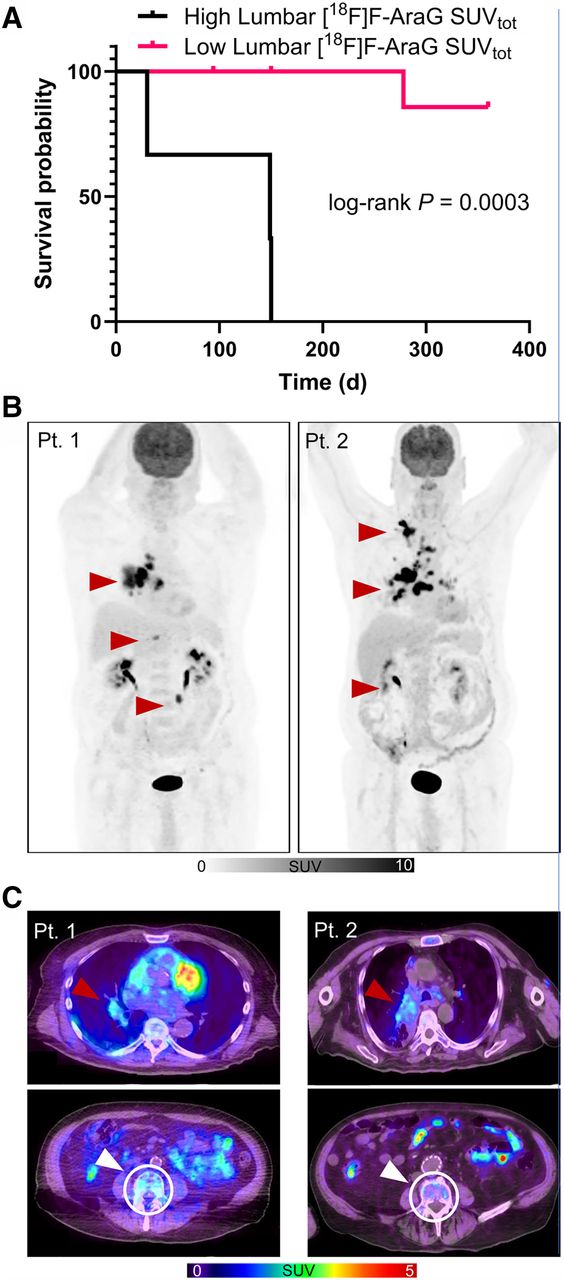
The discriminant analysis identified an optimal cutoff value of 485.9 for lumbar [18F]F-AraG SUVtotal, which stratified patients into high and low signal groups. The Kaplan–Meier analysis revealed that patients with high [18F]F-AraG SUVtotal in the lumbar bone marrow had a significantly lower probability of survival than those with a low signal (Fig. 4A). Notably, 2 patients with comparable tumor burden as assessed by [18F]FDG and similar immune tumor microenvironment as determined by intralesional [18F]F-AraG, but with contrasting lumbar bone marrow [18F]F-AraG SUVtotal, exhibited distinct clinical outcomes (Fig. 4; Supplemental Fig. 3). These results suggest that the [18F]F-AraG signal in the vertebral bone marrow could serve as a predictive biomarker of patient outcome. Further investigation is warranted to elucidate biologic mechanisms underlying the observed survival disparities.

High [18F]F-AraG uptake in lumbar bone marrow correlates with decreased overall survival. (A) Kaplan–Meier analysis revealed significantly lower probability of survival in patients with high accumulation of [18F]F-AraG in lumbar bone marrow. (B) Tumor burden in 2 patients with different clinical outcomes. Patient 1 (TLG, 1,800) had progressive disease and died less than 5 mo after starting therapy. Patient 2 (TLG, 2,162) had complete response and was alive at time of analysis, more than 12 mo after start of therapy. (C) Lung lesion in 2 patients showed comparable [18F]F-AraG accumulation (top row). [18F]F-AraG accumulation in bone marrow lumbar 4 vertebrae of patient with shorter survival was considerably higher than uptake in patient with longer survival. Pt. = patient.
DISCUSSION
Cancer is a systemic disease that affects the entire organism, including the immune terrain. Despite the systemic impact of both cancer and the associated immune response, tumor immunology is predominantly centered on the immune milieu within the tumor microenvironment. There is an urgent need for a more comprehensive understanding of the organismic immune context. In this study, we investigated [18F]F-AraG PET imaging as a noninvasive method for assessment of system-wide immune status of patients with advanced NSCLC before starting immunotherapy. We extracted potential [18F]F-AraG biomarkers from patients’ baseline scans and tested their ability to predict patient response and overall survival.
The patient cohort studied was heterogeneous, displaying large variations in the extent of the disease. As disease load affects immunity and response to immunotherapy (25), we first examined the value of [18F]FDG biomarkers associated with tumor burden in predicting patient overall survival. None of the analyzed [18F]FDG biomarkers, SUVmax, tMTV, and TLG, correlated with overall survival. Studies that investigated the predictive value of baseline [18F]FDG biomarkers in immunotherapy-treated patients with NSCLC have reported conflicting findings. Although Evangelista et al. did not observe significant differences in the whole-body TLG and MTV between responders and nonresponders (26), other studies reported an association between higher MTV and poor overall survival (27,28). The inconsistent findings could stem from the differences in how lesions are segmented, as well as the variations in patient characteristics across the studies. In our study, the expression of PD-L1, a biomarker of response to anti–PD-1 therapy, was unknown for more than half of the patients, and at least 3 patients had an expression level below the threshold linked with a favorable response to therapy. This may explain discrepancies with studies reporting the predictive value of tMTV and TLG, which included only patients with high PD-L1 expression (>50%). However, our findings remain clinically relevant as immunotherapy commonly extends to patients with lower PD-L1 expression (<50%).
The overlap in metabolic needs between cancer cells and activated immune cells leads to [18F]FDG accumulation in both, rendering [18F]FDG a nonspecific tracer for immune cells (29). In contrast to [18F]FDG and because of the intricate regulation of nucleotide pools and mitochondrial biogenesis in T cells (14), [18F]F-AraG has shown preferential accumulation in activated T lymphocytes. We observed differences in the distribution of these 2 tracers, both within and between lesions, which aligned with our expectations considering their respective targets. In contrast to [18F]FDG, which primarily indicates metabolically active cancer cells, the uptake patterns of [18F]F-AraG within tumor lesions resembled distinct immune landscapes observed clinically. The level of intralesional [18F]FDG uptake exceeded that of [18F]F-AraG, an expected finding considering the differences in the number of cancer and immune cells present within a lesion, as well as the level of glycolysis in relation to mitochondrial biogenesis (30). In addition, the range of the values for the 3 metrices tested was considerably lower for [18F]F-AraG than for [18F]FDG. The limited variability observed in [18F]F-AraG SUVmax across patients suggests that the highest image pixel intensity within the volume of interest may not be a suitable metric for accurate classification of immunologic activity within the tumor microenvironment. [18F]F-AraG SUVmean, indicative of average immune activity, also exhibited minimal variation between patients, whereas [18F]F-AraG SUVtotal, representing total immune activity, demonstrated a wider range of values across the patient cohort.
Interestingly, our study revealed substantial variability in the [18F]F-AraG SUVtotal within the lymphoid organs across patients. Although studies suggest the importance of the [18F]FDG signal in the spleen in immunotherapy response (31), in this patient cohort, neither [18F]FDG nor [18F]F-AraG SUVs in the spleen showed significant differences between responders and nonresponders (Supplemental Fig. 4). However, [18F]F-AraG SUVtotal in the lumbar bone marrow significantly differed between patients who experienced disease progression during immunotherapy and those who did not. In addition, the patients with high lumbar SUVtotal exhibited significantly lower overall survival compared with those with low vertebral signal. This finding is particularly intriguing in light of studies that suggest continuous communication between lung cancer and the bone marrow niche (32).
In patients with metastatic melanoma, a high baseline [18F]FDG signal in the bone marrow has been linked to varying clinical outcomes. One study found that an elevated [18F]FDG signal in the bone marrow indicated a favorable response to immunotherapy (33), whereas other studies reported a correlation with poor clinical outcomes (34–36). Although, in NSCLC, increased [18F]FDG metabolism in the bone marrow has been reported to inversely correlate with survival (37), in our study, we did not observe significant differences in bone marrow [18F]FDG uptake between responders and nonresponders.
Studies have reported elevated [18F]F-AraG signal in the bone marrow in both cancer patients (38) and postacute severe acute respiratory syndrome coronavirus 2 patients (39). The precise etiology of increased metabolism in the bone marrow remains elusive, despite various mechanisms having been proposed, including increased hematopoiesis (33), micrometastases (37), and systemic inflammation (35). In our preclinical studies, we observed elevated [18F]F-AraG uptake in the vertebral bone marrow in adrenergically stimulated mice as well as in mice with neuroinflammation (40). Imaging of mice deficient in T cells (Rag1 knockout) and bone marrow adipocytes (Letmd1 knockout) (41) after adrenergic stimulation demonstrated the crucial role of T cells in the increased [18F]F-AraG accumulation in the bone marrow. However, a comprehensive analysis of the bone marrow indicates that, in the context of adrenergic stimulation, the [18F]F-AraG signal in the lumbar bone marrow primarily originates from the tracer’s uptake in metabolically active bone marrow adipocytes rather than from its accumulation in T cells (40). The ongoing studies are focused on identifying the particular mechanisms that lead to a heightened [18F]F-AraG signal in the bone marrow.
In this study, we used diagnostic [18F]FDG scans that, in some patients, were acquired close to 2 mo before the [18F]F-AraG scan. This time gap may have contributed to some of the observed differences between the [18F]FDG and [18F]F-AraG findings. To improve the accuracy of future comparisons between these 2 tracers, we will aim to acquire [18F]FDG and [18F]F-AraG scans within a 7-d window.
CONCLUSION
This study was conducted with a small number of patients, and we anticipate that the cutoff values determined in this patient group will need to be reassessed and refined in a larger patient cohort. Despite the limitations of the study size, the results underscore the significance of evaluating systemic immunity and offer initial evidence suggesting the potential of the [18F]F-AraG bone marrow signal as a predictive imaging biomarker for patient stratification and treatment guidance.
DISCLOSURE
This work was supported by National Institutes of Health Contract NCI SBIR 7575N91022C00015 (to Jelena Levi). Jelena Levi, Hilda Cabrera, and Hee-Don Chae are employed by CellSight Technologies Inc. Jelena Levi holds patents related to [18F]F-AraG. No other potential conflict of interest relevant to this article was reported.
KEY POINTS
QUESTION: Do biomarkers extracted from a preimmunotherapy [18F]F-AraG scan correlate with treatment response and overall survival in patients with NSCLC treated with anti–PD-(L)1 immunotherapy?
PERTINENT FINDINGS: In a cohort of 11 patients with advanced NSCLC, [18F]F-AraG SUVtotal measured in the lumbar vertebrae differentiated between patients who progressed on therapy from those who did not with 90.9% accuracy. The Kaplan–Meier analysis revealed that patients with a high [18F]F-AraG SUVtotal in the lumbar bone marrow had significantly lower probability of survival than those with a low signal.
IMPLICATIONS FOR PATIENT CARE: The results highlight the significance of systemic immunity and suggest the potential use of the [18F]F-AraG bone marrow signal as a predictive imaging biomarker for patient stratification and treatment guidance.
Acknowledgments
This study is dedicated to the memory of Dr. Ananth Srinivasan, whose extraordinary intellect and boundless curiosity and enthusiasm for science profoundly impacted all who had the privilege of knowing him. We sincerely thank the patients who participated in this study for their time and commitment. We also appreciate the invaluable support of their families and medical providers.
Footnotes
↵† Deceased.
Published online Oct. 24, 2024.
- © 2024 by the Society of Nuclear Medicine and Molecular Imaging.
REFERENCES
- Received for publication June 16, 2024.
- Accepted for publication September 25, 2024.
In this issue


Jump to section
Related Articles
Cited By...
- No citing articles found.