


Visual Abstract

Abstract
Baseline metabolic tumor volume (MTV) is a promising prognostic marker in diffuse large B-cell lymphoma (DLBCL). We assessed the prognostic value of 4 novel metabolic risk scores in a real-life DLBCL cohort and compared them with the revised international prognostic index (IPI). Methods: We included a consecutive series of untreated DLBCL, not otherwise specified cases that were diagnosed in our hospital from 2008 to 2021 with available baseline [18F]FDG PET/CT. Clinical data were collected retrospectively, including the individual components of the revised IPI. MTV and other radiomic features, including lesion dissemination and tumor volume surface ratio, were calculated. Four novel metabolic risk scores including the international metabolic prognostic index (IMPI), the MTV/World Health Organization performance status, the MTV/standardized maximum distance, and clinical PET models were used to calculate the risk of progression using predefined cutoffs. Survival outcomes considered were 3-y progression free survival (PFS), 3-y time to progression (TTP), and 3-y overall survival (OS). The Harrell C-index was used to assess the discriminative performance of the risk scores. A multivariable model was built. Results: We included 355 DLBCL, not otherwise specified cases with a median MTV of 219 cm3 (range, 0–5,656 cm3). The IMPI had the highest C-index for 3-y PFS, 3-y TTP, and 3-y OS among the 4 metabolic risk scores (0.674, 0.696, and 0.677, respectively). For the 3-y TTP, the IMPI outperformed the strongest clinical risk score, the IPI, although the difference in the Harrell C-indices was small (0.696 vs. 0.693). Regarding the 3-y PFS and 3-y OS, the IPI has the highest C-index of all risk scores (0.696 and 0.693). The IMPI, the MTV/World Health Organization performance status, and the IPI score can recognize a poor risk group with a 3-y OS below 50% (43%, 32%, and 39%, respectively). In multivariable analysis, the IMPI remains an independent prognostic factor (P = 0.0089; hazard ratio, 1.207; 95% CI, 1.048–1.389). MTV and standardized maximum distance have the strongest prognostic values when used as a continuous variable. The tumor volume surface ratio has no significant prognostic value in our analysis. Conclusion: The IMPI has the strongest prognostic performance compared with the other 3 novel metabolic risk scores. However, in our real-world dataset, the IMPI could not replace the IPI, and further prospective trials are needed to compare their performance.
- diffuse large B-cell lymphoma
- metabolic tumor volume
- international metabolic prognostic index
- prognosis
- [18F]FDG PET/CT
Diffuse large B-cell lymphoma (DLBCL) is the most common lymphoid malignancy in adults, accounting for approximately 30% of all non-Hodgkin lymphomas in Western countries (1). More than 60% of patients can be cured with upfront R-CHOP (rituximab, cyclophosphamide, doxorubicin, vincristine, and prednisone). However, up to one third of the patients will become primary refractory or experience a relapse. Despite the development of novel treatments, including chimeric antigen receptor T-cell therapy, these patients are difficult to treat and have a poor prognosis (2). Recognizing high-risk patients upfront is of utmost importance to offer novel treatments early on and potentially improve prognosis. In contrast, recognizing low-risk patients can lead to deescalation of therapy and reduce short- and long-term toxicity of treatment. In 1993, the international prognostic index (IPI) was developed, consisting of 5 clinical factors (age, Ann Arbor stage, World Health Organization performance status (WHO PS), serum lactate dehydrogenase level, and extranodal involvement) (3). Since then, new treatments (such as the monoclonal antibody rituximab) have been introduced, and although the IPI remains prognostic, its ability to predict treatment failure has diminished (4,5). A recent report showed that the 5-y overall survival (OS) of the group with the poorest prognostic was still more than 50% (4). Efforts to improve on the IPI, such as the revised IPI (R-IPI) (6) and National Comprehensive Cancer Network IPI (7), have only made modest improvements.
[18F]FDG PET/CT–derived metabolic parameters, such as baseline metabolic tumor volume (MTV), have shown strong prognostic value in several lymphoma subtypes, including DLBCL (8–11). Besides MTV, which measures the tumor burden, other radiomic features can add additional information about the tumor characteristics. Lesion dissemination features, such as the maximum distance between 2 lesions (Dmax) and the maximum distance between the bulkiest lesion and another lesion (Dmaxbulk), measure the spread of the disease and have been shown to be correlated with outcome (12–14). The tumor volume surface ratio (TVSR) or fragmentation index, corresponding to the ratio of MTV divided by total tumor surface, describes the tumor fragmentation, and a higher TVSR (which indicates a more aggregated tumor) correlates with poorer prognosis in DLBCL (15).
Recently, novel risk scores have been developed combining clinical or metabolic characteristics. These include the MTV/WHO PS, MTV/standardized Dmax (SDmax), the international metabolic prognostic index (IMPI) (Ann Arbor stage, age, MTV), and the clinical PET score (age, WHO PS, MTV, SUVpeak, and Dmaxbulk). The advantage of the 2 latter risk scores is the use of MTV as a continuous variable as opposed to using a dichotomous cutoff, allowing for individual patient risk prediction. These 4 novel risk scores have been developed and validated in large clinical trials of untreated DLBCL and show a strong correlation with outcome (12–14,16–19). However, these risk scores have not yet been validated in real-life settings, in which patients with multiple comorbidities and patients of all ages are included, resulting in different outcomes compared with prospective trials.
The aim of this study is to validate the prognostic value of the 4 novel metabolic risk scores in a real-life DLBCL cohort and to compare them with the existing IPI and R-IPI clinical risk scores. Furthermore, we investigate the prognostic value of MTV, lesion dissemination, and TVSR in this real-life cohort.
MATERIALS AND METHODS
A detailed description of materials and methods can be found in the supplemental materials (supplemental materials are available at http://jnm.snmjournals.org).
A consecutive series of untreated DLBCL, not otherwise specified (NOS) patients diagnosed between January 1, 2008, and December 31, 2021, in our institution receiving mainly R-CHOP (rituximab, cyclophosphamide, doxorubicin, vincristine, and prednisone) treatment and who had a baseline [18F]FDG PET/CT scans were included in our study. Image analysis of [18F]FDG PET/CT was performed using MIM software (MIM Software Inc.). Two sets of semiautomatic delineations were created using an SUV of at least 4.0 and an SUVmax threshold of 41%. Subsequently, lesions that were not automatically segmented but were suspected of malignancy were manually delineated. Sites of physiologic uptake or nondisease-related uptake were manually removed. Finally, we calculated SUVmean, SUVmax, SUVpeak, MTV, total lesion glycolysis, total tumor surface, and TVSR from the union of the resulting volumes of interest. Lesion dissemination features were extracted, including Dmax, SDmax normalized by the patient’s body surface area, and Dmaxbulk. Four novel metabolic risk scores including the IMPI (age, stage, MTV), MTV/WHO PS, MTV/SDmax, and clinical PET model (MTV, Dmaxbulk, SUVpeak, WHO PS, and age) were used to calculate the risk of progression using predefined cutoffs as previously described (12,14,16,17).
RESULTS
Patients and Characteristics
In total, 383 eligible patients with de novo DLBCL, NOS and a baseline [18F]FDG PET/CT scan were included in this analysis. Patients scanned with a stand-alone PET camera (n = 24), with missing Digital Imaging and Communications in Medicine information (n = 3) or treatment before [18F]FDG PET/CT (n = 1), were excluded, leading to a final total of 355 patients included in this study. Main patient characteristics are summarized in Table 1.
Patient Characteristics (n = 355)
Of the 355 patients, 144 patients (40.6%) died during follow-up, including 20.8% (74/355) due to lymphoma progression, 6.20% (22/355) due to infection, 12.1% (43/355) due to other unrelated reasons, and 1.41% (5/355) due to unknown cause. The number of events for 3-y progression-free survival (PFS), OS, and time to progression (TTP) were 112, 90, and 65, respectively. The outcomes for the entire cohort after 3 y were 67.6% (95% CI, 62.4%–72.3%) for PFS, 73.8% (95% CI, 68.8%–78.2%) for OS, and 79.1% (95% CI, 74.1%–83.3%) for TTP (Supplemental Fig. 2).
The descriptive statistics of the conventional metabolic, dissemination, and fragmentation PET features are reported in Table 2. The relationship between baseline MTV as a continuous variable and 3-y PFS was examined. On the basis of previous data, we first fitted a linear spline model with 1 knot located at the median MTV value (16). However, a second model based on a logarithmic transformation of MTV provided a better model fit than did the linear spline model (Supplemental Fig. 3).
Descriptive Statistics of Conventional Metabolic, Dissemination, and Fragmentation PET Features
Patients without measurable disease on [18F]FDG PET/CT (n = 20) before the start of any treatment (no macroscopic disease after resection of index lesion) were considered to have an MTV of 0 mL. In all stage I patients, we found no significant difference in outcome when compared with patients with an MTV greater than 0 (Supplemental Table 1).
Diagnostic Performance of Metabolic Risk Scores
Table 3 summarizes the discriminative value of currently used risk scores and novel metabolic risk scores using the Harell C-index for all 3 outcomes considered. Using a 3-y PFS as the outcome, the C-index of the IPI is the highest (0.696), followed by the IMPI (0.674), the clinical PET score (0.656), and the R-IPI (0.652). The lowest discriminative power is seen for MTV/SDmax (0.568), followed by Ann Arbor stage (0.588) and MTV/WHO PS (0.615). Among the 4 metabolic risk scores, the IMPI yielded the highest C-indices for all 3 outcomes, outscoring the clinical risk scores for 3-y TTP. We hypothesized that the risk models would have reduced prognostic value for patients with central nervous system invasion at diagnosis or those receiving palliative treatment. However, removing these patients yielded C-indices similar to those for the whole cohort (Supplemental Table 2).
Prognostic Value of Tested Clinical and Metabolic Risk Scores Using 3-Year PFS, 3-Year TTP, and 3-Year OS as Outcomes
To visually present the diagnostic performance of the continuous metabolic risk scores (IMPI and clinical PET score) in comparison to categoric risk scores, continuous scores were categorized and data were presented by Kaplan–Meier curves for metabolic (Figs. 1 and 2) and clinical risk scores (Fig. 3). For the IMPI, 3 risk groups were defined on the basis of the following cutoff values for risk of 3-y PFS: less than 0.285 (low), 0.285–0.406 (intermediate), greater than 0.407 (high). These categories correspond to primary refractory disease incidence (10%), relapse after initial response (30%), and long-term remission (60%). For the clinical PET score, 3 groups were defined as those with 10% worse risk scores (high), 60% best risk scores (low), and 30% in between (intermediate risk) (14,16). Kaplan–Meier analysis showed that 3-y PFS for the highest risk group was 40% in the IMPI, 33% in the MTV/WHO PS, 44.3% in the MTV/SDmax, and 51.9% in the clinical PET score. The 3-y PFS in the highest risk groups was 35.8% in the IPI score and 51.7% in the R-IPI score. MTV/WHO PS and IMPI can recognize a small group of patients (7.3% (26/355) and 9.6% (34/355), respectively) with a very poor prognosis with a 3-y OS of less than 50%. Both MTV/SDmax and clinical PET scores can only recognize 2 risk groups in this analysis. Of note, when dividing the population into a low-risk group (81%) and a high-risk group (19%) for the clinical PET score (as was suggested in the original research and is based on the proportion of patients with an IPI of 4 or 5), the highest risk group had a 3-y PFS of 62.3% (Supplemental Fig. 4) (19).

Kaplan–Meier survival curves for PFS by IMPI with low-risk (60%), intermediate-risk (30%), and high-risk (10%) categories (A); MTV/WHO PS by number of risk factors (0, 1, or 2) (B); MTV/dissemination by number of risk factors (0, 1, or 2) (C); clinical PET score with low-risk (60%), intermediate-risk (30%), and high-risk (10%) categories (D). P values show significance. RF = risk factor.

Kaplan–Meier survival curves for OS by IMPI with low-risk (60%), intermediate-risk (30%), and high-risk (10%) categories (A); MTV/WHO PS by number of risk factors (0, 1, or 2) (B); MTV/dissemination by number of risk factors (0, 1, or 2) (C); clinical PET score with low-risk (60%), intermediate-risk (30%), and high-risk (10%) categories (D). P values show significance. RF = risk factor.

PFS (top) and OS (bottom) according to IPI subgroups (A) and R-IPI subgroups (B).
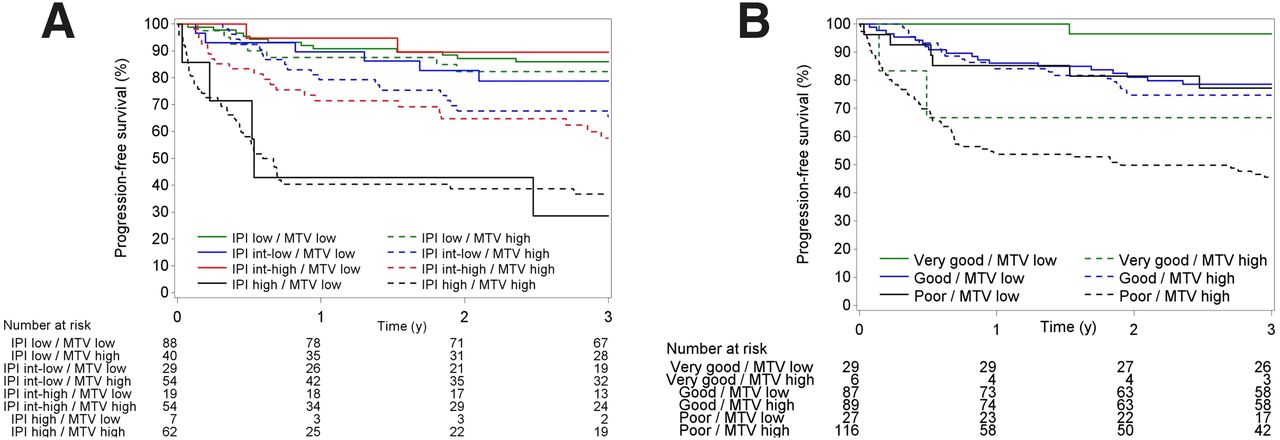
A further exploratory analysis of the role of MTV per the IPI and R-IPI risk groups was performed (Fig. 4). For the IPI, the prognostic value of MTV is mainly driven by the patients in the intermediate–low risk and intermediate–high risk groups. High-risk patients according to the IPI have a high risk of progression, regardless of MTV. For the R-IPI good-risk category, there is no difference between high or low MTV, whereas good and poor-risk categories can be dichotomized on the basis of the MTV level.

Kaplan–Meier survival curves for PFS according to IPI (A) and R-IPI (B) score, dichotomized into low MTV (≤135 mL) or high MTV (>135 mL).
Prognostic Value of MTV, Dissemination, and TVSR
MTV can be used as a continuous or categoric variable using an optimal cutoff as determined by maximum likelihood estimation, cutoff by median or quartiles, or by expected clinical outcomes (60/30/10% rule). In our analysis, the strongest prognostic value for all 3 outcomes was found using MTV as a continuous value. That and the same analysis for SDmax and TVSR can be found in Table 4. We observed the strongest prognostic value for SDmax used as a continuous variable. TVSR has no significant prognostic value in our data.
Prognostic Value of MTV, Dissemination, and Fragmentation Index
Building a Multivariable Model
In univariable analysis, all separate components of the IPI, the type of first-line treatment, the R-IPI, the presence of central nervous system invasion, MTV, total lesion glycolysis, and dissemination were significantly correlated with outcome. Since the IMPI was found to be the strongest metabolic risk score, it was also considered as a variable, showing a significant association with PFS (P < 0.0001). Sex, SUVmax, SUVmean, SUVpeak, and TVSR were not associated with PFS. The following variables were considered in the building of a multivariable model: the IMPI score, the WHO PS, the lactate dehydrogenase level, the number of extranodal sites, central nervous system invasion, total lesion glycolysis, and SDmax. Since all separate components of the R-IPI were included, the R-IPI was no longer included. In multivariable analysis, 4 factors were independently associated with worse PFS: a WHO PS greater than 1 (hazard ratio, 2.836; 95% CI, 1.771–4.543), elevated lactate dehydrogenase level (hazard ratio, 1.713; 95% CI, 1.009–2.671), central nervous system invasion (hazard ratio, 3.347; 95% CI, 1.202–9.316), and IMPI (hazard ratio, 1.207; 95% CI, 1.048–1.389) (Table 5). A weighted combination of these 4 risk factors (Supplemental Appendix 1) led to a novel real-world metabolic risk score with a C-index of 0.706 (95% CI, 0.656–0.756) for PFS in our cohort (Fig. 5).
Univariable and Multivariable Analysis of Factors Influencing PFS

Kaplan–Meier survival curves for PFS (A) and OS (B) by novel real-world metabolic risk score with low-risk (60%), intermediate-risk (30%), and high-risk (10%) categories.
DISCUSSION
In this study, we validated the prognostic value of 4 novel metabolic risk scores (IMPI, MTV/WHO PS, MTV/SDmax, and clinical PET score) in a real-life untreated DLBCL, NOS cohort and compared them with the existing clinical risk scores. Furthermore, we developed a real-world metabolic risk score in our cohort.
The development of the IMPI represents a significant advance for implementing MTV in lymphoma research and clinical care, for example, by selecting high-risk patients upfront for novel treatments. Using MTV and age as continuous variables in combination with disease stage as a categoric variable (I–IV), the 3-y PFS can be predicted on an individual basis for newly diagnosed DLBCL treated with R-CHOP (16). Although the original research found a linear spline model with 1 knot located at the median MTV value to be the best expression of the relationship between MTV and survival, in our analysis, the best fit was a logarithmic transformation of MTV. Only one other study evaluated the prognostic value of IMPI in first-line setting (20). In a post hoc analysis of 166 patients receiving risk-adapted frontline immunochemotherapy for untreated DLBCL, the IMPI overestimated the event rates, possibly due to a more intensified treatment in these trials (patients received additional immunochemotherapy with rituximab, ifosfamide, carboplatinum, and etoposide). Two other studies investigated the performance of the IMPI in a relapsed/refractory setting. A correlation between IMPI and PFS was found in a small group (n = 39) of relapsed/refractory DLBCL patients treated with chimeric antigen receptor T-cell therapy but not with a duration of response or OS. In this setting, the IMPI outperformed the IPI; however, the results need to be interpreted with caution because of the limited number of subjects (21). Lastly, an analysis of 138 patients with relapsed/refractory DLBCL treated with loncastuximab tesirine in the LOTIS-2 trial showed that the IMPI demonstrated an appropriate performance; however, it was not better than MTV alone (22). In our dataset, the IMPI had the highest model performance for 3-y PFS, 3-y TTP, and 3-y OS among the 4 recently developed novel risk scores. For 3-y TTP, the IMPI even outperformed the strongest clinical risk score, the IPI, although the difference in the Harrell C-indices was small (0.696 vs. 0.693, P = 0.524). Since DLBCL is generally a disease of elderly patients, their outcome is determined not only by lymphoma but also by age-related comorbidities and limited life expectancy. Therefore, TTP is an important outcome parameter for prognostication as it is not affected by age, unlike PFS and OS. Furthermore, the IMPI retained statistical significance in multivariable analysis for PFS. Regarding the 3-y PFS and 3-y OS, the IPI still has the highest model performance of all risk scores. Thus, our results confirm the prognostic value of IMPI, outperforming the other 3 recently developed novel metabolic volume risk scores. However, in our dataset, the IMPI could not replace the IPI, and further prospective trials will be needed to compare their performance.
Survival analysis shows a significant separation of the 3 risk groups of the IMPI, whereas the curves of intermediate–low and intermediate–high IPI overlap. Lastly, the R-IPI was best at detecting a group of patients (35/355, 9.9%) with a very favorable outcome (3-y PFS, 91.4%; 3-y OS, 94.3%).
A recent analysis of 2,124 DLBCL patients treated in randomized clinical trials found that neither the IPI nor the R-IPI could identify a patient subgroup with long-term survival clearly below 50% in the rituximab era (4). In our analysis, the IPI can detect a high-risk group with a 3-y OS of 38.7%. Furthermore, the IMPI and MTV/WHO PS can also detect a high-risk group with a long-term survival of less than 50%. The worse outcome in our cohort can likely be explained by the fact that we investigated a real-life cohort. This includes patients with comorbidities, higher age, and even noncurative intent. Notably, removing the noncurative intent patients from the cohort did not alter the prognostic value of the risk scores.
We evaluated the prognostic power of [18F]FDG PET/CT metrics as continuous or dichotomous variables. Our dataset confirms the use of MTV as a continuous variable, which has the advantage of making individual survival predictions and avoiding the loss of valuable information. Dissemination features such as SDmax offer additional information on tumor spread and were significantly correlated with the outcome in our analysis; however, the discriminatory power was less than that for MTV or the IMPI. TVSR showed no clear correlation with outcome in this analysis.
The limitations of our analysis are the retrospective nature of our study and the monocentric design. As strengths of the study, we note that this is a consecutive series of real-life patients presenting in the daily clinic. Furthermore, patients without measurable disease on [18F]FDG PET/CT are typically excluded when developing imaging-based prognostic indices. We included these patients and assigned an MTV of 0, since excluding these patients represents an important limitation of any risk score in daily practice. However, since SUVpeak cannot be calculated in these patients, the clinical PET score could not be used in these patients, and this is a limitation of this scoring system. Importantly, using predefined cutoff points (as described in previous publications) for all 4 novel risk scores, our results were not data-driven. Lastly, we used both the fixed threshold SUV of at least 4.0 method and the SUVmax of 41% method for lesion delineation, using the first method for the clinical PET and IMPI models and the second method for the MTV/WHO PS and MTV/SDmax models as was previously described.
CONCLUSION
In this real-life cohort of untreated DLBCL, NOS patients, we validated the prognostic value of 4 novel metabolic risk scores (the IMPI, the MTV/WHO PS, the MTV/SDmax, and clinical PET scores) and compared them with the existing clinical risk scores. The IMPI has the strongest prognostic performance compared with the other 3 novel metabolic risk scores. However, in our dataset, the IMPI could not replace the IPI, and further prospective trials are needed to compare their performance.
DISCLOSURE
Daan Dierickx holds a mandate for Clinical and Translational Research from Kom op tegen Kanker (2017/10908/2816). Thomas Tousseyn holds a Mandate for Fundamental and Translational Research from the Stichting tegen Kanker (2019-091) and is a cofounder of the Fund “Me To You” supporting research in lymphoma and leukemia. Christophe Deroose is a Senior Clinical Investigator from the Research Foundation—Flanders (FWO). No other potential conflict of interest relevant to this article was reported.
KEY POINTS
QUESTION: Which of the recently developed metabolic risk scores is best at predicting outcome in untreated DLBCL in real life? And can these metabolic risk scores replace the current clinical risk scores (IPI and R-IPI)?
PERTINENT FINDINGS: In a retrospective analysis of 355 untreated DLBCL, NOS patients, the IMPI was the strongest at predicting outcome compared with 3 other novel metabolic risk scores. The IMPI can detect a high-risk group with a dismal prognosis (3-y OS, 43%). When the metabolic risk scores were compared with the clinical risk scores, the IPI remains the best prognostic tool for predicting 3-y PFS and 3-y OS. However, the IMPI is best at predicting disease relapse.
IMPLICATIONS FOR PATIENT CARE: Incorporating baseline MTV in risk scores can improve outcome prediction, enabling us to recognize high-risk patients upfront and select them for novel treatments. However, in our real-world dataset, these novel risk scores could not replace the IPI.
Footnotes
Published online Nov. 7, 2024.
- © 2024 by the Society of Nuclear Medicine and Molecular Imaging.
REFERENCES
- Received for publication May 31, 2024.
- Accepted for publication September 30, 2024.
In this issue


Jump to section
Related Articles
Cited By...
- No citing articles found.